IOSTUSDT — At a Major Crossroad: Accumulation or Breakdown?🔎 Overview
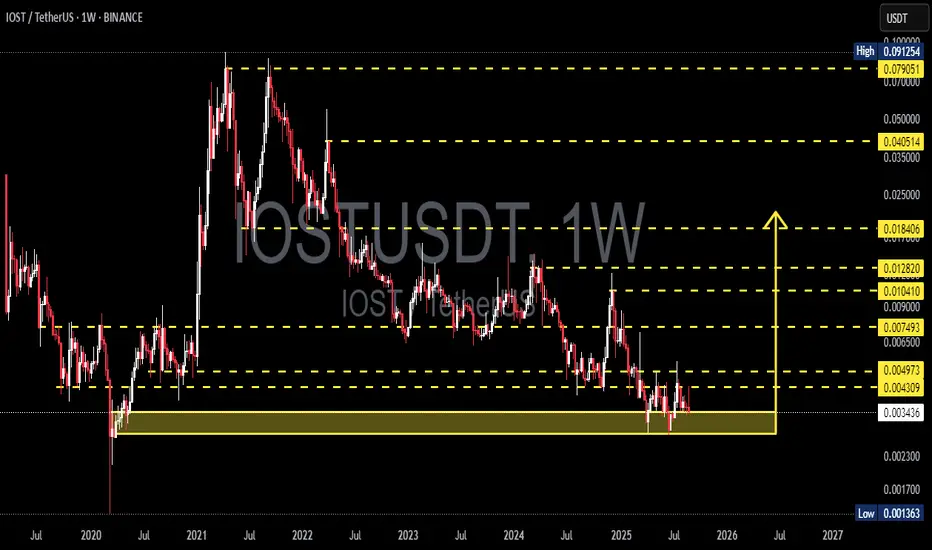
IOST is currently trading inside a multi-year demand zone (0.0024–0.0037) which has repeatedly acted as a strong support since 2019. Each touch of this area has been met with buying interest, leaving long rejection wicks and suggesting hidden accumulation.
However, the broader market structure remains bearish, with a clear series of lower highs since 2021. This puts the market at a critical juncture:
➡️ Will this demand zone once again serve as a base for accumulation and trigger a major reversal?
➡️ Or will selling pressure finally push price below the floor, opening the path to historical lows at 0.00136?
---
📌 Key Technical Levels
Critical Demand Zone: 0.0024 – 0.0037
Nearest Resistance: 0.004309 → 0.004973
Mid-Term Targets: 0.007493 → 0.00900 – 0.01041
Trend Pivot: 0.01282 (a breakout here could shift the macro trend bullish)
Swing Bullish Targets: 0.018406 → 0.040514 → 0.079051
Major Invalidation: Weekly close below 0.0024 = risk of continuation down to 0.00136
---
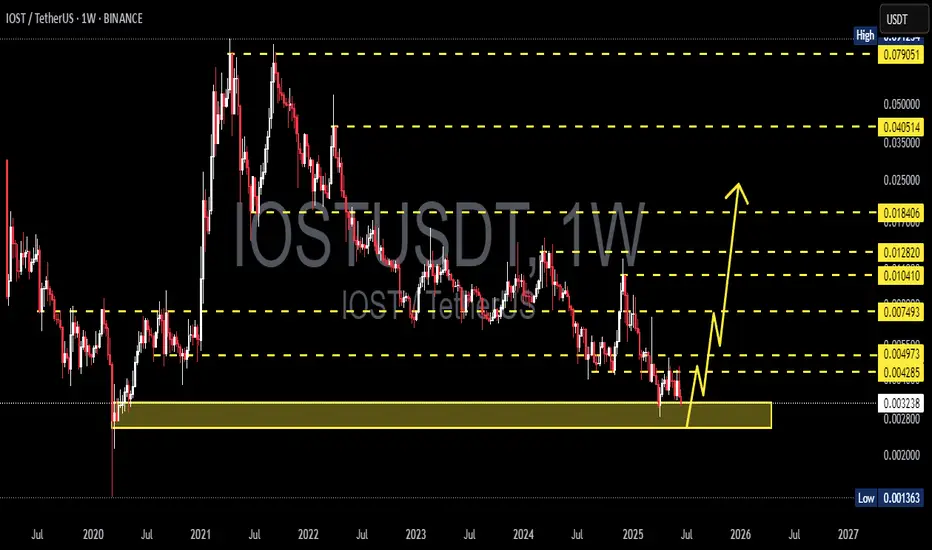
🟢 Bullish Scenario
1. Early Confirmation: Weekly close above 0.004309 signals the first sign of buyers stepping in.
2. Minor Range Break: Breaking 0.004973 opens the way to 0.007493.
3. Momentum Expansion: Close above 0.007493 would target the supply zone at 0.009 – 0.01041.
4. Full Reversal: Sustained weekly close above 0.01282 could mark the end of the multi-year downtrend, unlocking upside potential toward 0.018406 and possibly higher (0.040–0.079).
---
🔴 Bearish Scenario
1. Failure to break 0.004309 – 0.004973 and another rejection may pull price back into the demand zone (0.0024–0.0037).
2. A weekly close below 0.0024 would confirm a breakdown from demand.
3. Next downside target lies at 0.00136 (historical low), a possible capitulation area before any larger rebound.
---
📐 Pattern & Market Behavior
Range-Bound Accumulation: Current structure is trapped in a narrow 0.0030 – 0.0049 range. Breakout in either direction will define the next major move.
Potential Wyckoff Spring: The repeated wicks below demand suggest liquidation + buyer absorption, a common pattern before strong markups.
But caution: Without a breakout confirmation above resistance, this may still turn into a bull trap.
---
🎯 Trading Idea (Not Financial Advice)
Aggressive Play: Enter within demand 0.0024–0.0037, SL below 0.0024, take partial profits at 0.00431 & 0.00497.
Conservative Play: Wait for a confirmed breakout above 0.00497 and enter on a retest, targeting 0.00749 – 0.01041.
Risk Management: Keep positions small; volatility on small-cap alts can be extremely high.
---
📝 Conclusion
IOST stands at a major decision point. As long as it holds above the multi-year demand, the case for accumulation and reversal remains alive. But if demand fails, the market could revisit 0.00136. Staying disciplined at the key levels is crucial to avoid being caught in false moves.
#IOST #IOSTUSDT #Crypto #Altcoin #PriceAction #TechnicalAnalysis #SupportResistance #DemandZone #Breakout #SwingTrade #RiskManagement #DYOR
IOSTUSD
IOSTUSDT - Mid Term AnalysisThe coin is good, but everything is bad unless you buy it at the right price.
I like IOST, but I won’t touch it unless it comes to a price that makes sense for me. If it drops to my levels, I will look for:
✅ Footprint absorption
✅ CDV support
✅ Structure reclaim for confirmation
If these align, I will consider a long with clear risk management. If not, I will wait.
No rush, no fear of missing out. The right price or no trade.
📌I keep my charts clean and simple because I believe clarity leads to better decisions.
📌My approach is built on years of experience and a solid track record. I don’t claim to know it all but I’m confident in my ability to spot high-probability setups.
📌If you would like to learn how to use the heatmap, cumulative volume delta and volume footprint techniques that I use below to determine very accurate demand regions, you can send me a private message. I help anyone who wants it completely free of charge.
🔑I have a long list of my proven technique below:
🎯 ZENUSDT.P: Patience & Profitability | %230 Reaction from the Sniper Entry
🐶 DOGEUSDT.P: Next Move
🎨 RENDERUSDT.P: Opportunity of the Month
💎 ETHUSDT.P: Where to Retrace
🟢 BNBUSDT.P: Potential Surge
📊 BTC Dominance: Reaction Zone
🌊 WAVESUSDT.P: Demand Zone Potential
🟣 UNIUSDT.P: Long-Term Trade
🔵 XRPUSDT.P: Entry Zones
🔗 LINKUSDT.P: Follow The River
📈 BTCUSDT.P: Two Key Demand Zones
🟩 POLUSDT: Bullish Momentum
🌟 PENDLEUSDT.P: Where Opportunity Meets Precision
🔥 BTCUSDT.P: Liquidation of Highly Leveraged Longs
🌊 SOLUSDT.P: SOL's Dip - Your Opportunity
🐸 1000PEPEUSDT.P: Prime Bounce Zone Unlocked
🚀 ETHUSDT.P: Set to Explode - Don't Miss This Game Changer
🤖 IQUSDT: Smart Plan
⚡️ PONDUSDT: A Trade Not Taken Is Better Than a Losing One
💼 STMXUSDT: 2 Buying Areas
🐢 TURBOUSDT: Buy Zones and Buyer Presence
🌍 ICPUSDT.P: Massive Upside Potential | Check the Trade Update For Seeing Results
🟠 IDEXUSDT: Spot Buy Area | %26 Profit if You Trade with MSB
📌 USUALUSDT: Buyers Are Active + %70 Profit in Total
🌟 FORTHUSDT: Sniper Entry +%26 Reaction
🐳 QKCUSDT: Sniper Entry +%57 Reaction
📊 BTC.D: Retest of Key Area Highly Likely
📊 XNOUSDT %80 Reaction with a Simple Blue Box!
📊 BELUSDT Amazing %120 Reaction!
📊 Simple Red Box, Extraordinary Results
📊 TIAUSDT | Still No Buyers—Maintaining a Bearish Outlook
📊 OGNUSDT | One of Today’s Highest Volume Gainers – +32.44%
📊 TRXUSDT - I Do My Thing Again
📊 FLOKIUSDT - +%100 From Blue Box!
📊 SFP/USDT - Perfect Entry %80 Profit!
📊 AAVEUSDT - WE DID IT AGAIN!
I stopped adding to the list because it's kinda tiring to add 5-10 charts in every move but you can check my profile and see that it goes on..
IOSTUSDT 1W AnalysisIOST ~ 1W Analysis
#IOST Buy back gradually from here with a short term target of at least 20%+ from this support.
IOSTUSDT 1WIOST ~ 1W Analysis
#IOST Buy gradually from here with a short -term target of at least 20%+. This is a very good support for now.

IOSTUSDT 1WIOST ~ 1W Analysis
#IOST Buy back from here with a short -term target of at least 20%+ from here.

IOSTUSDT 1WIOST ~ 1W Analysis
#IOST So far it still maintains this block of support. Buy from here with a minimum target of 20%++.

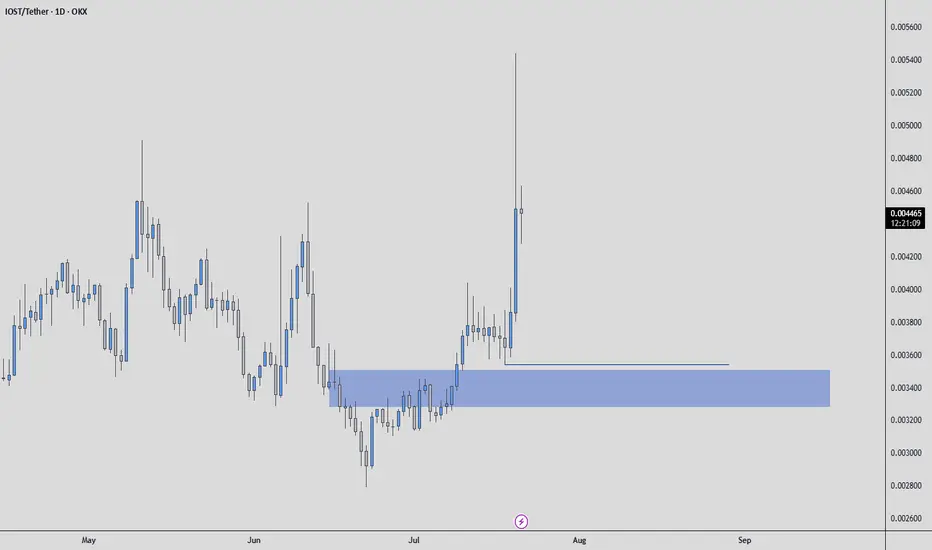
IOST - 4h - Accumulation RangeIOST - 4h - Accumulation Range
REMEMBER that a lot of investors sell stocks or crypto for fiscal conditions in 2024 to close the year.
For that, we have low buy liquidity , and even with that pressure on the price , IOST is trying to remaning in the same range as 1 week ago, so a breakout can restart a new HH , so patience.
Im bullish on it if the 0.0074usd resistance its broken and became a support.

IOSTUSDT 1WIOST ~ 1W
#IOST If you still have Conviction on the coin,. Buy gradually within this support block,. with a short term target of at least 20%++

IOST RECLAIMS LEVEL#IOST has made a higher low off a very clear bottoming formation after breaking out of a Descending Channel(BullFlag)!
I expect to see IOST to make its way towards the Golden Pocket @ $0.035 and possibly much higher!

IOST Bottom Fractals IOST PA exhibiting an interesting pattern when bottom. Chart speaks and so we listen!
The bottom pattern is slightly smaller or less volatile than the last, which I believe is a sign of maturity (less manipulation).
It's true that 5 is slightly more pronounced in the previous bottom but again most likely due to manipulation. So we can disregard the long wicks. Other than that it's an exact replica of the PA.
Cheers

IOSTUSDT 5DIOST ~ 5D 📈
#IOST Make purchases gradually, After breaking through this resistance line, with a Target of at least 20%++ from here. 🔼

#IOST/USDT#IOST
We have a down channel that has just been broken very nicely
We have a strong rising trend on RSI as well
We have a higher stability than the Moving Average 100 and we have an upward discount
The pattern is canceled if the day is closed with a strong bearish candle below the green support area
Entry price is 0.00943
The first target is 0.00970
The second goal is 0.01015
The third goal is 0.01071

IOST on a clear path to the upsideIOST is gearing for a bull move next. MACD is turning green. RSI is turning bullish. The stars are lining up.
Will there be wick down the bottom of the wedge to shake things out? If so I'll be sure to buy more.
NFA

IOST is leaving its bear market behindIOST is about to pump. I think it will hit $0.50 next year. Cheers!
This is NOT financial advice.

IOST has a very good investment opportunity Hi Everyone;
today we have a good risk to reward Investment opportunity
it is more than 420 times the risk and the chart is look very promising.
I expect breaking the previous bear market key point will clear the way to the final target

A point where you can buy from a long-term perspectiveHello?
Traders, welcome.
If you "Follow", you can always get new information quickly.
Please also click "Boost".
Have a good day.
** Analysis of the BTC chart publishes new ideas once a week.
** However, we publish new ideas when volatility occurs or when we show signs of diverging from our expectations.
** Excluding the above situation, BTC analysis is listed as a daily update.
-------------------------------------
(IOSTUSDT chart)
(1W chart)
The question is whether the price can sustain the rise above 0.01361.
It is important whether it rises above the HA-High index or shakes up and down to make the HA-High index fall.
If it fails to rise above 0.01361, it should check for support near 0.00746.
(1D chart)
The 0.01144 point is the HA-Low indicator point on the 1M chart.
Therefore, finding support around 0.01144 means buying is possible from a long-term perspective.
Therefore, the key is whether it can rise with support around 0.01144.
I think the point where a full-scale uptrend is expected to start is when it rises above 0.02150.
However, we need to see if we can make the HA-High indicator on the 1W chart decline while moving sideways in the 0.01631-0.02150 range.
-------------------------------------------------- -------------------------------------------
** All descriptions are for reference only and do not guarantee profit or loss in investment.
** Even if you know other people's know-how, it takes a considerable period of time to make it your own.
** This is a chart created with my know-how.
---------------------------------

IOSTUSDT perfect continuation of the trendYet another coin bouncing off the trendline super precisely. This is a strong bullish sight and we can capitalize on this great RR buying opportunity.

IOST coin formed bullish BAT for upto 37.50% pumpHi dear friends, hope you are well and welcome to the new update on IOST coin with US Dollar pair.
Previously we caught a nice pump of IOST as below:
On a 4-hr time frame, IOST has formed a bullish BAT pattern for another bullish reversal move.
Note: Above idea is for educational purpose only. It is advised to diversify and strictly follow the stop loss, and don't get stuck with trade

IOST/BTCIOST After testing the bottom, now beautifully respects the upward trendline.
Now it's good to accumulate and wait for profits.

#IOST #IOSTUSDT 4H ENDING DIAGONAL PATTERNDue to the formation of a diagonal or wedge pattern in a long-term support range, there is a possibility that the price will rise to the following targets:
0.0175
0.0207
0.0249
0.0298
STOPLOSS: 0.0104

IOST Bearish SentimentSeptember has major catalysts for the crypto market as well as for the stock market.
The Ethereum merge on September 6th, that will end on Sept 20, the inflation report on September 13 and the next FOMC meeting afterwards with the new interest rates hike.
That is reflected in the crypto space in general as a bearish outlook.
IOST has a negative overall sentiment recently.
I have the following price targets:
IOST/USDT
Entry Range: $0.012 - 0.014
Price Target 1: $0.011
Price Target 2: $0.009
Price Target 3: $0.008
Stop Loss: $0.016

IOST/USDT - Potential Short ScenarioHello Traders!
The downward price formation of IOST continues. The price is testing the support level of $0.01350
Based on the analysis of senior timeframes, it is possible to assume the continuation of the downward price trend to the levels of January 2021. In this case, we can consider the set of medium-term positions, which we can gain at the support level of $0.00466 in the price range of $0.00466 - $0.00760.
The targets of such purchases will be the levels of $0.01350 and $0.02100
Good luck and watch out for the market
P.S. This is an educational analysis that shall not be considered financial advice

IOSTUSDT: Time to Buy?
IOST is taking off from a strong daily structure support.
The price formed a cute head & shoulders pattern on that
and then broke its neckline, confirming the strength of the underlined structure.
I expect a pullback to 0.0153 / 0.0156
❤️If you have any questions, please, ask me in the comment section.
Please, support my work with like, thank you!❤️
