IO/USDT — Accumulation or Major Reversal Incoming?🔎 Current Situation
Timeframe: Daily (1D)
Main Trend: Prolonged downtrend since late 2024 (yellow trendline).
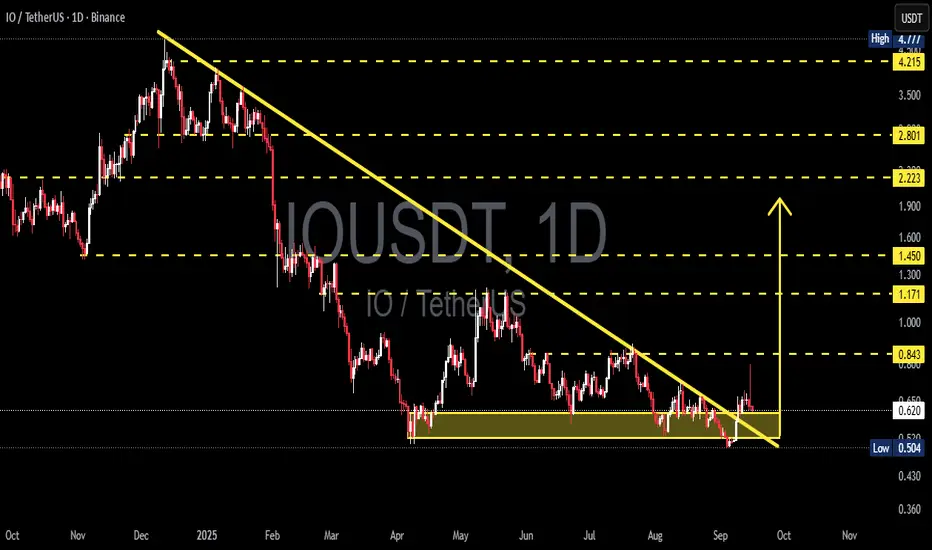
Key Zone: Price is consolidating inside the 0.50 – 0.62 accumulation box, which has acted as strong demand multiple times.
Breakout Attempt: Price briefly broke above the trendline and spiked to 0.84, but quickly rejected → potential bull trap.
---
🧩 Pattern Observations
1. Accumulation Zone (Yellow Box)
Multiple retests confirm this as a critical demand area.
Buyers and sellers are locked in a strong battle here.
2. Descending Triangle / Falling Wedge
Structure resembles a descending triangle (bearish bias if breakdown below 0.50).
Alternatively, it can be read as a falling wedge (bullish if breakout is confirmed).
3. False Breakout (Bull Trap?)
The spike to 0.84 followed by rejection hints at a possible liquidity grab.
Confirmation is needed to validate whether this is a reversal signal or just a trap.
---
🚀 Bullish Scenario
Confirmation Needed:
A daily close above 0.843 with strong volume.
Retest of the downtrend line as new support.
Bullish Targets:
TP1: 1.171
TP2: 1.450
TP3: 2.223
Extended targets: 2.801 – 4.215 if momentum strengthens.
📌 If confirmed, this would signal that 0.50–0.62 was the accumulation bottom before a major reversal.
---
🐻 Bearish Scenario
Confirmation Needed:
A daily close below 0.50 to validate the descending triangle breakdown.
Bearish Targets:
First support: 0.43
Next level: 0.36
📌 Failure to hold the 0.50–0.62 zone could trigger further downside continuation.
---
🎯 Trading Plan
Bullish Traders (Conservative): Wait for a close > 0.843 + retest → enter with staged targets.
Bullish Traders (Aggressive): Start accumulating inside 0.52–0.60 with a tight SL below 0.50.
Bearish Traders: Look for a strong rejection at 0.84 to short → target back to 0.50, or lower if breakdown occurs.
⚖️ Risk Management: This is a decision point. Use strict stop-loss management as this level can either trigger a major reversal or confirm bearish continuation.
---
📌 Notes
Volume is the key factor to separate a valid breakout from a bull trap.
This zone represents a make-or-break point for the medium-term trend.
---
IO/USDT (1D) — Price is consolidating in the 0.50–0.62 accumulation zone, a critical level that could decide the next big move.
Bullish if daily close > 0.843 → targets: 1.171 / 1.450 / 2.223.
Bearish if breakdown < 0.50 → targets: 0.43 / 0.36.
This is a major decision point. Watch for confirmation, beware of bull traps, and always use SL.
---
#IO #IOUSDT #CryptoAnalysis #Altcoin #TechnicalAnalysis #Breakout #SupportResistance #CryptoTrading #BullTrap
Iousdc
IOUSDT — Descending Triangle at Key Demand Zone!✨ Overview
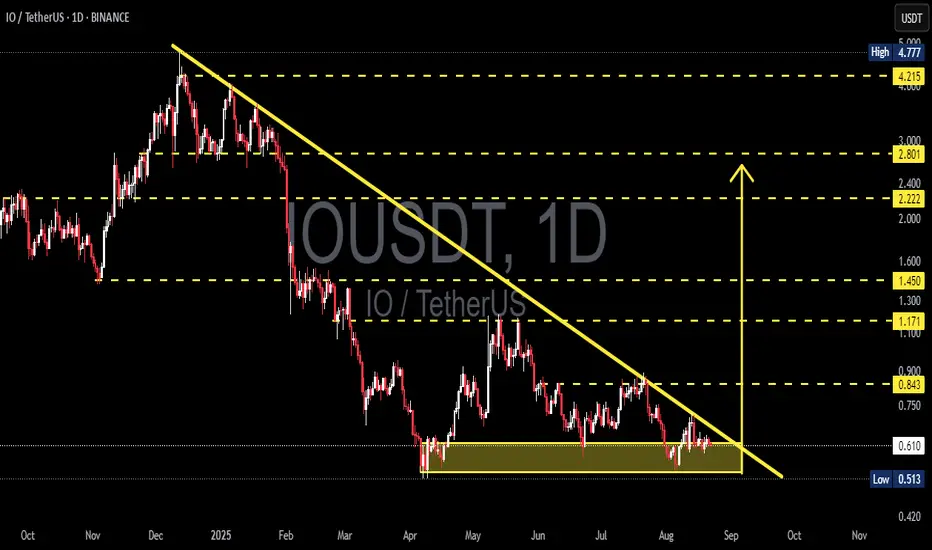
The IOUSDT chart on the daily timeframe is showing a critical consolidation phase after a prolonged downtrend. Price is currently sitting inside the major demand zone 0.53–0.65, forming a descending triangle pattern — a classic setup that often leads to a decisive breakout move.
The falling trendline (yellow) is pressing down a series of lower highs, while the horizontal support around 0.60 remains intact. This reflects a supply vs demand compression: once this battle ends, the market usually delivers a strong directional move.
---
📈 Bullish Scenario (Breakout Potential)
1. Trendline Breakout
A daily close above the descending trendline would be the first signal that sellers are losing control.
Stronger confirmation comes with a successful reclaim of 0.843 (nearest horizontal resistance).
2. Bullish Targets
If a breakout occurs, price could aim for the following resistances step by step:
0.843 → breakout validation.
1.171 → psychological resistance.
1.450 → prior supply zone.
2.222 – 2.801 → expansion zone.
4.215 → major resistance & mid-term target.
3. Why Buyers May Be Confident
The 0.53–0.65 demand zone has held firmly since April 2025.
Bearish momentum is weakening, as sellers have failed to print significantly lower lows.
---
📉 Bearish Scenario (Breakdown Continuation)
1. Support Breakdown
A daily close below 0.513 would confirm a breakdown from the descending triangle.
The projected measured move points towards 0.37–0.40 as the next major target.
2. Retest Setup
After a breakdown, price may retest the 0.53–0.60 zone as new resistance before continuing lower.
Aggressive traders could look for short opportunities here.
3. Bearish Risk Factor
If a false breakdown occurs and price quickly recovers above 0.53–0.60, sellers may get trapped, potentially triggering a short squeeze rally.
---
🔑 Key Technical Takeaways
Descending Triangle → Typically bearish continuation, but an upside breakout can flip it into a strong bullish reversal signal.
Demand Zone 0.53–0.65 → The make-or-break area for buyers to defend.
Downtrend Line → As long as it remains unbroken, mid-term structure still favors sellers.
---
🎯 Conclusion
IOUSDT is now at a make-or-break junction:
Bullish case: breakout above trendline + reclaim of 0.843 could fuel momentum towards 1.171 and even 2.222.
Bearish case: daily close below 0.513 may unlock further downside into the 0.37 area.
Patience is key — waiting for a confirmed breakout or breakdown will provide clarity for the next strong move.
#IOUSDT #IO #CryptoAnalysis #DescendingTriangle #BreakoutSetup #BearishOrBullish #SupportResistance #PriceAction #TrendlineBreakout #CryptoTrading #TechnicalAnalysis
IOUSDT Reversal SignalBINANCE:IOUSDT has broken out of a falling wedge on the 4H chart, signaling a potential trend reversal.
The price is trading above both the 50 EMA and 100 EMA, indicating growing bullish momentum.
A successful retest of the breakout zone could lead to a sharp move toward the $0.85–$1.10 level.
Resistance 1: $0.88
Resistance 2: $1.10
Stop Loss: $0.655

IOUSDT: Inverse Head & Shoulders Breakout – The Reversal is RealBINANCE:IOUSDT has just completed a textbook Inverse Head and Shoulders pattern, one of the most reliable reversal setups in technical analysis. After a prolonged downtrend that left the asset oversold and undervalued, the market has begun to shift. We’ve now seen a clean breakout above the neckline and a healthy retracement back to it. A classic confirmation signal that often precedes strong bullish moves.
This shift is further supported by the emergence of higher highs and higher lows on the smaller timeframes, suggesting that bullish momentum is building. With the downtrend now exhausted, BINANCE:IOUSDT looks poised to begin a new uptrend that could offer solid upside potential for early entrants.
As always, risk management is key. While the pattern setup is strong, it’s crucial to place stop losses just below the right shoulder or neckline to protect against unexpected volatility. The market doesn’t offer guarantees, but this setup offers high-probability conditions worth paying attention to.
BINANCE:IOUSDT Currently trading at $0.98
Buy level : Above $0.95
Stop loss : Below $0.76
Target : $2.65
Max leverage 3x
Always keep stop loss
Follow Our Tradingview Account for More Technical Analysis Updates, | Like, Share and Comment Your thoughts

IOUSDT 1D Analysis IO ~ 1D Analysis
#IO Buy after successfully breaking this resistance line with a short term target of at least 15%+ from here.

IO potential playout !IO / USDT
Last time i shared a bullish idea about IO was around 1.9$-2$ and price pumped over 140% since that time before correction (check previous idea in attachment below)
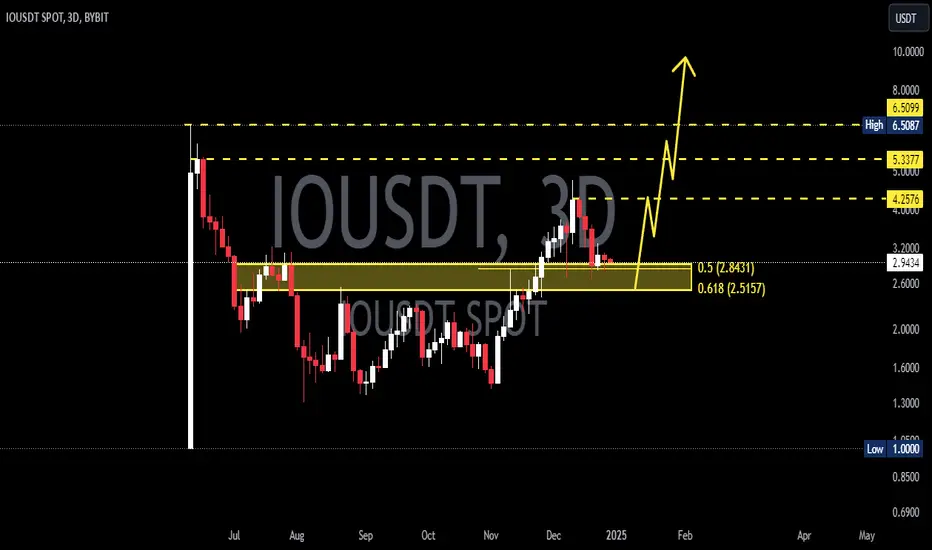
Now IO has a potential to form CUP and Handle pattern which is great bullish pattern if completed
Keep an eye on it

IOUSDT 1WIO Update ~ 1W
#IO So far it still maintains its bullish structure. Price is currently retesting this support block,. Buy in stages with a minimum target of 20%+
IOUSDT - A Prime Opportunity for Long Term Gains.After a significant correction, IOUSDT is making efforts to reclaim its previous major support level. This is often a positive sign, indicating that the market may be stabilizing and setting the stage for a potential upward move.
IOUSDT is part of a significant GPU project, which adds to its appeal and long-term potential.For those looking to invest, this could be an opportunity to buy IOUSDT and hold it for the long term. Given the project’s potential and current market conditions, long-term holding may yield substantial returns
IOUSDT (1D Chart) Technical analysis
IOUSDT (1D Chart) Currently trading at $3.4
Buy level: Above $3.5 (Buy after breakout)
Stop loss: Below $3
TP1: $3.8
TP2: $4.3
TP3: $5.5
TP4: $6.5
Max Leverage 3x
Always keep Stop loss
Follow Our Tradingview Account for More Technical Analysis Updates, | Like, Share and Comment Your thoughts

IO NEW INCREASE VOLUMEDepending on the day trading trend IO shows a new volume increase which could be confirmed in the coming time frames.
IO Showing a positive signal for a low time frame

$IO Trade strategy.What is SEED_ALEXDRAYM_SHORTINTEREST2:IO ?
io.net is a decentralized AI computing & cloud platform. By aggregating GPU supply from underutilized sources, io.net creates a network that allows machine learning (ML) startups to access nearly unlimited computing power at a fraction of the cost of the traditional cloud.
There is not much to say because it was listed at Binance and launched on their launchpad the 11th of June.
This thing is moving like a Swiss clock. Not really affected by CRYPTOCAP:BTC mood.
Buy the bottom of the range, sell at the top.
Put the stop loss $0.1 below the bottom of the raising range. Move along the range and repeat.
Not a financial advice! DYOR
