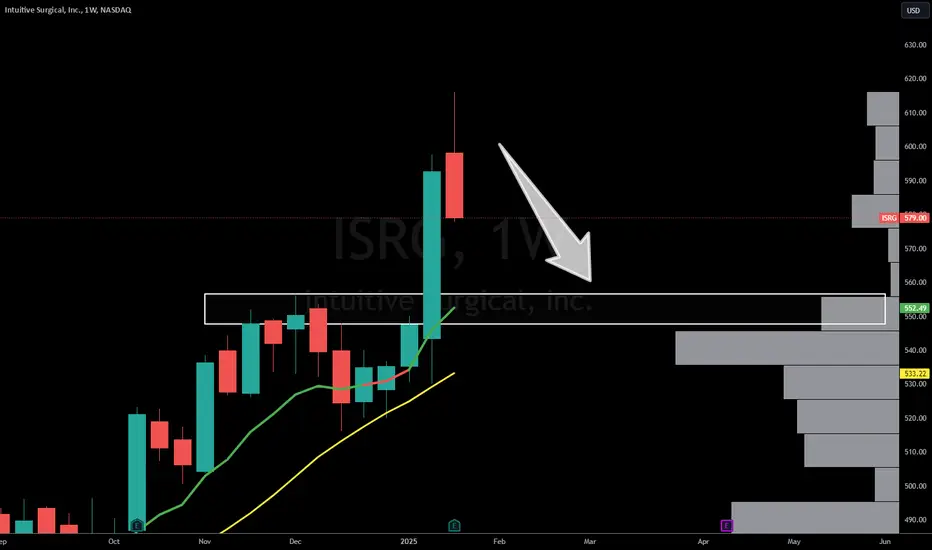
ISRG - Coming down to earth after ATH's!NASDAQ:ISRG
They destroyed earnings, but...
Previous resistance needs to flip! 🥞
Dip Buy Box: $548-$556
Would be a gift based on report 🎁
Not financial advice
Isrglong
ISRG Down 2% in Premarket Trading Despite Beating ExpectationsIntuitive Surgical, Inc. (ISRG) experienced a 2% dip in premarket trading on Friday despite reporting robust fourth-quarter earnings that exceeded analysts’ expectations. The medical device company, known for its revolutionary da Vinci surgical robots, continues to showcase its dominance in the minimally invasive surgery market. Here’s a detailed look at the company’s performance, supported by fundamental and technical insights.
Strong Financial Performance
Intuitive Surgical reported a 25% year-over-year increase in fourth-quarter revenue, reaching $2.41 billion. This figure surpassed the consensus estimate compiled by Visible Alpha, reinforcing the company’s strong growth trajectory. Earnings rose to $686 million, or $1.88 per share, up from $606 million, or $1.69 per share, a year ago. These figures also beat analysts’ expectations, demonstrating the company’s profitability.
Operational Highlights
Procedure Growth: The number of procedures performed using da Vinci surgical devices increased by 18% year-over-year, signaling strong demand for Intuitive Surgical’s minimally invasive technology.
System Installations: The company installed 493 da Vinci systems during the quarter, compared to 415 systems a year earlier. This growth highlights the increasing adoption of its surgical solutions.
Future Outlook
Intuitive Surgical expects da Vinci procedures to grow by 13% to 16% in 2025. However, the company anticipates a 1 to 2 percentage point decline in its adjusted gross profit margin due to potential new tariffs, which could materially impact its financials.
Technical Analysis
Despite the strong earnings report, NASDAQ:ISRG shares fell by 2% in premarket trading. The stock’s overbought condition, indicated by an RSI of 75 as of Thursday’s close, suggests a potential for short-term correction.
- Gap Down Pattern: Historically, gap-down patterns in NASDAQ:ISRG stock have been filled, hinting at a possible rebound in the coming sessions. This historical behavior aligns with the broader market’s tendency to correct temporary gaps.
Key Support and Resistance Levels
- Support: Immediate support lies at the 38.2% Fibonacci retracement level, which could act as a cushion in case of further price correction.
- Resistance: The pivot point is situated above the 1-month high, presenting a significant barrier for upward momentum.
Moving Averages
The stock is trading above its 50-day, 100-day, and 200-day moving averages, underscoring its bullish trend in the medium to long term. This alignment of key moving averages strengthens the case for continued upside potential.
Market Context
- All-Time High: NASDAQ:ISRG shares closed at an all-time high on Thursday, marking a 62% gain over the past year. This performance underscores investor confidence in the company’s long-term prospects.
- Sector Strength: The growing adoption of robotic surgical systems positions Intuitive Surgical as a leader in the medical device industry, benefiting from the broader trend toward minimally invasive procedures.
Conclusion
Intuitive Surgical’s robust financial results and operational milestones underscore its leadership in the surgical robotics market. While the current dip in premarket trading reflects short-term market dynamics, the stock’s strong technical indicators and historical performance suggest a potential rebound.
Investors should monitor key support and resistance levels, along with updates on tariff developments, to assess the stock’s trajectory. With a bullish continuation pattern likely in play, NASDAQ:ISRG remains a compelling option for long-term growth-oriented investors.

Intuitive Surgical is Set to Release its Quarterly 2024 ResultsIntuitive Surgical is set to release its Quarterly 2024 results, highlighting its significant impact on the healthcare industry. The company's innovative robotic systems have transformed surgery, leading to a remarkable 22,000% increase in stock price over its lifetime.
Now an industry giant with a market capitalization of $161 billion, questions about Intuitive Surgical's long-term growth and stock investment potential abound.
Intuitive Surgical, founded in the mid-1990s, provides robotic systems that enhance minimally invasive surgeries, helping surgeons reduce errors, improve mobility, and achieve better patient outcomes with smaller incisions. Over 60,000 surgeons have trained on its da Vinci system, and as of Q2 2024, the company has over 9,800 installed systems, with a 14% year-over-year growth in installations.
Investors value two main aspects of Intuitive Surgical's business: the reliance on system maintenance, which has increased recurring revenue from 71% in 2016 to 83% last year, making cash flow more predictable, and substantial growth potential outside the U.S., with only 3,818 of an estimated 165,000 global hospital sites currently using their systems.
However, the stock's substantial rise poses concerns about whether this growth is already accounted for in its valuation. Over the past decade, Intuitive Surgical shares ( NASDAQ:ISRG ) have appreciated nearly 800%, resulting in heightened market expectations that may lead to a difficult reset if future results fall short.
Analysts anticipate average earnings growth of 17% annually over the next three to five years, which may not be sufficient to justify the stock’s forward price-to-earnings (P/E) ratio of 69. With a PEG ratio nearly at 4, this suggests that the stock is overvalued relative to its expected growth.
Despite its recent upward trend since November 2023, indicated by a balanced Relative Strength Index (RSI) of 53, the stock is presently deemed too expensive for investors seeking strong returns. Therefore, while Intuitive Surgical ( NASDAQ:ISRG ) shows promising long-term growth potential, it may be wise to consider it as a target for investment when shares drop below current levels.

ISRG - Cup & Handle to Long ?ISRG to Long ? Cup & Handle pattern + Above the average line 150 + Retest to support/Breakout line + RSI indicator around the middle.
Only an idea and not a recommendation for trading!

ISRG - Intuitive Surgical Inc - Buy ZoneAccording to the market behaviour, ISRG has been rising sharply on the one hour, five hours, daily, and weekly charts. Technical analysis indicates that the next target will $327, and if it crosses that level and closes above successfully, the next target for the market will be $340 & 354.
Italian Translation:
Secondo il comportamento del mercato, l'ISRG è in forte aumento sui grafici di un'ora, cinque ore, giornalieri e settimanali. L'analisi tecnica indica che il prossimo obiettivo sarà 327 dollari e, se supera quel livello e chiude con successo al di sopra, il prossimo obiettivo per il mercato sarà 340 e 354 dollari.
German Translation:
Dem Marktverhalten zufolge ist ISRG auf den Ein-Stunden-, Fünf-Stunden-, Tages- und Wochen-Charts stark gestiegen. Die technische Analyse zeigt, dass das nächste Ziel bei 327 US-Dollar liegt. Wenn es dieses Niveau überschreitet und erfolgreich darüber schließt, wird das nächste Ziel für den Markt bei 340 und 354 US-Dollar liegen.

ISRG - Dominant Up TrendISRG has returned its price back to the dominant trend line that can be drawn
This line in the past has been seen as a strong bull pivot point
With consistent bull rejections
Good buy along trend line on this daily timeframe

ISRG consolidation then new highs or retest support?Just did a basic fib retracement on ISRG using that last low. Looks like the 50 fib line presents a consistent area of traffic and previous support. It tested the 236 fib area weeks ago and after managing to break through and hold, the stock made new highs. After failing to retest those highs at the end of the week, it settled back at the recent levels just shy of 950. That area has also been a short-term area of support. But does it hold these levels and bounce to retest ATH or is the retracement in effect heading back down closer to the 236 fib line?
Have to see what comes with ISRG earnings during this next round. That 71.22% surprise last quarter didn't hurt but can it maintain the same pace now that things are beginning to normalize to some extent?

ISRG possible reaction to 0.618 Fib channel BUT SHORT TERM! Chart is clear. We can possibly have reaction now. for short term. Long term we have other more supports to brake which strongest is T2
