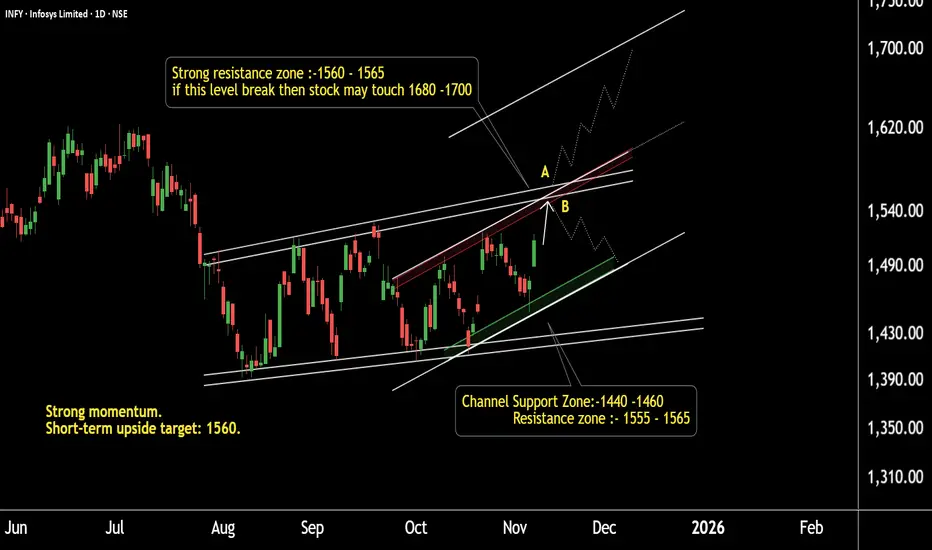
INFY Battle Zone: Levels That Decide the TrendThis is the daily timeframe chart of INFY.
The stock has a strong support zone near 1410 and 1440.
It is facing major resistance within the short-term and mid-term channel around 1555–1565.
Currently, INFY is trading near 1520, and the ongoing move may extend toward 1560.
If the stock fails to break this resistance, a short-term decline may occur.
However, if the resistance is decisively broken, INFY has the potential to rally toward 1680–1700 based on the channel trend.
Thank You !!
Itsectorbuying
INFY Turning Bullish: IT Giant Ready for the Next Leg UpINFOSYS — 1 Hour Timeframe Analysis
INFY is showing strong momentum after respecting its support zone around 1400–1420. The stock has rebounded well and is now approaching its resistance zone near 1580–1590.
The Supertrend indicator is displaying a positive bias, while the MACD has confirmed a bullish crossover in the positive zone, further validating the ongoing strength in momentum.
Any buy-on-dip opportunity near the Supertrend support around 1450–1460 could offer another round of bullish momentum. The stock is currently maintaining a Higher Low – Higher High (HL–HH) structure, indicating a healthy uptrend continuation.
If the support zone holds firmly, we may witness higher prices in INFY in the coming sessions.
Thank You !!

Opportunity Knocks! Fresh buying interest visible in CAMS.This is the daily timeframe chart of CAMS.
The stock is currently trading within a well-defined parallel channel, with a strong support zone near ₹3600–₹3700.
If this level holds, we may witness higher prices in CAMS.
Thank you !!

Infosys-Strong Buy-Swing/Short term
Buy
Target:1644
SL: 1518
1. Inside Candle breakout in Day TF & Week TF
2. 50% Fibonacci crossed in last downtrend.
3. Good Momentum candles in last few days.
4. Price reached last 3 months high.
5. EMAs crossover & Rejections.
6. Good Volume breakout.
7. IT Sector in good uptrend

Cup & Handle Pattern IT SectorDaily Gap in the chart
Breakout Retest done
Accenture Result over Worst is over in this quater
For 12Months is Good Level for investment through ITBEES or Tata digital Mutual fund

#INFY... looking for 23.05.23#INFY... ✅▶️
take target upto 1350
Intraday as well as swing trade
All levels given in charts ...
IF good potential seen then we work in options also
if activate then possible a huge movement Keep eye on this ...
We take trade only when it activates...
Possible to give good target
TRADING FACTS
