GOLD Risky Long! Buy!
Hello,Traders!
GOLD is trading in an uptrend
So despite a local correction
We are bullish biased and
As we are already seeing
A bullish rebound from the
Local horizontal support
Of 3360$ a further
Bullish move up is
To be expected
Buy!
Comment and subscribe to help us grow!
Check out other forecasts below too!
Disclosure: I am part of Trade Nation's Influencer program and receive a monthly fee for using their TradingView charts in my analysis.
J-XAU

Falling towards pullback support?The Gold (XAU/USD) is falling towards the pivot and could bounce to he 1st resistance which has been identified as a pullback resistance.
Pivot: 3,361.29
1st Support: 3,310.00
1st Resistance: 3,490.34
Risk Warning:
Trading Forex and CFDs carries a high level of risk to your capital and you should only trade with money you can afford to lose. Trading Forex and CFDs may not be suitable for all investors, so please ensure that you fully understand the risks involved and seek independent advice if necessary.
Disclaimer:
The above opinions given constitute general market commentary, and do not constitute the opinion or advice of IC Markets or any form of personal or investment advice.
Any opinions, news, research, analyses, prices, other information, or links to third-party sites contained on this website are provided on an "as-is" basis, are intended only to be informative, is not an advice nor a recommendation, nor research, or a record of our trading prices, or an offer of, or solicitation for a transaction in any financial instrument and thus should not be treated as such. The information provided does not involve any specific investment objectives, financial situation and needs of any specific person who may receive it. Please be aware, that past performance is not a reliable indicator of future performance and/or results. Past Performance or Forward-looking scenarios based upon the reasonable beliefs of the third-party provider are not a guarantee of future performance. Actual results may differ materially from those anticipated in forward-looking or past performance statements. IC Markets makes no representation or warranty and assumes no liability as to the accuracy or completeness of the information provided, nor any loss arising from any investment based on a recommendation, forecast or any information supplied by any third-party.

Gold: The Start Of The C Wave (Extreme Danger!)After the FED announces their business Gold (XAUUSD) is likely to crash-down and hard.
I will support my statement with data coming from this chart.
The crash doesn't necessarily need to happen instantly. My idea is that we are witnessing a classic ABC correction in Elliott Wave Theory terminology. Let's dive in.
» Trading volume peaked in early April and has been dropping considerably.
» The ATH session ended as a very strong bearish (reversal) signal.
» There is a strong bearish divergence with the RSI. The RSI peaked February 2025 while Gold (XAU) peaked recently. Here is the chart:
Currently, Gold is showing a bounce until the resumption of the corrective bearish move.
Gold is set to move lower based on my interpretation of this chart. Approach with caution, or, go SHORT. You can't go wrong by shorting the top/resistance. Sell at resistance, buy at support.
Namaste.

BITCOIN/GOLD BITCOIN/GOLD 🌊
Physical gold vs. Digital gold
2010: 1 BTC 0.0001 GOLD
2025: 1 BTC 27.9 GOLD

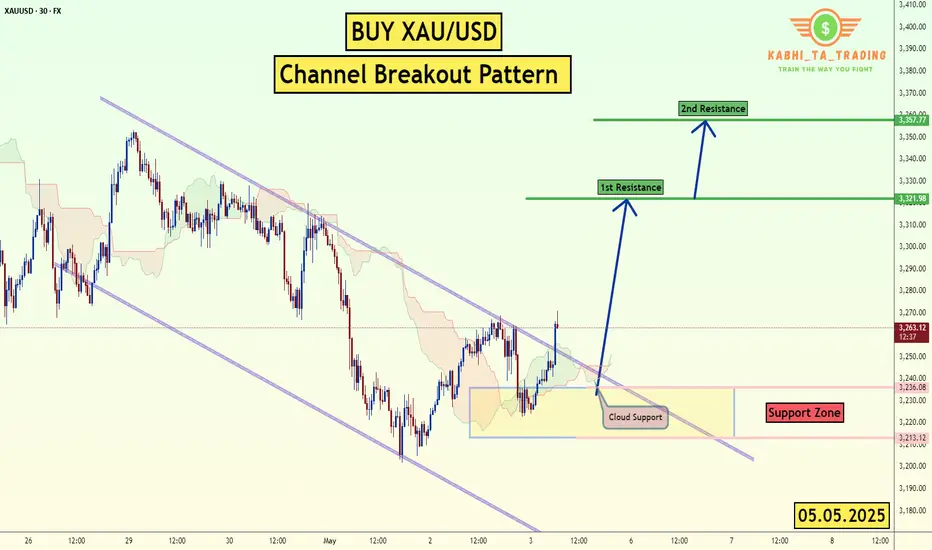
XAU/USD - Channel Breakout (05.05.2025)The XAU/USD pair on the M30 timeframe presents a Potential Buying Opportunity due to a recent Formation of a Channel Breakout Pattern. This suggests a shift in momentum towards the upside and a higher likelihood of further advances in the coming hours.
Possible Long Trade:
Entry: Consider Entering A Long Position around Trendline Of The Pattern.
Target Levels:
1st Resistance – 3321
2nd Resistance – 3357
🎁 Please hit the like button and
🎁 Leave a comment to support for My Post !
Your likes and comments are incredibly motivating and will encourage me to share more analysis with you.
Best Regards, KABHI_TA_TRADING
Thank you.
XAUUSD - Gold Trend Before FOMC!Gold is trading above its EMA200 and EMA50 on the 4-hour timeframe and is trading on its uptrend line. A continued upward move in gold will put it in the supply zone, where it is possible to look for short positions. A downward correction in gold will also open up long positions.
Gold traders endured another turbulent week, marked by the second consecutive decline in prices—once again underscoring the market’s acute sensitivity to economic news and developments.
Adrian Day, CEO of Adrian Day Asset Management, offered a cautiously humorous take on the situation by likening it to the Peggy Lee song that asks, “Is that all there is?” He pointed out that gold has pulled back by over 7% from its recent high in less than two weeks.Although this correction is notable, it hasn’t been deep enough to flush out all short-term traders or weak-handed investors from the market.
Day added that rising fears of a U.S. recession—which typically exert early downward pressure on gold—alongside the possibility of easing U.S.-China trade tensions, may limit investment demand for gold in the short term. Concluding his comments, he maintained a cautious stance, saying that further downside remains likely and that his outlook for the coming week is bearish.
Meanwhile, U.S. President Donald Trump, in a new interview with NBC, addressed several key economic and political issues. He stated that if necessary, the deadline for selling TikTok would be extended, and some tariffs on Chinese goods might become permanent. Nevertheless, he indicated that he is also considering reducing certain tariffs in the future.
Trump emphasized that small businesses do not require additional assistance and that the Federal Reserve should cut interest rates. He confirmed that Jerome Powell will remain Fed Chair through the end of his term in 2026. He also mentioned potential successors for his own position, naming Vance and Rubio as possibilities.
After a week dominated by employment data, the upcoming week will be entirely focused on monetary policy. The centerpiece will be the May FOMC meeting, the Fed’s rate decision, and Jerome Powell’s press conference on Wednesday. While markets broadly expect the Fed to hold rates steady, Powell’s official remarks and answers to press questions—especially following his sharp tone earlier in April—will be under close scrutiny.
It is widely expected that the Federal Reserve will leave its key interest rate unchanged on Wednesday, as policymakers assess how President Trump’s tariffs gradually impact various sectors of the economy. Markets are currently pricing in a potential rate cut starting in July. The Fed’s dual mandate is to maintain low inflation and high employment, and it may face a dilemma if tariffs negatively affect both indicators, as many economists now warn.
Immediately following the Fed meeting, senior policymakers including Barr, Kugler, Waller, and Cook will travel to Iceland to attend the Reykjavik Economic Conference. On Friday, they will participate in panels discussing artificial intelligence, labor market trends, and monetary research—topics that could offer insights into the Fed’s long-term policy direction.
Simultaneously, traders are also awaiting two key reports: the ISM Services Index for May, due today, and weekly jobless claims figures set for release on Thursday. Together, these reports will help complete the picture of the U.S. economy as critical monetary policy decisions approach.

Gold Chart And Factor Of 3Price changes with a factor of 3 and its reaction to support and resistance levels.
3% , 6% , 9% , 12% , 15% , 18% ...

Bullish continuation?The Gold (XAU/USD) is falling towards the pivot which lines up with the 61.8% Fibonacci support and could bounce to the 1st resistance which acts as a pullback resistance.
Pivot: 3,148.98
1st Support: 3,051.82
1st Resistance: 3,430.57
Risk Warning:
Trading Forex and CFDs carries a high level of risk to your capital and you should only trade with money you can afford to lose. Trading Forex and CFDs may not be suitable for all investors, so please ensure that you fully understand the risks involved and seek independent advice if necessary.
Disclaimer:
The above opinions given constitute general market commentary, and do not constitute the opinion or advice of IC Markets or any form of personal or investment advice.
Any opinions, news, research, analyses, prices, other information, or links to third-party sites contained on this website are provided on an "as-is" basis, are intended only to be informative, is not an advice nor a recommendation, nor research, or a record of our trading prices, or an offer of, or solicitation for a transaction in any financial instrument and thus should not be treated as such. The information provided does not involve any specific investment objectives, financial situation and needs of any specific person who may receive it. Please be aware, that past performance is not a reliable indicator of future performance and/or results. Past Performance or Forward-looking scenarios based upon the reasonable beliefs of the third-party provider are not a guarantee of future performance. Actual results may differ materially from those anticipated in forward-looking or past performance statements. IC Markets makes no representation or warranty and assumes no liability as to the accuracy or completeness of the information provided, nor any loss arising from any investment based on a recommendation, forecast or any information supplied by any third-party.

GOLD WILL GO DOWN|SHORT|
✅GOLD is going down now
After a breakout a retest
A and a pullback from the
Key horizontal level
Of 3280$ so we are bearish
Biased and we will be expecting
A further bearish move down
SHORT🔥
✅Like and subscribe to never miss a new idea!✅
Disclosure: I am part of Trade Nation's Influencer program and receive a monthly fee for using their TradingView charts in my analysis.

XAU/USD (Gold) H1 Breakout (29.04.2025)The XAU/USD Pair on the H1 timeframe presents a Potential Selling Opportunity due to a recent Formation of a Breakout Pattern. This suggests a shift in momentum towards the downside in the coming hours.
Possible Short Trade:
Entry: Consider Entering A Short Position around Trendline Of The Pattern.
Target Levels:
1st Support – 3158
2nd Support – 3025
🎁 Please hit the like button and
🎁 Leave a comment to support for My Post !
Your likes and comments are incredibly motivating and will encourage me to share more analysis with you.
Best Regards, KABHI_TA_TRADING
Thank you.

Heading into pullback resistance?XAU/USD is rising towards the resistance level which is a pullback resistance that lines up with the 23.6% and the 50% Fibonacci retracement and could reverse from this level to our take profit.
Entry: 3,275.29
Why we like it:
There is a pullback resistance level that line sup with the 23.6% and the 50% Fibonacci retracement.
Stop loss: 3,350.60
Why we like it:
There is a pullback resistance level that lines up with the 50% Fibonacci retracement.
Take profit: 3,168.44
Why we like it:
There is a pullback support level that aligns with the 61.8% Fibonacci retracement.
Enjoying your TradingView experience? Review us!
Please be advised that the information presented on TradingView is provided to Vantage (‘Vantage Global Limited’, ‘we’) by a third-party provider (‘Everest Fortune Group’). Please be reminded that you are solely responsible for the trading decisions on your account. There is a very high degree of risk involved in trading. Any information and/or content is intended entirely for research, educational and informational purposes only and does not constitute investment or consultation advice or investment strategy. The information is not tailored to the investment needs of any specific person and therefore does not involve a consideration of any of the investment objectives, financial situation or needs of any viewer that may receive it. Kindly also note that past performance is not a reliable indicator of future results. Actual results may differ materially from those anticipated in forward-looking or past performance statements. We assume no liability as to the accuracy or completeness of any of the information and/or content provided herein and the Company cannot be held responsible for any omission, mistake nor for any loss or damage including without limitation to any loss of profit which may arise from reliance on any information supplied by Everest Fortune Group.

Gold Analysis UpdateI believe this analysis is only getting started, so let's see what happens in the coming 24 hours or so as there is NFP tomorrow (from the time of this video).
Have a great rest of your day guys

Gold: Breakdown in Motion (15m Chart)Just price, structure, and volume — tracked in real time.
🧠 Chart Breakdown:
✅ Momentum Long — Price broke out from a base with clean volume. MA structure aligned, and bulls had control early.
⛔ Top Reversal — Price peaked and printed a clean rejection. Volume faded. Sellers rotated in.
⛔ Lower High Rejection — Attempt to reclaim highs failed fast. Fib and MA structure stacked against continuation.
⚠️ Temporary Recovery Attempt — Brief bounce off support, but no structure regained. No follow-through = no entry.
🚨 Breakdown Confirmed — Price lost all support levels with conviction. Volume backed the flush. Breakdown held and extended.
👀 Current Pressure Point — Price still pressing lows. Watching to see if momentum continues or if we get exhaustion behavior.
Always happy to be helpful.

GOLD Bearish Breakout! Sell!
Hello,Traders!
GOLD formed a bearish
Triangle pattern and then
Made a bearish breakout
Hinting at a coming bearish
Correction that was long
Overdue so we are bearish
Biased and we will be expecting
A local bearish move down
After a potential pullback
Sell!
Comment and subscribe to help us grow!
Check out other forecasts below too!
Disclosure: I am part of Trade Nation's Influencer program and receive a monthly fee for using their TradingView charts in my analysis.

XAU/USD - Bearish Flag Pattern (25.04.2025)The XAU/USD Pair on the M30 timeframe presents a Potential Selling Opportunity due to a recent Formation of a Bearish Flag Pattern. This suggests a shift in momentum towards the downside in the coming hours.
Possible Short Trade:
Entry: Consider Entering A Short Position around Trendline Of The Pattern.
Target Levels:
1st Support – 3232
2nd Support – 3188
🎁 Please hit the like button and
🎁 Leave a comment to support for My Post !
Your likes and comments are incredibly motivating and will encourage me to share more analysis with you.
Best Regards, KABHI_TA_TRADING
Thank you.

GOLD RISKY LONG|
✅GOLD will soon retest a key support level of 3260$
So I think that the pair will make a rebound
And go up to retest the supply level above at 3323$
LONG🚀
✅Like and subscribe to never miss a new idea!✅
Disclosure: I am part of Trade Nation's Influencer program and receive a monthly fee for using their TradingView charts in my analysis.

Gold at $3,260: Buy the Fourth Dip?Gold prices have stabilized today after experiencing an earlier decline that represents the fourth dip down to the $3260 level over the past few sessions. The repeated defense of this support level could indicate strong buyer interest at these prices.
Recent reports suggest an easing of trade tensions which might be weakening demand for gold. But have tensions really eased to any great extent? Commerce Sectary Howard Lutnick announced yesterday the U.S. is close to 1 trade agreement with 1 mystery trade partner (rumored to be India? But why not brag about that if true) isn't the kind of progress that consoles me.
But is it time to buy?
The consistent support at $3,260 coupled with a potential move above $3,375 could provide the technical confirmation needed for renewed confidence in this kind of trade.

Gold Possible SellsOANDA:XAUUSD My sentiments on gold for today.
1. Last buyer haven, prior to recent one
This is the last place prior to the level gold is sitting on top currently (4.(black)) where buyers would have been really and truly comfortable buying which means we know there could likely be stop losses even below here.
2. Bearish momentum/bearish channel
At this time gold has been bearish for about 7 days and if its one thing you know I believe in is momentum, adhere to whatever the momentum is doing - in this case its selling (bearish) so it is likely IMO to continue to do so - this is further supporting by the elements of my analysis.
3. Buyers stoplosses
The area highlighted in red shows suggested buyers stop losses below the currently obvious buyer havem (4. black) which means this is likely where the market will try to attack to capture that trapped liquidity. Something to think about, if gold had the liquidity to buy, it would. Let this guide you in terms of what you allow yourself to see next.
4. Current Obvious buyer haven
Pay attention to the level I've drawn to show where buyers would be heavily induced to buy at this time, this looks like a gold mine for buys (pun intended lol). Something you'd learn in this space, if it feels to good to be true, it probably is.
5. Possible move
This is what I think is likely to occur, gold will crash below the current obvious buyer haven taking out all previous buyer stops, capturing all that liquidity along the way even attacking the last buyer haven. Then and only then can gold resume it's bullish activities because now it would have enough liquidity to do what it wants.
What are your thoughts?

EURAUD H2 compression BUY/HOLD +150/300 pips🏆 EURAUD Market Update
📊 Technical Outlook
🔸Short-term: BEARS 7650/7700
🔸Mid-term: BULLS 8050/8150
🔸Status: compression wedge
🔸getting ready for a PUMP
🔸noteworthy compression in April
🔸Price Target Bears: 7650/7700
🔸Price Target BULLS: 8050/8150
📊 Forex & Gold Market Highlights – April 30, 2025
💶 EUR/USD Nears 1.1400
- Trading around 1.1390 amid softer U.S. economic data
- Investors await German economic indicators and U.S. PCE report
- April shows a 5.1% gain, the largest monthly increase since November 2022
💷 GBP/USD Hovers Near 1.3400
- Sterling trades at approximately 1.3379 after testing YTD highs
- U.S. JOLTS and Consumer Confidence data missed forecasts, fueling Fed rate cut speculation
🥇 Gold Retreats Below $3,310
- Spot gold at $3,302.58 per ounce, down 0.4%
- Decline follows easing trade tensions and a stronger U.S. dollar
- Investors focus on upcoming U.S. PCE data and non-farm payrolls report
📌 Market Outlook:
- EUR/USD: Potential to test 1.15 if German data supports euro strength
- GBP/USD: Eyes on U.S. economic data for direction; support around 1.3300
- Gold: Volatility expected; watch for U.S. economic indicators influencing Fed policy expectations

Gold - Warning #1 IssuedGold goes up forever right?
Not necessarily...
Our Team at Bullfinder-official has identified potential risk in OANDA:XAUUSD , issuing Warning #1.
Gold has been moving aggressively to the upside for some time now, hitting +116% since November of 2022.
Gold currently sits at $3,313 - And although this may not be the exact top of this run, we would like to note that current regions may warrant greater caution, and present greater levels of risk.
We're inspired to bring you the latest developments across worldwide markets, helping you look in the right place, at the right time.
Thank you for reading! Stay tuned for further updates, and we look forward to being of service along your trading & investing journey...
Disclaimer: Please note all information contained within this post and all other Bullfinder-official Tradingview content is strictly for informational purposes only and is not intended to be investment advice. Please DYOR & Consult your licensed financial advisors before acting on any information contained within this post, or any other Bullfinder-official TV content.

GOLD Free Signal! Sell!
Hello,Traders!
GOLD went up from the
Support just as I predicted
But is now retesting a local
Horizontal resistance structure
So we can go short with the
Take Profit of 3320$ and
The Stop Loss of 3374$
Using small lot size is
Highly recommended
As it is a risky setup
Sell!
Comment and subscribe to help us grow!
Check out other forecasts below too!
Disclosure: I am part of Trade Nation's Influencer program and receive a monthly fee for using their TradingView charts in my analysis.

XAUUSD - Gold trend reversed?!Gold is trading below the EMA200 and EMA50 on the hourly timeframe and is in the specified pattern. The continuation of gold's movement depends on the breakdown of one of the two established trend lines, and after a valid breakdown, we expect to reach the established targets.
In recent weeks, gold prices have experienced significant volatility. This precious metal, long regarded as a safe-haven asset during periods of economic uncertainty, faced a decline in Monday’s trading session. The primary reason behind this drop was signs of easing trade tensions between the United States and China, leading to decreased demand for safe assets. This decline occurred while investors awaited clarity regarding ongoing trade negotiations between the two countries.
Last week, media reports indicated that China exempted some American imports from 125% tariffs, signaling a reduction in bilateral tensions. In response, Donald Trump stated that trade talks were underway; however, this claim was rejected by China. Additionally, the U.S. Treasury Secretary announced that he was unaware of any active negotiations, further fueling market doubts.
According to a recent Federal Reserve survey, participants cited the outflow of foreign capital from U.S. assets and a decline in the dollar’s value as potential new economic shocks. Some respondents believed that increased tariffs might only cause limited market disruptions. The survey indicated that despite market turmoil in April, prices remained elevated relative to fundamental indicators.
Meanwhile, investors were closely awaiting key U.S. economic data set to be released over the coming week. While the previous week was relatively quiet in terms of economic indicators, market focus has shifted toward a series of critical U.S. employment reports. These include the Job Openings and Labor Turnover Survey (JOLTS) on Tuesday, the ADP private-sector employment report on Wednesday, and weekly jobless claims on Thursday—all paving the way for the most crucial event of the week: the April Non-Farm Payrolls (NFP) report, to be released Friday morning.
Beyond these reports, several major events are scheduled in the economic calendar: Canada’s federal election on Monday, the U.S. Consumer Confidence Index on Tuesday, preliminary first-quarter GDP data, pending home sales figures, and the Bank of Japan’s monetary policy decision on Wednesday, followed by the U.S. ISM Manufacturing PMI on Thursday—all of which could impact market sentiment.
On another front, the China Gold Association reported that gold consumption fell by 5.96% in the first quarter of 2025, reaching 290,492 tons. Although gold jewelry demand declined by 26.85%, investment-related gold demand surged by 29.81%, reflecting investors’ pursuit of safe assets amid economic and geopolitical uncertainty.
Domestic gold production in China increased by 1.49%, and assets held in gold ETFs rose sharply by 327.73%, indicating heightened financial caution among Chinese consumers in 2025.
A recent report from Goldman Sachs suggests that the downward trend of the U.S. dollar is far from over and that the currency remains significantly overvalued. Jan Hatzius, the bank’s chief economist, stated that despite the dollar’s recent 5% drop, it still stands roughly two standard deviations above its long-term real average since 1973. Historically, such levels have marked the beginning of multi-year correction cycles for the dollar.
Similar patterns occurred during the mid-1980s and early 2000s when the U.S. dollar experienced declines of around 25% to 30% following such valuations. Based on this, Goldman Sachs expects a similar scenario to unfold in the coming years.
One of the key structural factors fueling this anticipated correction is the portfolio composition of global investors. Specifically, non-U.S. investors hold about $22 trillion worth of assets in the United States, roughly one-third of their total portfolios.Half of these investments are unhedged against currency risk, which could lead to sharp fluctuations in the currency markets if investor sentiment shifts.
Goldman Sachs analysts believe that even a modest reallocation of global capital away from U.S. assets could significantly lower the dollar’s value. Therefore, they view the dollar’s gradual yet sustained decline not as a temporary fluctuation, but as a long-term structural trend.

GOLD WILL GO FURTHER UP|LONG|
✅GOLD fell again to retest the support
But it is a strong key level
So as we are seeing a bullish
Rebound already I think that there is a high chance
That we will see a bullish rebound and a move up
LONG🚀
✅Like and subscribe to never miss a new idea!✅
Disclosure: I am part of Trade Nation's Influencer program and receive a monthly fee for using their TradingView charts in my analysis.
