XAU 1M Gold price formation history and future expectationsGold , or as denote the main trading pair XAUUSD , has been gaining a lot of attention around itself in recent years.
As soon as major analysts or hedge fund top-managers begin to say that the next crisis is near, investors immediately start buying gold as a defensive asset, and its price, accordingly, goes up.
Let's walk a little through the history of the Gold price.
We finished drawing the graph, to what exists on tradingview.com, based on the data that is freely available.
1) In 1933, to overcome the crisis after the "Great Depression", US President Roosevelt issued a decree on the confiscation of gold from the population. The price for an ounce of gold is set at $20.66.
2) In 1971, a real rise in the value of gold begins. After decoupling the US dollar rate from the "gold standard", which regulated the cost of 1 troy ounce of gold at $35 for a long period from 1934 to August 1971.
3) 1973 - "The First Oil Crisis" and the rise in the value of gold from $35 to $180 - as the main anti-crisis instrument, a means of hedging investment risks.
4) 1979-1980 Islamic Revolution in Iran (Second Energy Crisis). The cost of gold, as the main protective asset, in a short period of time grows more than 8 times and sets a maximum at around $850
5) During 1998-2000, the world swept through: the "Asian economic crisis", defaults in a number of countries, and the cherry on the cake - the "Dotcom Bubble". During this period, the price of gold was twice aggressively bought out by investors, from the level of $250. It was a clear signal - there will be no lower, next, only growth!
6) And so it happened, from 2001 to 2011 there was an increase in the value of gold from $250 to $1921 . Even the mortgage crisis of 2008 could not break the growth trend, but only acted as a trigger for a 30% price correction.
Looking at the XAUUSD chart now, one can assume that large investors were actively buying gold in the $1050-1350 range during 2013-2019.
It is hard to believe that investors who have been gaining long positions for 6 years will be satisfied with such a small period of growth in 2019-2020.
For ourselves, we establish a Gold purchase zone in the range of $1527-1600 per troy ounce, from where we expect the growth trend to continue to the $3180-3350 region
What are your views on the future price of gold? Share them in the comments!
J-XAU

What Next For Gold?So I went back to the weekly after yesterday's success and ath (all time high) and had to re-draw my channel to get a little insight to where she's headed. To be honest, i see a move to 3300 happening (not a prediction). So I have this little vibe. watch the video to see my entry..

Why make it too complicated?!!Find the trend, follow the trend and stay on the trend. If can't find the trend then wait, trading is a marathon and not sprint.

I Came Back As A Gold TraderThis is a short detailed video about my journey and transition from PEPPERSTONE:NAS100 to NASDAQ:XAU . For Gold, I see a very big push for a new all time high at 3189-3200. All this is possible if the previous high gets a solid break since there's been a major resistance in the area. I'm currently in the trade and added another just incase. Let's see how this plays out..

Trader's Alert: Gold Potential Top, Signal (Bullish Bitcoin)Gold today is making a strong move after hitting a new All-Time High. The current session is red and has the highest volume since November 2024. This is an early signal that can be interpreted as the top being printed. Very early.
Gold peaking can have a strong significance for us Cryptocurrency traders. Gold has been in a strong uptrend since December 2024. Bitcoin peaked and went sideways with bearish tendencies in December 2024. They have been moving in contrary direction. This can mean that a Gold top would produce a Bitcoin bottom.
The Gold peak can mean a change in market dynamics, all markets. Bullish goes bearish and bearish goes bullish.
Gold is still bullish on the weekly timeframe but with a parabolic rise. A parabolic rise tends to end with a sudden crash. A true parabola.
This is a friendly alert to all Gold traders.
XAUUSD is likely to go down.
Confirmation is needed.
Thank you for reading.
Namaste.

XAU going to drop market structure shift and choch happened and market take the idm and now making liquidity for the target partily book profit extram poi is 2850

GOLD, preppin tarmac for the next FLIGHT season from here 2980GOLD has been breaking expectations the last few weeks with constant ATH breaks and parabolic surges since last year -- overtaking most risk-on assets in the field and for good reason. I can't say enough fundamental reasons because they are too far many -- which all favors GOLD's ultra ascend.
After tapping its ATH peak at 3167, gold finally retreated for a healthy trim down following the markets RED pressure. It tapped 61.8 fib levels to touch 2979 zone -- an almost a 2000 pip drop.
This area is where most buyers converge. And based on our latest metrics from the diagram -- we are now starting a new transitional phase, and prep work for the next BIG SHIFT. It is currently commencing as we speak.
This transition shifts only comes once every 6 months -- so this occasion is very rare specially to those who seek to get the best seasonal price (post correction).
*Disclaimer, we may see some bargain overextension moves from here -- but those are good opportunities to stack up if it gives more discount ranges.
Ideal seed at the current range. A retap of the ATH peak -- and go beyond further is expected from the higher basing zone.
Last chance to grab this rare discount season.
Spotted at 2980.
Interim at 3167 (current) ATH
Mid 3300
Long term 4000.
TAYOR. Trade safely.

Could the Gold rebound from here?The price has reacted off the pivot and could potentially rise to the 1st resistance.
Pivot: 2,955.87
1st Support: 2,925.35
1st Resistance: 3,054.56
Risk Warning:
Trading Forex and CFDs carries a high level of risk to your capital and you should only trade with money you can afford to lose. Trading Forex and CFDs may not be suitable for all investors, so please ensure that you fully understand the risks involved and seek independent advice if necessary.
Disclaimer:
The above opinions given constitute general market commentary, and do not constitute the opinion or advice of IC Markets or any form of personal or investment advice.
Any opinions, news, research, analyses, prices, other information, or links to third-party sites contained on this website are provided on an "as-is" basis, are intended only to be informative, is not an advice nor a recommendation, nor research, or a record of our trading prices, or an offer of, or solicitation for a transaction in any financial instrument and thus should not be treated as such. The information provided does not involve any specific investment objectives, financial situation and needs of any specific person who may receive it. Please be aware, that past performance is not a reliable indicator of future performance and/or results. Past Performance or Forward-looking scenarios based upon the reasonable beliefs of the third-party provider are not a guarantee of future performance. Actual results may differ materially from those anticipated in forward-looking or past performance statements. IC Markets makes no representation or warranty and assumes no liability as to the accuracy or completeness of the information provided, nor any loss arising from any investment based on a recommendation, forecast or any information supplied by any third-party.

Potential bearish drop?XAU/USD is rising towards the resistance level which is a pullback resistance that aligns with the 23.6% Fibonacci retracement and could drop from this level to our take profit.
Entry: 3,007.14
Why we like it:
There is a pullback resistance level that line sup with the 23.6% Fibonacci retracement.
Stop loss: 3,059.25
Why we like it:
There is a pullback resistance level that lines up with the 50% Fibonacci retracement.
Take profit: 2,951.70
Why we like it:
There is a pullback support level that is slightly below the 61.8% Fibonacci retracement.
Enjoying your TradingView experience? Review us!
Please be advised that the information presented on TradingView is provided to Vantage (‘Vantage Global Limited’, ‘we’) by a third-party provider (‘Everest Fortune Group’). Please be reminded that you are solely responsible for the trading decisions on your account. There is a very high degree of risk involved in trading. Any information and/or content is intended entirely for research, educational and informational purposes only and does not constitute investment or consultation advice or investment strategy. The information is not tailored to the investment needs of any specific person and therefore does not involve a consideration of any of the investment objectives, financial situation or needs of any viewer that may receive it. Kindly also note that past performance is not a reliable indicator of future results. Actual results may differ materially from those anticipated in forward-looking or past performance statements. We assume no liability as to the accuracy or completeness of any of the information and/or content provided herein and the Company cannot be held responsible for any omission, mistake nor for any loss or damage including without limitation to any loss of profit which may arise from reliance on any information supplied by Everest Fortune Group.

GOLD Will Go UP! Buy!
Hello,Traders!
GOLD made a nice correction
Of almost 7% on the general
Panic over the trade wars which
Gives us a great opportunity
To jump into Gold with a discount
From a nice horizontal support
Level of 2945$ from where
We will be expecting a
Further bullish move up
Buy!
Comment and subscribe to help us grow!
Check out other forecasts below too!
Disclosure: I am part of Trade Nation's Influencer program and receive a monthly fee for using their TradingView charts in my analysis.

It could be worse for Gold and Bitcoin, right? Apple alone has shed nearly $640 billion in market capitalisation over just three days. The S&P 500 has fallen more than 10% during the same stretch—its worst performance since the onset of the COVID-19 pandemic. In Asia, the selloff is even more severe, with Japan's Nikkei 225 down nearly 8%, South Korea’s Kospi 200 off almost 6%, and Taiwan equities falling close to 10%, triggering circuit breakers.
In comparison, Bitcoin and Gold, while under pressure, appear to be weathering the downturn with relatively less panic.
Bitcoin has declined around 10%—a notable drop, but not unusual by crypto standards. Trading near $76,000, it has returned to pre-election levels, breaching both short- and long-term support zones.
Gold is tracking its worst three-day performance in over four years. Although some positive forecasts are emerging. Deutsche Bank has revised its year-end gold price forecast upward to $3,350, citing rising recession risks and renewed safe-haven demand.

Gold (XAU/USD) Price Outlook:Gold (XAU/USD) Price Outlook:
🔸 Bearish Scenario:
If the price of gold breaks and closes below the key support level of 3016, it will indicate a strong bearish signal. This breakdown would suggest that selling pressure is increasing, and we could see a continued downward move toward the next support zone. The immediate target in this case would be around 3002, where buyers may attempt to step in. A sustained move below 3002 could open the door for further downside.
Key Levels to Watch:
Support: 3016 (break level)
Target: 3002/2978
Additional downside possible if 3002 fails to hold
🔸 Bullish Scenario:
On the other hand, if gold breaks and closes above the resistance level of 3030, it will signal bullish momentum and a possible continuation of the uptrend. This breakout could trigger buying interest, pushing the price higher toward the next resistance levels at 3052 and 3065. These levels will act as short-term targets for bulls.
Key Levels to Watch:
Resistance: 3030 (break level)
Bullish targets: 3052 and 3065
Further upside possible if momentum continues above 3065
Bullish bounce off pullback suport?The Gold (XAU/USD) is falling towards the pivot which has been identifed as a pullback support and could bounce to the 1st resistance.
Pivot; 2,954.94
1st Support: 2,790.01
1st Resistance: 3,132.12
Risk Warning:
Trading Forex and CFDs carries a high level of risk to your capital and you should only trade with money you can afford to lose. Trading Forex and CFDs may not be suitable for all investors, so please ensure that you fully understand the risks involved and seek independent advice if necessary.
Disclaimer:
The above opinions given constitute general market commentary, and do not constitute the opinion or advice of IC Markets or any form of personal or investment advice.
Any opinions, news, research, analyses, prices, other information, or links to third-party sites contained on this website are provided on an "as-is" basis, are intended only to be informative, is not an advice nor a recommendation, nor research, or a record of our trading prices, or an offer of, or solicitation for a transaction in any financial instrument and thus should not be treated as such. The information provided does not involve any specific investment objectives, financial situation and needs of any specific person who may receive it. Please be aware, that past performance is not a reliable indicator of future performance and/or results. Past Performance or Forward-looking scenarios based upon the reasonable beliefs of the third-party provider are not a guarantee of future performance. Actual results may differ materially from those anticipated in forward-looking or past performance statements. IC Markets makes no representation or warranty and assumes no liability as to the accuracy or completeness of the information provided, nor any loss arising from any investment based on a recommendation, forecast or any information supplied by any third-party.

GOLD BULLISH BIAS|LONG|
✅GOLD fell again to retest the support
But it is a strong key level of 3000$
So we are already seeing a rebound
And we will be expecting a
Further bullish move up
LONG🚀
✅Like and subscribe to never miss a new idea!✅
Disclosure: I am part of Trade Nation's Influencer program and receive a monthly fee for using their TradingView charts in my analysis.

Gold: Will Price Rebound from Demand Zone?On this wonderful collapse yesterday we saw that the price reached the demand zone, from which it can finally reach the level of 3200 and go higher. We are buying!

GOLD 3000$ Key Level Ahead! Buy!
Hello,Traders!
GOLD is making a bearish
Correction just as pretty
Much everything else on
The market, but Gold is
Trading in a long-term
Uptrend so after the
Price hits an important
Psychological level
Around 3000$ a local
Bullish trend-following
Rebound is to be expected
Sell!
Comment and subscribe to help us grow!
Check out other forecasts below too!
Disclosure: I am part of Trade Nation's Influencer program and receive a monthly fee for using their TradingView charts in my analysis.

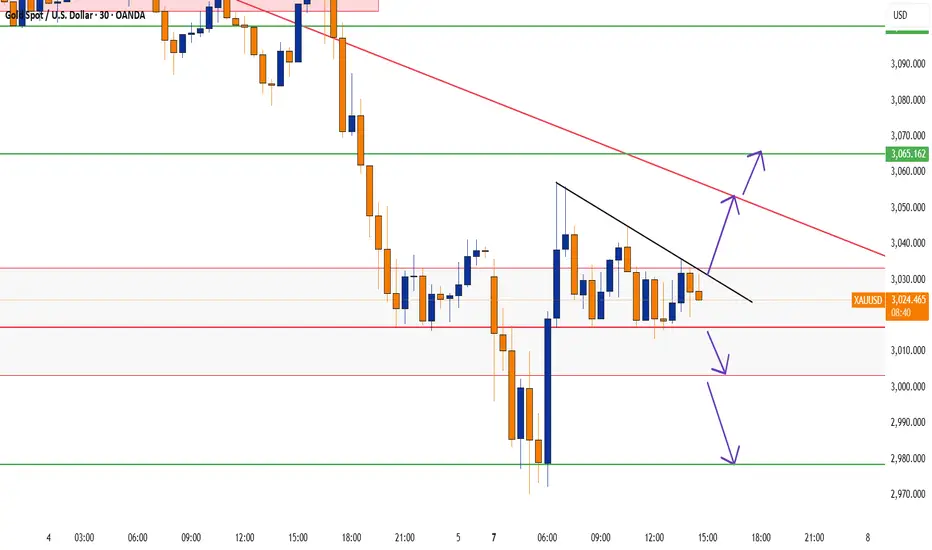
XAU/USD Trendline Breakout (02.04.2025)The XAU/USD Pair on the M30 timeframe presents a Potential Selling Opportunity due to a recent Formation of a Trendline Breakout Pattern. This suggests a shift in momentum towards the downside in the coming hours.
Possible Short Trade:
Entry: Consider Entering A Short Position around Trendline Of The Pattern.
Target Levels:
1st Support – 3077
2nd Support – 3048
🎁 Please hit the like button and
🎁 Leave a comment to support for My Post !
Your likes and comments are incredibly motivating and will encourage me to share more analysis with you.
Best Regards, KABHI_TA_TRADING
Thank you.

Bearish drop?The Gold (XAU/USD) has rejected off the pivot and could potentially drop to the 1st support that aligns with the 50% Fibonacci retracement.
Pivot: 3,127.89
1st Support: 3,084.91
1st Resistance: 3,146.14
Risk Warning:
Trading Forex and CFDs carries a high level of risk to your capital and you should only trade with money you can afford to lose. Trading Forex and CFDs may not be suitable for all investors, so please ensure that you fully understand the risks involved and seek independent advice if necessary.
Disclaimer:
The above opinions given constitute general market commentary, and do not constitute the opinion or advice of IC Markets or any form of personal or investment advice.
Any opinions, news, research, analyses, prices, other information, or links to third-party sites contained on this website are provided on an "as-is" basis, are intended only to be informative, is not an advice nor a recommendation, nor research, or a record of our trading prices, or an offer of, or solicitation for a transaction in any financial instrument and thus should not be treated as such. The information provided does not involve any specific investment objectives, financial situation and needs of any specific person who may receive it. Please be aware, that past performance is not a reliable indicator of future performance and/or results. Past Performance or Forward-looking scenarios based upon the reasonable beliefs of the third-party provider are not a guarantee of future performance. Actual results may differ materially from those anticipated in forward-looking or past performance statements. IC Markets makes no representation or warranty and assumes no liability as to the accuracy or completeness of the information provided, nor any loss arising from any investment based on a recommendation, forecast or any information supplied by any third-party.

Heading into 50% Fibonacci resistance?XAU/USD is rising towards the resistance level which is an overlap resistance that lie sup with the 50% Fibonacci retracement and could reverse from this level to our take profit.
Entry: 3,124.63
Why we like it:
There is an overlap resistance level that lines up with the 50% Fibonacci retracement.
Stop loss: 3,146.29
Why we like it:
There is a pullback resistance level.
Take profit: 3,097.69
Why we like it:
There is a pullback support level that lines up with the 38.2% Fibonacci retracement.
Enjoying your TradingView experience? Review us!
Please be advised that the information presented on TradingView is provided to Vantage (‘Vantage Global Limited’, ‘we’) by a third-party provider (‘Everest Fortune Group’). Please be reminded that you are solely responsible for the trading decisions on your account. There is a very high degree of risk involved in trading. Any information and/or content is intended entirely for research, educational and informational purposes only and does not constitute investment or consultation advice or investment strategy. The information is not tailored to the investment needs of any specific person and therefore does not involve a consideration of any of the investment objectives, financial situation or needs of any viewer that may receive it. Kindly also note that past performance is not a reliable indicator of future results. Actual results may differ materially from those anticipated in forward-looking or past performance statements. We assume no liability as to the accuracy or completeness of any of the information and/or content provided herein and the Company cannot be held responsible for any omission, mistake nor for any loss or damage including without limitation to any loss of profit which may arise from reliance on any information supplied by Everest Fortune Group.

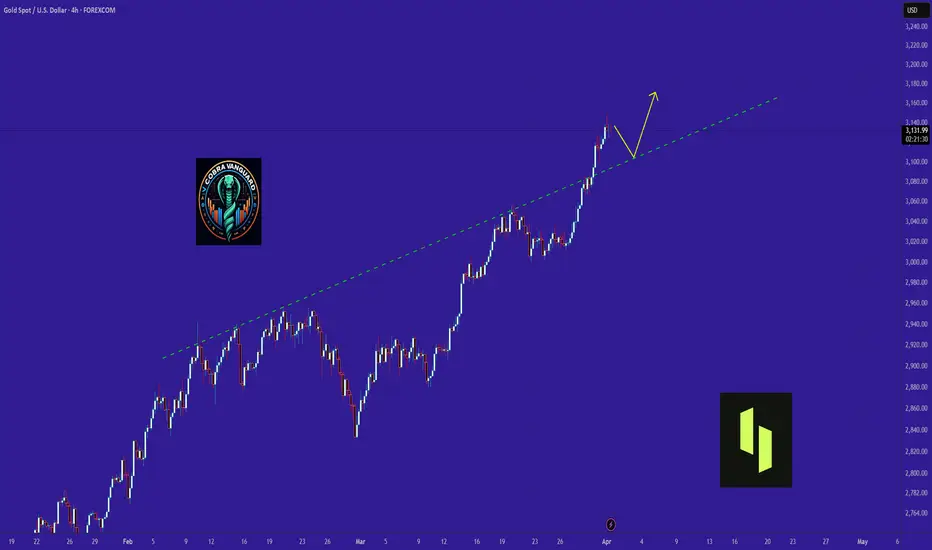
Gold in coming days ...Gold needs a price correction to $3100 for the continuation of its upward trend.
Give me some energy !!
✨We spend hours finding potential opportunities and writing useful ideas, we would be happy if you support us.
Best regards CobraVanguard.💚
_ _ _ _ __ _ _ _ _ _ _ _ _ _ _ _ _ _ _ _ _ _ _ _ _ _ _ _ _ _ _ _
✅Thank you, and for more ideas, hit ❤️Like❤️ and 🌟Follow🌟!
⚠️Things can change...
The markets are always changing and even with all these signals, the market changes tend to be strong and fast!!
XAUUSD - Daily, Gold’s Next Big Move: Be Ready!XAUUSD - Daily Update 📈
With most analysts focusing on Gold’s bullish momentum, let’s step back and analyze where we are in the bigger picture and where we should secure profits before a potential correction.
Gold has been in a strong uptrend since the $2,000 zone, forming three major bullish legs as highlighted in the chart:
🔹 First leg correction: ~$150 drop
🔹 Second leg correction: ~$250 drop
🔹 Third correction may be deeper, so caution is needed in the target zone.
Key Levels to Watch:
📌 Potential Target Zone: $3,050 - $3,150
✔️ Measured Move: Previous legs suggest an extension into this zone.
✔️ Liquidity Grab: Gold tends to hunt liquidity over round numbers—just as it did at $2,000 → $2,060, it may break $3,050 before reversing.
✔️ Ascending Channel: The price is approaching the top of the channel, where market makers may trigger a fake breakout before a significant pullback.
🚨 Trading Strategy:
Swing traders: Secure profits near $3,050 - $3,150.
Daily traders: Use pullbacks as short-term profit opportunities.
💸 If you missed this rally, stay ahead for reversal signs & upcoming moves! Follow for more insights! 🚀

GOLD SHORT SETUP: TARGETING $3,100 FROM OVERBOUGHT CONDITIONSGOLD SHORT SETUP: TARGETING $3,100 FROM OVERBOUGHT CONDITIONS
Looking at the current Gold chart, we're seeing potential exhaustion signs near all-time highs. While the trend remains strongly bullish (all moving averages pointing up), several indicators suggest we may be due for a pullback to the $3,100 level.
Key Observations
Overbought RSI (77.09): The RSI is showing overbought conditions without divergence yet, but at levels where previous corrections have occurred.
Extreme Stochastic (97.99): Nearly maxed out at 98, suggesting limited upside momentum remains.
Williams %R near zero (-2.44): Showing extreme buying pressure that historically doesn't sustain.
CCI above 140: At 146.61, well into overbought territory.
Moving Average Spacing: While all MAs signal "Buy," the distance between recent EMAs (10, 20) and price indicates stretched conditions.
Risk Management
This is a counter-trend trade against strong bullish momentum, so position sizing should be conservative. The R2 pivot at $3,045 and the 10-day SMA at $3,046 should act as initial support levels and could provide clues about whether the pullback thesis is playing out.

As I always emphasized, when you find the trend - stay :)When you find the trend, follow it and stay on it as long as it is valid. I uses STFLAT and oh boy, happy I did.
