Litecoin LTC/USD Buy The Fear Sell The EuphoriaI haven't made a Litecoin chart in a while. We've been sideways and uneventful, figured I would wait till something eventful happens. Well here it is folks , the moment before we actually move up everyone is selling except for a few smart hands. This fractal says it all in my opinion. fractals are usually very similar but not exact. Where we are now in price for Litecoin around 83 is really close to the bottom of this pullback. It washed out and cleaned up all the leverage, a very common occurrence in this market before large moves up. The move will be absolutely explosive and probably no meaningful pullback until we break the all time high. I see a pullback to retest the high before the next massive leg up.
Right now in my opinion is the worst place to sell. I know this "bear market" is not a real bear market because of how many people are saying it is. The whole world says its a bear market right now, every youtube grifter has pivoted to bear market recently with this drop, every news channel is saying it is. Thats why its not, most have sold already and now the price I believe will rebound so fast it'll shock everyone and the ones who sold will be in denial waiting for the "next low". When that low doesn't come and we break the highs they will all pile back in.
Everyone says oh this moving average, or this indicator, or this RSI. Look its all helpful stuff but its also all imaginary lines. Who says that we MUST be in a bear market because we broke a 200 day moving average. Who says because RSI is overbought we must go down. RSI has infinite different adjustments so whos to say that the 14 length is correct? These indicators will begin to fail over time as more and more people look at them. Right now there is more traders and wanna be traders in the world than ever before so if everyone is looking at the same thing all the time then most likely those will start to fail. Oh its happened every time before , I know , I know. Come on at the end of the day Bitcoin is still in its infancy. I dont buy the four year cycle, or seasonality crap, its foolish and betting your portfolio on those factors alone is a recipe for BROKE! I still stand by my previous long term predictions. Obviously its taking much longer than I expected but timing these things is nearly impossible on the long term time frame. While all the youtube grifters flip flop weekly I listen to the Billonaires and people who MAKE the markets. Saylor said three days ago the pullback is almost over and hes buying. Blackrocks Robbie Mitchnick says this is a good buying area and thats just a couple theres dozens of big wigs saying the same thing.
So to wrap this up I believe we are at the point of rocket ship. Look at economic factors, liquidity worldwide is expanding, stimulus is coming, tightening is ending, rates are coming down. Fiat currencies worldwide are about to go into hyperinflation and certain cryptos will reap the benefit of that. Bitcoin and Litecoin being the top gainers in this next phase of hyperinflation in my opinion. This is just my opinion and not financial advice. Thank you
J-xrp

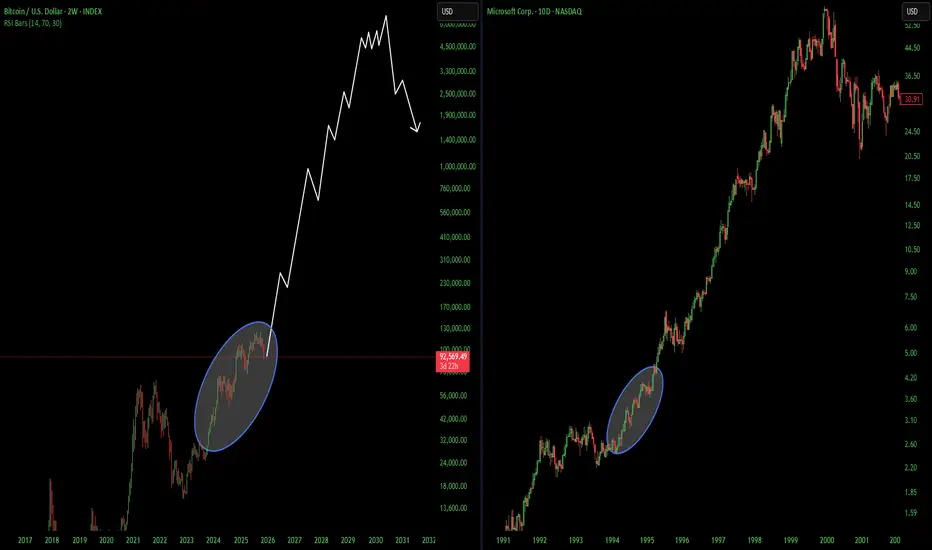
BTC Cup and Handle Still Not CompleteAs you can see the SPX broke out of the cup and handle and completed the measured move. It then corrected back down to the top of the handle and resumed its uptrend. This is what is coming for Bitcoin. Bitcoin has only half way completed the cup and handle. Measured move to around 300k before correcting back down to 70k and then back off to the races. Hold onto your hats. That would be the most epic move of all time a straight shot from here to 300k no pullback then slam back down to 70k and then back up to 500k. Could happen fast dont underestimate Bitcoin.
Just my opinion not financial advice.

XRPUSDT.P - November 22, 2025The chart for XRPUSDT shows a sustained downtrend, confirmed by a descending trendline and a consistent pattern of lower highs and lower lows. Price action is currently consolidating below the trendline, with resistance around 1.95 and key support marked near 1.72 and 1.32. Momentum remains bearish; a failed recovery above resistance could trigger a sharp move down to the next support zone. If buyers regain control and break above the trendline, a short-term reversal toward 1.95 is possible, but overall trend structure favors sellers.

XRP HOLIDAY SALE!The overall crypto market has been sliding off recent highs since late September. This was after crypto markets created gap structures on the October 10th sell off. The gap left on XRP was priced in near $1.99-$1.98. We have just reached this liquidity zone. I expect fear to boost and bears to be trapped as the crypto season approaches the holidays, this should be an early Black Friday sale to new highs toward $4 and higher.
Happy Thanksgiving and Early Christmas
-This is not financial advice, R2C.

XRPUSDT.P - November 21, 2025Price is locked in a well‑defined short‑term downtrend, with a descending trendline capping every rally and the latest breakdown extending from the recent lower high.
The highlighted resistance band around 2.12–2.15 is the key pivot; as long as price remains below this area, momentum favors a continuation lower toward the prior swing‑low support cluster near 1.92, with any bounce into that resistance likely to be sold.

XRPUSDT.P - November 20, 2025This chart shows a corrective upward move within a broader downtrend, with current resistance at 2.14 and major resistance at 2.17. The price action indicates a possible rejection from these resistance zones, with a projected move down toward the support level around 2.03. Trend structure remains bearish as rallies are failing to break above prior resistance levels. Momentum appears weak, suggesting sellers are likely to regain control near overhead resistance.

Market Outlook: Bitcoin Path to $150KThe broader structure on Bitcoin still points toward a long-term expansion into and possibly above the $150K region, but the chart is showing as always that we won’t get there in a straight line.
Just like when I previously predicted Bitcoin’s move to $108K (See my 2021 Bold but slightly off in timing call here: ), the current setup is following the same pattern of exhaustion → correction → expansion. The signs are repeating and becoming clear again: momentum is slowing, resistance is rejecting harder and faster than ever, and volume is now tapering off. When this happens, the market usually needs a deeper reset before the next major leg to the upside.
A pullback into the $70K–$75K zone looks not only possible but healthy, not just for Bitoin but the entrie crypto market. If i was a first time investor and this played out this level would be where I steadily start to invest slowly week by week across the major favorites like Ethereem, XRP, Litecoin, Solana, Cardano, Chainlink, etc
This pullback area below 75k aligns with:
• A major liquidity pocket that has not been tapped
• The previous breakout zone needing a retest
• An ideal discount region for larger institutions to reload
• A level that would wipe out overleveraged longs and rebalance the crypto market
The drop have been and will feel even more painful to longer term investors, especially for new buyers or late comers wo came in above these numbers, but this kind of correction is exactly what fuels the next macro wave or what we like to call the next BULL RUN.
Once BTC finds support in the $70K–$75K range and reclaims that zone, the next bullish impulse opens up and that’s where we get the continuation toward the $150K macro target. The structure, liquidity map, and long-term momentum all support this trajectory.
In short:
Short-term: a deep corrective pullback.
Mid-term: stabilization and accumulation.
Long-term: the trajectory remains intact for a push toward $150K in the coming few months to couple years, just like that 2021 $100K call.
Stay Ready!

What A Shocker That Would Be Huh?Blackrock, Saylor and gang are in for some big gains. As for most of you who sold you're in for a rude awakening!
What A Shocker That Would Be Huh?Blackrock, Saylor and gang are in for some big gains. As for most of you who sold you're in for a rude awakening!
XRPUSDTP. - November 20, 2025This chart illustrates a persistent downtrend with consistent lower highs and lower lows, confirmed by the descending trendline pressure. Price has recently broken below a key horizontal support at 2.167 and is accelerating downward toward the next major support zone around 1.95. Bearish momentum dominates, with no significant reversal signals present, and rallies are likely to face resistance near the 2.15–2.17 area. The bearish structure remains intact as long as price stays below the trendline and fails to reclaim lost support.

XRP: Support Break or FVG Refill?XRP is holding inside a major support zone that’s been tested multiple times, but buyers are showing signs of exhaustion. The most recent move into the yellow FVG created an inefficiency that price often wants to revisit — but the trendline resistance above continues to cap momentum.
A push into the FVG followed by rejection would keep bearish structure intact. If the current support fails, the next liquidity draw sits much lower near the purple level, where price previously saw aggressive reactions.
Stoch RSI is trying to cycle upward, but without a strong rebound from this support, momentum alone won’t reverse the trend.
This level decides whether XRP fills the FVG and attempts a recovery — or breaks structure and seeks liquidity below.

It's Clear... Isn't it? This chart lays out the cycle tops and bottoms of bitcoin going back to the halving in 2012.
What we can clearly identify is that every major cycle low started a run for 1065 days into new All time Highs.
If this is true still, we should be headed down for an entire year.
However,
like many indicators, I believe they become unusable.
Over time if something works, too many people use it to identify a trade, whether that's institutions or retail as a collective.
This chart should scream bear.
However, I love the counter trade.
Every major figurehead is screaming bear, I just don't believe that to be the case. If everyone is shorting, what happens. if everyone sold what happens.
Counter trade. Most people think they understand, until they don't.
A trade can always flip, you cannot hold conviction because you want it to go a certain way, you have to be ready to change your mind when the time is right.
I am Bullish. For now.
Run the table.
BITSTAMP:BTCUSD

XRPUSDT.P - November 17, 2025Price remains in a clear short-term downtrend and is retesting support around 2.16 after a sharp decline. A long setup becomes valid only if price shows a confirmed bounce from this support, with resistance and the projected target positioned at 2.26–2.27. A break below 2.10 would likely continue the downtrend toward the lower support near 2.03.
Risk Assessment
With a stop level near 2.03 and a target at 2.26–2.27, the trade offers favorable reward relative to risk but remains high-risk due to trading against the prevailing downtrend.

XRP MONTH OF ETF'S! 🔥 Hey hey, if your reading this I hope this finds you well. Been a while and figured it'd be good to catch up with things and make a quick analysis on what we're dealing with and looking at on our technical and beyond analysis'.
🔥 The last month or so has seen much of the digital space take on a rather big slump being led by Bitcoin's 14% decline from that $115,000 mark down to the $94-95,000 range. That being said XRP has managed to hold and keep it's gains much better than most others in the space, especially as it holds above that $2.1 mark, even after the flash sale that hit October 10th the asset has held strong.
🔥 It's great to see that price action has been pretty steady, even as we've been dragged down thanks to a descending channel so that's been positive to see the market's resilience through everything. I've set a price alert at $1.95 should we break below that but with tomorrow's XRP ETF launch we may just see things bounce from where we are with bullish optimism, hype.
🔥 Main thing I'll be watching for is the descending channel, mainly looking for bullish confirmation if we reenter the channel and another confirmation would be if we could break out of the channel for a breakout which could help sustain that momentum and help us retest $2.5 and even $3 depending on just how much investors and institutions are willing to buy into the ETF on the opening.
🔥 Definitely won't be easy though, it has also been reported that a whale has transferred roughly $95 Million worth of XRP to Binance within the last few days. Might not mean much but historically speaking more often then not we're use to seeing whales move large quantities off cold storage to the exchanges prior to large events whether it's an ETF or some hype for a project or asset in anticipation of selling some or buying more using leverage depending on which way things lean. So least to say, it'll be a fight this week for bulls and bears.
🔥 Main driver we've got right now for XRP is it's ETF debut's this month with it's first being Canary's Capital funds XRP ETF which saw a record $58 million in volume for the first day setting 2025's ETF debut record. That's been a good boost and with Franklin Templeton's XRP ETF launch today expectations are high for the new investment vehicle so hoping we get some positive price action today.
🔥 Last but not least, much as we love doing our beyond analysis, for our technical we're watching this falling wedge to see if XRP can breakout of that channel and possibly give us the breakout we've been waiting on. If there's ever a day we'd want it, it's today and at the very least this week so keeping track with that and my alert for $2.19 should we reverse and fall further. Either way keep posted and keep your spirits up.
🔥 End of the day, everything works out, just have to trust in the process. Thanks for joining me today and wishing all the best.
🔥 Best regards as always till next time,
~ Rock'

TradeCityPro | XRP Shows Potential After Support Bounce👋 Welcome to TradeCity Pro!
Let’s dive into the XRP coin analysis. It’s one of the oldest crypto projects, with a market cap of $136.74 billion, currently ranked 4th on CoinMarketCap.
⏳ 4-Hour Timeframe
On the 4-hour timeframe, this coin is sitting on a very important support level at 2.1843.
✔️ This level can also be viewed as a support zone. Currently, the price has shown a reaction to this zone and is moving upwards with very low volume.
⚡️ The first resistance zone for XRP is at 2.3404. Considering the low buying volume in the recent candles, the probability of a continued bullish move is higher unless the buying volume increases.
📊 If the buying volume starts to increase, we can use the 2.3404 level as a trigger for a long position. The next significant resistance levels for this coin are 2.5508 and 2.6718.
🔔 However, if the volume remains this low, a break below the 2.1843 support could trigger a short position. The next support zone for XRP is at 2.0013.
🛒 For spot purchases or confirmation of a new bullish trend, the trigger we currently have is 2.6718. Personally, for spot buying, I will track this coin after the 2.6718 level.
📝 Final Thoughts
Stay calm, trade wisely, and let's capture the market's best opportunities!
This analysis reflects our opinions and is not financial advice.
Share your thoughts in the comments, and don’t forget to share this analysis with your friends! ❤️

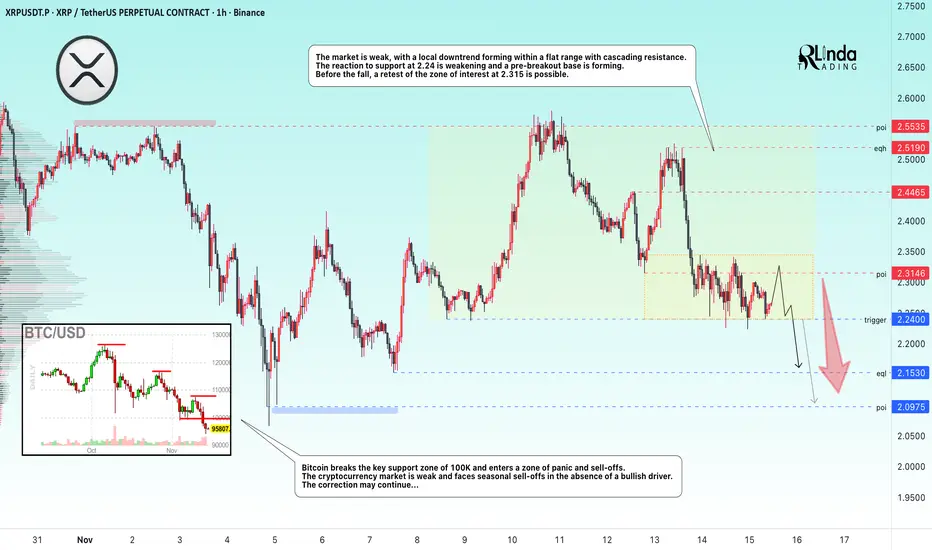
XRPUSDT → Consolidation before breaking through support BINANCE:XRPUSDT continues to storm the 2.24 support level amid a downtrend and a weak market. There is no bullish driver, and the fundamental background is also weak...
Bitcoin breaks through the key support zone of 100K and enters a zone of panic and sell-offs. The cryptocurrency market is weak and facing seasonal sell-offs in the absence of a bullish driver. The correction may continue...
XRP is forming a local downtrend with cascading resistance within a flat. The reaction to the 2.24 support is weakening and a pre-breakout base is forming. Before the fall, a retest of the 2.315 zone of interest is possible.
Resistance levels: 2.315, 2.4465
Support levels: 2.24, 2.153, 2.097
A false breakout of 2.3146 could trigger a further decline, but a close below 2.153 could trigger a sell-off and a subsequent decline to the 2.153-2.097 zone.
Best regards, R. Linda!
Xrp - last stop until valhallaCan you see it?
IH&S
On the 4th leg down (5 we break)
In a decending channel
Sitting on monthly pivot
Etf's
Iso20022 incoming
...
I mean.. Never say never, but, this train is leaving!

NOW OR NEVER - The Bulls’ Final Stand?⚔️The crypto market is standing at a make-or-break moment , and the next few weeks could define how this cycle ends.
CRYPTOCAP:BTC is testing the $90,000 support, a level that has acted as a major pivot point throughout this bullish channel.
CRYPTOCAP:USDT.D is hovering just below the 6.4% resistance, a threshold that has historically marked market reversals.
Meanwhile, CRYPTOCAP:XRP is clinging to its $1.9 support, holding the line for altcoin sentiment.
🏹If Bitcoin holds above $90K, USDT.D remains capped under 6.4%, and XRP stays strong above $1.9, the bulls could regain full control and ignite the next major impulse across the entire crypto market.
But if these levels fail… the tide could turn fast.
It’s truly NOW OR NEVER for the bulls. ⏳🔥
⚠️ Disclaimer: This is not financial advice. Always do your own research and manage risk properly.
📊All Strategies Are Good; If Managed Properly!
~Richard Nasr

XRP Capital Sector. Price Slice TF 3M 4.9671🏷 XRP Capital Sector. Price Slice TF 3M 4.9671
🏷 4.9671 — At the time of publication, the price had not yet been reached. ( на момент публикации цена не достигнута )
🏷 3.6297 — Level confirmed. ( уровень подтвержден )

XRPUSDT → False breakout of resistance in a weak marketBINANCE:XRPUSDT faces strong resistance and forms a false breakout amid a weak market. Bearish pressure remains high...
Bitcoin failed to break through the 106K resistance and returned to the short zone, with the cryptocurrency market, including XRP, reacting with a decline... Overall, the market is in a weak phase and is not yet ready to move into strong growth. Consolidation may continue...
False breakout of resistance at 2.5530 amid a weak market. The market has no potential for continued growth, and a reversal pattern is forming, provoking a sell-off...
Resistance levels: 2.496 - 2.553
Support levels: 2.376, 2.24
A retest of the local base at 2.5 is possible before the decline continues. As part of the current movement, the market may test 2.37, but if the bulls fail to hold this zone, the coin may drop to 2.24.
Best regards, R. Linda!

XRPUSDT.P - November 15, 2025XRPUSDT is trading around $2.28 on the 15-minute chart, still moving within a short-term downtrend under a descending trendline. Price is currently reacting inside a $2.25–$2.29 support zone, showing early signs of compression near trendline resistance. Immediate horizontal resistance sits at $2.31–$2.34, which must be reclaimed for bullish momentum to develop. A clean breakout and retest above this zone could open a move toward the $2.49 resistance level.
Failure to break the trendline and rejection from the $2.31–$2.34 support may trigger another leg down, with downside targets at $2.21–$2.24 and possibly the deeper support around $2.14–$2.16. Overall short-term outlook remains bearish to neutral, pending a confirmed breakout above near-term resistance.

XRPUSDT.P - November 14, 2025XRPUSDT on the 15-minute chart is stabilizing after a sharp decline, forming a short-term base above $2.26. Price is currently compressing beneath a clear intraday resistance band around $2.34–$2.35, which aligns with the marked breakout level. A decisive push and sustained hold above this zone would signal bullish momentum returning, opening room for a continuation move toward the $2.50–$2.52 profit target. Failure to break higher keeps price vulnerable to another retest of the lower support region, and a breakdown below $2.26 would invalidate the bullish setup and expose further downside.

XRPUSDT.P - November 13, 2025Testing out the sell signal generated by my personal minimalist buy and sell signal indicator (signals by miljedtothemoon v1) on the XRPUSDT.P (5-minute chart).
Yesterday, the indicator printed two winning trades — one on a buy (long) signal and one on a sell (short) signal. Let’s see if it works out today.
Disclaimer: This tool is still a work in progress and not 100% reliable. The signals can be high-risk and may produce false entries or exits.
This is for personal and educational purposes only — not financial advice, an advertisement, or a promotion.
