The Big Short? BTCHere we have an ascending channel on the 15 minute chart bulls have been weak since our recent top. I feel a strong move is coming here soon in the market time to lock in.
J-xrp

XRPUSD 1D chart review1. Trend and lines
• We had a clear downward trend (orange trend falling line).
• The price broke this line and came out of the top - this is usually a signal of changing the sentiment to a more bullish.
2. Support and resistance
• The next support: approx. 2,93–2.92 USD (Red Zone + SMA).
• Another strong support: approx. USD 2.76 (below, heavily tested earlier).
• The nearest resistance: approx. USD 3.12 (green line).
• Another resistance above: approx. 3,35-3.36 USD - very important, because breaking this level can open the road to $ 3.50 and higher.
3. Medium walking (SMA)
• Red SMA (shorter) slowly turns up.
• Green SMA (longer) is still slightly inheritance, but the price is already lasting.
• This is a positive signal - the beginning of the trend change may suggest.
4. MacD (at the bottom of the chart)
• The blue line (MacD) cut the orange (Signal) from below - this is a buy signal.
• The histogram begins to grow green → Momentum tilts to the bull side.
5. RSI
• RSI is around 55–60, i.e. in the neutral zone, not yet noticed.
• There is a place for further growth before it enters the purchase zone (> 70).
⸻
✅ Summary for you (straight)
• Breaking the inheritance trend, buy signal on MacD, RSI not too high yet.
• Key resistance now: USD 3.12 → If it pierces, the target is USD 3.35.
• Key support: USD 2.92 → If it drops below, possible exit to USD 2.76.


XRPUSD Is $5.00 next??XRP (XRPUSD) has been trading within a Channel Up since the April 07 'Trade War' market bottom and in the past 6 days it has been testing (and holding) the 1D MA50 (blue trend-line) as a Support.
Given that this is being done after the Bearish Leg bottomed (green Arc pattern) on the 1D MA100 (green trend-line), this 1D MA50 test is probably the last technical confirmation that the current Bullish Leg needs before it starts rising aggressively, similar to what happened in July.
That Bullish Leg peaked on the 2.0 Fibonacci extension level. If this sequence is repeated, expect the next high to be around $5.00.
-------------------------------------------------------------------------------
** Please LIKE 👍, FOLLOW ✅, SHARE 🙌 and COMMENT ✍ if you enjoy this idea! Also share your ideas and charts in the comments section below! This is best way to keep it relevant, support us, keep the content here free and allow the idea to reach as many people as possible. **
-------------------------------------------------------------------------------
💸💸💸💸💸💸
👇 👇 👇 👇 👇 👇

XRPUSD: Buy the Dips Above 2.90, Target the ATHAfter printing a new all-time high at the end of July, COINBASE:XRPUSD entered a correction phase that bottomed in early September around 2.70.
From there, the rebound was strong: price broke above the falling trendline and, even more importantly, reclaimed the 3.00 psychological level.
Looking at the broader chart structure since June, the picture is constructive and it’s reasonable to expect further upside — potentially a retest of the previous ATH, or even the making of a fresh one.
📈 Bias: I remain bullish on XRP as long as price holds above 2.90.
🎯 Trading Plan: The strategy here is to buy dips, with the old ATH as the first big target.

#XRP is Approaching a Breakout | Will It Hold or Collapse? Yello, Paradisers! Is #XRP about to confirm a real breakout from months of sideways pain, or is this just another trap? Let’s dissect what’s happening with precision so you’re prepared either way:
💎After weeks of compression beneath a well-defined descending resistance, #XRPUSDT is about to break out. The breakout above this key trendline is now increasing the probability of a bullish continuation, especially with the 50EMA acting as dynamic support and reinforcing the bullish pressure.
💎Currently, the price is trading around $3.00, right above the breakout zone. If the market successfully retests this descending resistance as new support and holds, this would signal strong momentum building up for the next impulsive leg.
💎If that happens, the first upside target is the moderate resistance level at $3.66. A confirmed break above that could send #XRPUSD toward the strong resistance near $4.17, which aligns with the upper boundary of the visible volume profile.
💎On the flip side, the support zone between $2.69 and $2.48 now becomes critical. A retracement into this area could provide a high-probability bounce, but any breakdown and daily close below $2.4849 would invalidate the current bullish setup. In that case, price could unwind sharply, as the bullish structure would be broken, and sellers could regain control.
Stay patient, Paradisers. Let the breakout confirm, and only then do we strike with conviction.
MyCryptoParadise
iFeel the success🌴

XRPUSD → Will the rate meeting be a bullish driver for altcoins?BINANCE:XRPUSDT.P is consolidating above the previously broken boundary of the descending triangle formed within the bullish trend. Important news is ahead—the Fed's meeting on interest rates, which is highly likely to become a bullish driver for the cryptocurrency market.
The daily structure of the XRP market looks promising. The price is not updating global lows, is staying within the boundaries of the uptrend, and at the same time is breaking through the resistance of the downward correction, trying to consolidate above the fairly strong support level of 2.9535. But the market is waiting for a driver, namely fundamental background. If this background strengthens after Powell's speech, Bitcoin and altcoins may strengthen, including XRP. However, the fundamental background largely depends on the overall mood of the Fed and its comments. The market has already priced in an interest rate cut, as this is predictable given the economic data. But traders will be watching Powell's tone and how dovish or hawkish his view of the situation is.
Support levels: 2.9535, 2.8853
Resistance levels: 3.0577, 3.155, 3.359
Technically, at the moment, I am considering a scenario of a retest of support and the formation of a long squeeze at 2.9535 - 2.8853 against the backdrop of increased news volatility (manipulative nature). However, if this does not happen, the focus will be on 3.0577, and a close above this level could trigger further growth.
Best regards, R. Linda!

BTC idea for the weekWithin this range, we have what I have posted is a temporary bear trap that runs us to the range high which is also called supply. I don't believe we'll make it past this point and we will continue the downward trend from 120+ K this should run us to around 90,000 maybe less before a significant accumulation and short markup phase

Another Triangle on the Radar - XRP - are we going down?Alright traders 👋, here’s another triangle setup I’m watching. Hopefully this one breaks the right way and gives us a nice move!
💤 The crypto market could really use a little cooldown period – and this trade might just fit into that scenario.
As always, let’s see how it plays out. Trade safe & good luck! 🍀
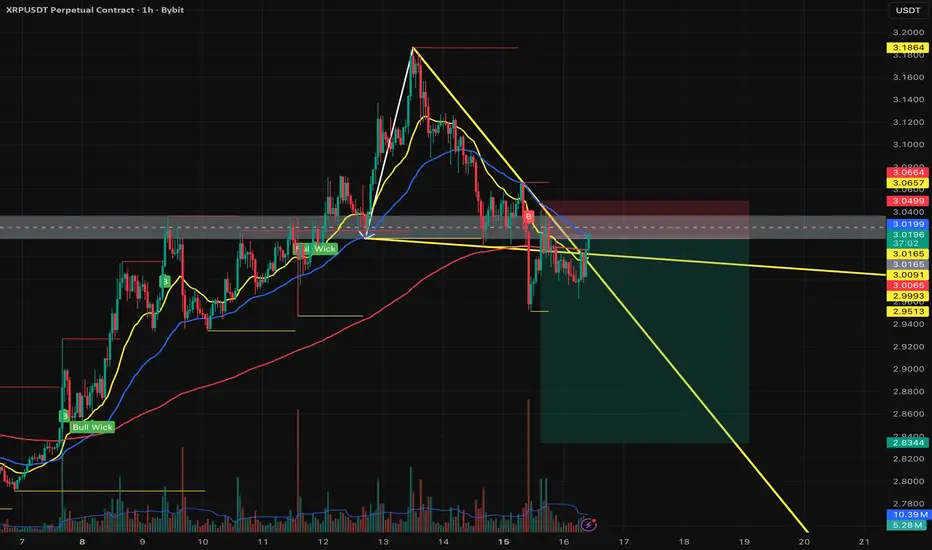
Check for support around 3.0361
Hello, fellow traders!
If you "Follow" me, you'll always get the latest information quickly. Have a great day today.
-------------------------------------
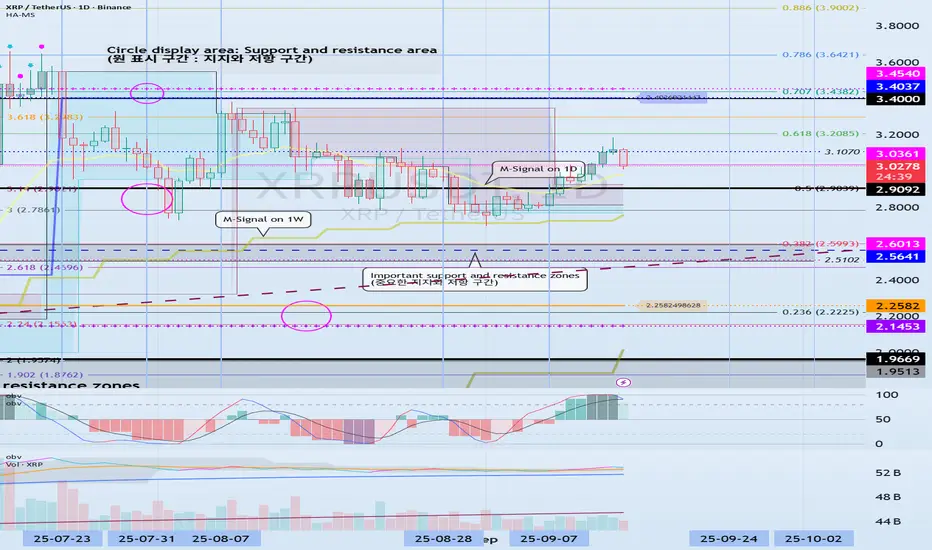
(XRPUSDT 1D chart)
The next volatility period is around September 24th.
However, we should closely monitor the movements around September 18th, which is also the volatile period for BTC.
The key is whether it can find support near 3.0361 and rise above 3.4037.
If not, we should check for support near 2.9092.
The 3.0361 level is the DOM (60) indicator point on the 1M chart. If it finds support near this level and rises, it could potentially lead to a long-term, step-like uptrend.
However, since the HA-High ~ DOM (60) range on the 1D chart is currently formed in the 3.4037-3.4540 range, a breakout above this range is expected to initiate a stepwise uptrend.
-
Thank you for reading to the end.
I wish you successful trading.
--------------------------------------------------
- Here's an explanation of the big picture.
(3-year bull market, 1-year bear market pattern)
I will provide more details when the bear market begins.
------------------------------------------------------
XRP Game PlanXRP Game Plan
📊 Market Sentiment
Overall sentiment remains bullish, supported by expectations of a 0.25% rate cut in the upcoming FOMC meeting. A weakening USD and increasing global risk appetite are creating favorable conditions for further upside in crypto assets.
📈 Technical Analysis
Price rejected the bearish trendline and started moving lower.
This indicates to me that price wants to grab more liquidity before expanding higher.
However, the HTF order flow remains strongly bullish, so I will only be looking for long setups here.
📌 Game Plan
I will be targeting the $2.72 liquidity zone, which holds significant liquidity.
Additionally, I will watch for price to test the HTF key level and look for rejection from that area.
🎯 Setup Trigger
I will look for a 6H–4H break of structure before entering a trade (with LTF confirmation).
📋 Trade Management
Stoploss: 6H–4H swing low confirming the BOS
Targets:
• TP1: $3.14
• TP2: $3.38
• TP3: $3.67 (All-Time Highs)
💬 Like, follow, and comment if you find this setup valuable!
⚠️ Disclaimer: This content is for informational and educational purposes only and does not constitute financial, investment, or trading advice. Always do your own research before making any financial decisions.

The XRP debacle?This coin and Blockchain may be great in the future, but definitely a bad investment compared to most of the majors. In my opinion. I am pretty sure with this pattern that I have mapped out we will see at least $.14 and probably five cents in the future, where banks and institutions will actually accumulate this coin and weak hands will sell. This looks to me as if it is a week off long-term reaccumulation pattern after the first initial takeoff in 2017 that being said if my prediction is right, five cent will be the spring to set off its next bull cycle. If we make it there, I will definitely buy a decent amount while everybody is panic selling.

XRPETH chart heading to it’s next breakout targetI do think eth will be making decent gains here in the near future, but t looks like xrp will outpace those gains with its own gains based on the current chart pattern on the XRPETH chart. *not financial advice*

Xrp - Take profit targetsOn Sept 5th I suggested that Xrp would bounce to 1 of my 3 take profit targets. Target 2 has now been hit and I am trailing stops up towards T3.
Can Xrp go higher...sure. But my strategy is to take the highest probability trades so I will win way more than I lose. I don't need to ride alts to the moon, I just need to be in profit week after week, so I can keep playing this game and afford to travel the world at will.
May the trends be with you.

XRP/USDT: Strong Growth PotentialXRP/USDT is currently trading in a clear upward channel, with strong support at 2.8600. The 12-hour chart shows that the price has made a strong recovery from this support level, continuing to rise and is now testing the resistance zone at 3.1100.
With EMA 34 and EMA 89 supporting the uptrend, XRP could continue to break through the nearest resistance levels and move towards 3.3300 if this momentum is maintained. If 3.1000 is broken, XRP could extend its rally towards 3.3300, creating significant profit opportunities.
With a stable upward channel structure and support at 2.8600, XRP has the potential to continue its rise. If the 3.1000 level is broken, the strong momentum will drive the price toward higher targets such as 3.3300 and 3.5000.

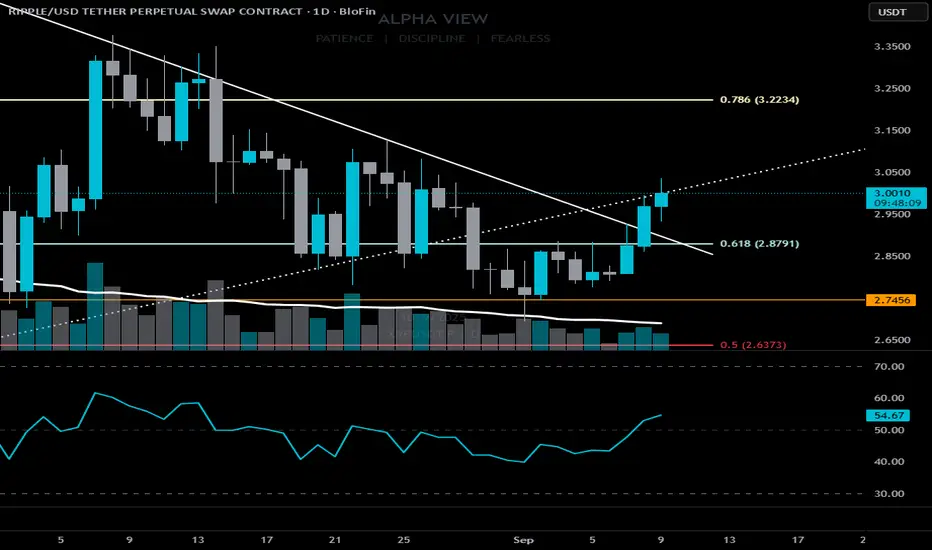
Number 3 is reminding the party he’s still on the guest list.Number 3 is reminding the party he’s still on the guest list. 🥂
CRYPTOCAP:XRP breaking clean from its $2.80–$2.95 consolidation base.
Push into $3.00+ signals bullish continuation if volume holds. Next test sits at $3.10–3.20.
📈 Momentum: creeping into overbought, but room for one more leg higher.
🔊 Volume: breakout backed by real buy-side conviction.
The Alpha View 👇
🎯 Setup is long, but execution requires patience:
— Ideal entry on a retest of $2.95–$2.99 (flipped resistance → support).
— Bonus confluence: a 1H bullish tail.
🎯 Targets:
TP1: $3.20–3.25
TP2: $3.40+ (runner if momentum extends)
⚠️ Don’t FOMO green candles. Precision beats emotion.
⚖️ Watch BTCЗif they stall, XRP’s move could fade.
🔑 Self-Regulate. Risk is the only guest you can control.
1day xrp bullish pennantHard to tell which of these trendlines is the most valid top trendline and bottom trendline of this triangle/pennant so I have to include them all since any can potentially be. *not financial advice*

XRP 2 Scenario In the Elliott Wave count for Ripple (XRP), two possible scenarios can be considered, as shown in the chart. It should be noted that the projected targets are only key PRZ levels and, except for the $11 zone, they should not be interpreted as definitive tops.
At the moment, my view is more aligned with the blue scenario, but with a slightly higher target around the $8–$9 range, mainly because we are approaching the end of the cycle.
That said, close attention should be paid to the chart structure and, more importantly, to price reactions at upcoming resistance levels.

XRPUSD - Monthly Not Done Yet XRPUSD is looking for more with this nice almost like flag structure signaling a further breakout on the Monthly
This can be seen on the RSI in the green circles. Two peaks are created as price moves up. This pattern is repeating itself.
Very bullish, probably even leading alts into altszn

XRP — September 01, 2025.CRYPTOCAP:XRP #XRP #RIPPLE
The mighty XRP (once worshipped as the next big thing in crypto) shows, based on trader liquidation maps, that we've hit max pain for long traders.
From the current price, you could consider a spot position with a potential for a +20%-24% move.
Entry price: $2.6906 - $2.7519
Take Profit: $3.3500 (+20-24%)
➖➖➖
Short Max Pain = $3.3500
Long Max Pain = $2.6906

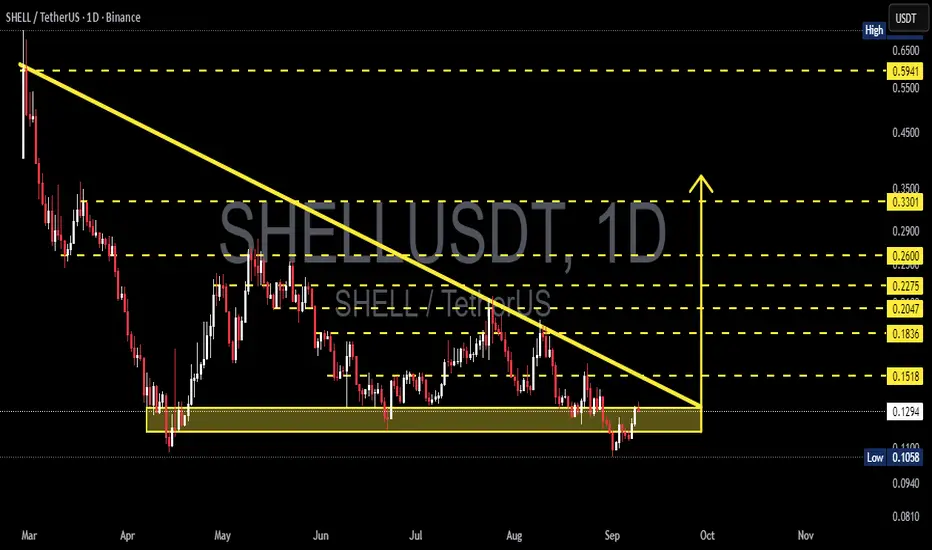
SHELL/USDT — Decision Point at the Edge of Descending TriangleCurrently, SHELL/USDT (1D) is at a critical stage after a prolonged downtrend since March. The chart clearly shows a Descending Triangle pattern, with strong support around 0.1058 – 0.1350.
Each time price dips into this zone, buyers step in for a rebound — yet sellers consistently push lower highs, forming a descending trendline. This signals the market is in a consolidation phase before a major decision: either a breakout to the upside or a breakdown to the downside.
---
🔎 Pattern and Chart Structure
Main pattern: Descending Triangle (default bias = bearish).
Strong support: 0.1058 – 0.1350 (demand zone, tested multiple times).
Dynamic resistance: Descending trendline (~0.1518 now).
Key levels to watch:
Resistance: 0.1836 → 0.2047 → 0.2275 → 0.2600 → 0.3301 → 0.5941.
Support: 0.0940 → 0.0810 (if breakdown).
---
🚀 Bullish Scenario
Bullish momentum may emerge if there’s a daily close above 0.1518 with strong volume, signaling buyers breaking through the descending pressure.
Initial target: 0.1836.
Mid targets: 0.2047 – 0.2275.
Extended targets: 0.2600 → 0.3301 → potentially 0.5941 if momentum accelerates.
Strategy: Enter after breakout confirmation, stop loss below 0.1300 or below 0.1058 for full invalidation.
---
🐻 Bearish Scenario
If price fails at the trendline and instead breaks down below 0.1058 on a daily close, the descending triangle plays out as a bearish continuation.
First target: 0.0940.
Next target: 0.0810.
Strategy: Enter short/re-entry on breakdown, with stop loss above 0.1200–0.1300.
---
📌 Conclusion: “Decision Zone”
SHELL/USDT is at a critical decision zone. Buyers are defending support, while sellers continue pressing down with lower highs.
Breakout above trendline → potential trend reversal.
Breakdown below support → bearish continuation.
Traders should avoid FOMO and wait for clear confirmation (breakout or breakdown). Risk management is essential: use stop loss and proper position sizing.
---
#SHELL #SHELLUSDT #Crypto #TechnicalAnalysis #SupportResistance #Breakout #DescendingTriangle #CryptoTrading
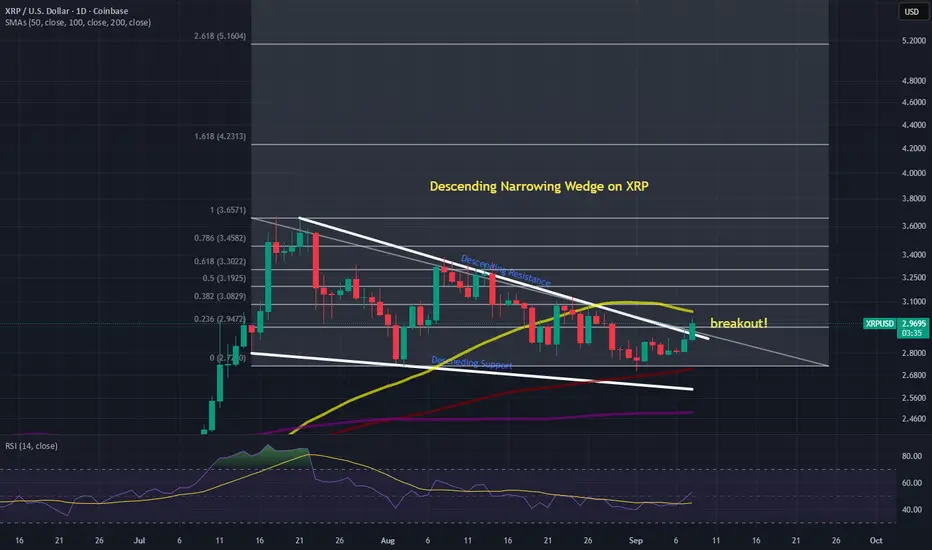
XRP Descending Narrowing Wedge Daily ChartXRP is currently breaking out of a descending narrowing wedge on the daily timeframe. XRP may meet some resistance at the 50 simple moving average as it approaches this level. I expect the price to fly after breaking this moving average. Seat belts everyone!
Not financial advice. Do your own DD.
Thanks for viewing the idea.
XRP: Lacks Momentum Despite Modest GainsRipple’s XRP is trading slightly higher today compared to last Monday, but it still hasn’t found real momentum. For now, it’s expected to continue moving upward toward resistance at $4.09 as part of turquoise wave B, before the correction of wave (2) is finally completed. The following magenta wave (3) should then drive gains above the $4.09 resistance level. If the altcoin manages to break directly above this level, this will suggest that wave alt.(2) has already wrapped up.
