#JASMY/USDT GOOD TIME TO BUY JASMY I MARK THE TARGETS
#JASMY
The price is moving within a descending channel on the hourly timeframe. It has reached the lower boundary and is heading towards a breakout, with a retest of the upper boundary expected.
The Relative Strength Index (RSI) is showing a downward trend, approaching the lower boundary, and an upward bounce is anticipated.
There is a key support zone in green at 0.00520. The price has bounced from this level several times and is expected to bounce again.
The indicator is showing a trend towards consolidation above the 100-period moving average, which we are approaching, supporting the upward move.
Entry Price: 0.00540
Target 1: 0.00550
Target 2: 0.00577
Target 3: 0.00600
Stop Loss: Below the green support zone.
Remember this simple thing: Money management.
For any questions, please leave a comment.
Thank you.
Jasmycoin

#JASMY/USDT GOOD TIME TO BUY JASMY I MARK THE TARGETS#JASMY
The price is moving within a descending channel on the hourly timeframe. It has reached the lower boundary and is heading towards a breakout, with a retest of the upper boundary expected.
The Relative Strength Index (RSI) is showing a downward trend, approaching the lower boundary, and an upward bounce is anticipated.
There is a key support zone in green at 0.00660. The price has bounced from this level several times and is expected to bounce again.
The RSI is showing a trend towards consolidation above the 100-period moving average, which we are approaching, supporting the upward move.
Entry Price: 0.00700
Target 1: 0.00713
Target 2: 0.00738
Target 3: 0.00772
Stop Loss: Below the green support zone.
Remember this simple thing: Money management.
For any questions, please leave a comment.
Thank you.

#JASMY/USDT GOOD TIME TO BUY JASMY I MARK THE TARGETS#JASMY
The price is moving within a descending channel on the hourly timeframe. It has reached the lower boundary and is heading towards a breakout, with a retest of the upper boundary expected.
The Relative Strength Index (RSI) is showing a downward trend, approaching the lower boundary, and an upward bounce is anticipated.
There is a key support zone in green at 0.00837. The price has bounced from this level several times and is expected to bounce again.
The RSI is showing a trend towards consolidation above the 100-period moving average, which we are approaching, supporting the upward move.
Entry Price: 0.00883
Target 1: 0.00911
Target 2: 0.00960
Target 3: 0.01026
Stop Loss: Below the green support zone.
Remember this simple thing: Money management.
For any questions, please leave a comment.
Thank you.

JASMY/USDT – Major Trendline Test: Breakout or Rejection?JASMY/USDT on the 2D timeframe remains in a medium-to-long-term bearish structure, characterized by a clear sequence of lower highs and lower lows since its historical peak. Price is currently attempting a technical rebound after forming a new swing low, but it is still trading below the main descending trendline, which has acted as resistance multiple times.
At this stage, the rebound should be considered corrective unless a confirmed breakout occurs.
---
Pattern Explanation
The chart clearly shows a Descending Trendline / Falling Market Structure:
A well-defined descending trendline connecting major price peaks
Every bullish attempt has been rejected at this trendline
The current price is approaching this trendline again, making it a critical decision zone
This pattern reflects strong seller dominance, but price compression near the trendline often leads to a volatility expansion (either breakout or strong rejection).
---
Key Support & Resistance Levels
Resistance Levels
0.011300 – Nearest minor resistance
0.013730 – Mid-range resistance / distribution zone
0.019400 – 0.023150 – Strong supply zone
0.031600 – Major resistance and key breakout confirmation
Support Levels
0.008970 – Current support
0.007000 – 0.005800 – Lower demand zone
0.004800 – Last major support (structural invalidation level)
---
Bullish Scenario
The bullish scenario becomes valid if:
Price breaks and closes above the descending trendline
Followed by a daily close above 0.011300
Successful retest of the trendline as support
Bullish Targets
1. 0.013730
2. 0.019400
3. 0.023150
4. 0.031600 (optimistic target if strong momentum follows)
Such a breakout would indicate an early trend reversal from bearish to bullish structure.
---
Bearish Scenario
The bearish scenario remains dominant if:
Price fails to break the descending trendline
Clear rejection candles appear (long upper wicks / bearish engulfing)
Price breaks back below 0.008970
Bearish Targets
0.007000
0.005800
0.004800
A rejection at the trendline would confirm that the current move is only a dead cat bounce.
---
Conclusion
JASMY/USDT is currently trading at a key technical area.
As long as price remains below the descending trendline, the overall bias stays bearish.
A confirmed breakout above the trendline could open the door for a medium-term trend reversal.
Patience and confirmation are crucial at this level.
---
#JASMY #JASMYUSDT #CryptoAnalysis #Altcoins #Downtrend #Trendline #Breakout #SupportResistance #PriceAction #TechnicalAnalysis #CryptoMarket

#JASMY/USDT GOOD TIME TO BUY JASMY I MARK THE TARGETS#JASMY
The price is moving in a descending channel on the 1-hour timeframe. It has reached the lower boundary and is heading towards breaking above it, with a retest of the upper boundary expected.
We have a downtrend on the RSI indicator, which has reached near the lower boundary, and an upward rebound is expected.
There is a key support zone in green at 0.00705. The price has bounced from this zone multiple times and is expected to bounce again.
We have a trend towards consolidation above the 100-period moving average, as we are moving close to it, which supports the upward movement.
Entry price: 0.00724
First target: 0.00755
Second target: 0.00781
Third target: 0.00813
Don't forget a simple principle: money management.
Place your stop-loss order below the support zone in green.
For any questions, please leave a comment.
Thank you.

#JASMY/USDT GOOD TIME TO BUY JASMY I MARK THE TARGETS#JASMY
The price is moving in a descending channel on the 1-hour timeframe. It has reached the lower boundary and is heading towards a breakout, with a retest of the upper boundary expected.
We are seeing a bearish trend in the Relative Strength Index (RSI), which has reached near the lower boundary, and an upward bounce is expected.
There is a key support zone in green at 0.00580. The price has bounced from this level several times and is expected to bounce again.
We are seeing a trend towards stabilizing above the 100-period moving average, which we are approaching, supporting the upward trend.
Entry Price: 0.00600
First Target: 0.00606
Second Target: 0.00619
Third Target: 0.00630
Remember a simple principle: Money Management.
Place your stop-loss order below the green support zone.
For any questions, please leave a comment.
Thank you.

JASMY/USDT — Approaching Demand Zone: Reversal or Capitulation?JASMY is entering one of its most decisive phases since 2022.
After forming a long series of lower highs, the price is now approaching the historical demand zone that previously triggered one of JASMY’s strongest reversals — the 0.004–0.003 region.
This yellow block isn’t just another support level:
It is the final major defense zone before the chart steps into a deeper, untouched territory not seen since the 2022–2023 accumulation period.
---
📉 Macro Structure: Descending Triangle Pressure Zone
The chart is developing a compressed descending triangle:
Descending trendline (yellow) = continuous selling pressure.
Horizontal demand zone 0.004–0.003 = the historical level that previously launched a major bullish move.
The triangle apex converges into 2026 = the point where markets typically decide direction.
Statistically, descending triangles lean bearish… unless the support base triggers a strong reversal — and price is heading directly into this decision level.
---
📈 Bullish Scenario — “Reversal Engine”
This is the scenario bulls have been waiting for:
1. Price taps 0.004–0.003, forming a long lower wick or strong rejection candle on the weekly timeframe.
2. A short-squeeze follows, as many stop-losses sit just below 0.003.
3. A bullish weekly close confirms the strength of the demand zone.
4. A breakout above the descending trendline signals a macro trend shift.
🎯 Potential upside targets after a confirmed breakout:
0.008–0.012 (major reaction zone)
Followed by 0.020+ if momentum continues
If this plays out, JASMY could replicate its 2023-style impulsive move after a long sideways accumulation period.
---
📉 Bearish Scenario — “Capitulation Wave”
If the 0.004–0.003 support fails, the chart opens the door to a deeper decline:
1. Weekly breakdown below 0.003 → support invalidation.
2. Increased sell volume indicates capitulation.
3. Price seeks the next liquidity zone near 0.0027 (historical low), possibly lower if panic selling accelerates.
This phase is painful — but ironically, it often forms the macro bottom before a new bullish cycle.
---
🧠 Why the 0.004–0.003 Zone Is So Critical
Previously acted as the launchpad for a large rally.
Hosted major accumulation during 2022–2023.
Acts as the market’s decision point — whether JASMY begins a new long-term trend or extends its macro downtrend.
In other words…
This is the level long-term investors are watching very closely.
---
> “The market is about to decide: can the 0.004–0.003 demand zone hold and spark a macro reversal, or will we see a final capitulation before a new cycle emerges?”
This is a critical moment for JASMY on the weekly timeframe.
#JASMY #JASMYUSDT #CryptoAnalysis #WeeklyChart
#DemandZone #TechnicalAnalysis #CryptoTrading
#Altcoins #DescendingTriangle #PriceAction

JASMY Waves 1 and 2 in place. Powerful 3rd wave up nextEverywhere we look at, JASMY has a textbook structure. First of all an ABC correction to bottom, then a beautiful wave 1, next a perfect wave 2. The chart shows a potential wave 3 in the making.
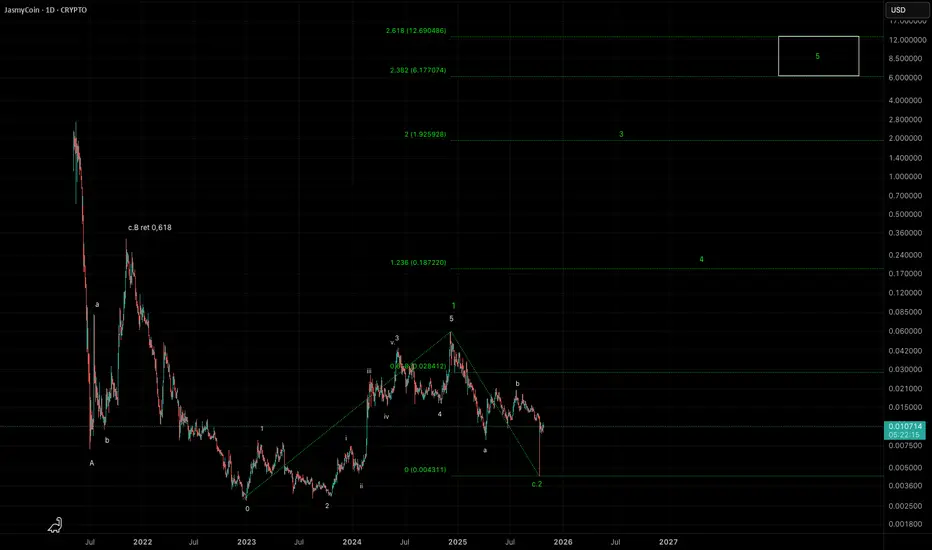
JASMY – new bull run incoming?The crypto market doesn’t actually look too bad after the leverage flush on October 10. JasmyCoin, a cryptocurrency hovering around the 100th spot in market capitalization rankings, may be starting a new upward sequence. The Elliott wave structures are textbook examples. Although not all exchanges saw a deep penetration of the 0.0040–0.0080 zone on October 10, the drop can still be considered a legitimate subwave C of wave 2. Good luck!
Coinbase chart for comparison:

#JASMY/USDT#JASMY
The price is moving within a descending channel on the 1-hour frame, adhering well to it, and is heading towards a strong breakout and retest.
We are experiencing a rebound from the lower boundary of the descending channel. This support is at 0.01480.
We are experiencing a downtrend on the RSI indicator, which is about to break and retest, supporting the upward trend.
We are in a trend of consolidation above the 100 moving average.
Entry price: 0.01530
First target: 0.01593
Second target: 0.01650
Third target: 0.01720

#JASMY/USDT GOOD TIME TO BUY JASMY I MARK THE TARGETS#JASMY
The price is moving within a descending channel on the 1-hour frame and is expected to break and continue upward.
We have a trend to stabilize above the 100 moving average once again.
We have a downtrend on the RSI indicator that supports the upward break.
We have a support area at the lower limit of the channel at 0.01213, acting as strong support from which the price can rebound.
We have a major support area in green that pushed the price upward at 0.01178.
Entry price: 0.01264.
First target: 0.01308.
Second target: 0.01367.
Third target: 0.01441.
To manage risk, don't forget stop loss and capital management.
When you reach the first target, save some profits and then change the stop order to an entry order.
For inquiries, please comment.
Thank you.

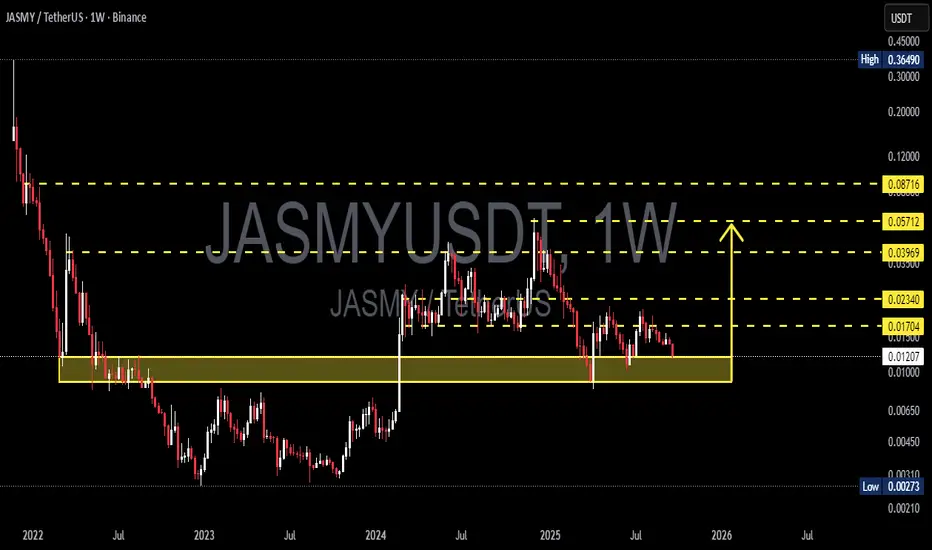
JASMY/USDT — Demand Zone: Bounce or Breakdown to Historical Low?Overview
The weekly chart of JASMY/USDT is currently at a crucial point. Price is sitting right inside the long-term demand zone around 0.010 – 0.013 USDT, which has repeatedly acted as a structural floor since 2022. This zone is the “last line of defense” before a potential move back toward the historical low at 0.0027 USDT.
At the same time, if buyers step in strongly, this area could once again serve as the launchpad for a major rebound, with multiple resistance levels above offering clear upside targets.
---
Structure & Pattern
1. Prolonged downtrend since 2021 → characterized by consistent lower highs and lower lows.
2. Strong demand zone (0.010 – 0.013) → historically a critical accumulation area.
3. Long-term consolidation → suggesting accumulation and positioning by larger players.
4. Repeated tests of demand → validates its importance, but the more it’s tested, the higher the risk of eventual breakdown.
---
Bullish Scenario
Trigger: A strong bullish weekly candle (rejection, pin bar, or engulfing) forming within the demand zone.
Confirmation: A weekly close above 0.01704 USDT → early signal that demand is holding.
Targets:
0.02340 (minor resistance),
0.03969 (mid-term resistance),
0.05712 – 0.08716 (major resistance and mid-term bullish targets).
Potential: A rebound from here could lead to impulsive moves, as has happened in previous tests of this same demand zone.
---
Bearish Scenario
Trigger: Weekly close below 0.010 USDT with strong selling volume.
Confirmation: Retest of the broken zone as resistance followed by rejection.
Target: Possible decline toward 0.0027 USDT (historical low).
Risk: A confirmed breakdown here could accelerate panic selling and extend the downtrend.
---
Sentiment & Market Psychology
This demand zone is closely monitored by traders → a bounce could trigger a strong short squeeze.
A breakdown, however, may spark capitulation among retail participants, while smart money positions itself at deeper discounts.
Since this is on the weekly timeframe, the outcome here could define JASMY’s direction for months ahead.
---
Strategy & Risk Management
Aggressive entry: Buy within 0.010–0.013, stop loss slightly below 0.010.
Conservative entry: Wait for a confirmed weekly close above 0.017.
Profit-taking: Scale out at each resistance target.
Risk control: Manage exposure carefully (1–2% per trade), avoid over-leveraging in such a decisive zone.
---
Conclusion
JASMY is at a make-or-break level.
Holding above 0.010–0.013 may trigger a rebound toward 0.017 → 0.023 → 0.087.
Failing to hold could send the market back to retest the historical low at 0.0027.
This zone will determine whether JASMY enters a new accumulation and recovery phase, or extends its multi-year downtrend. Traders should wait for weekly confirmations before committing to major positions.
---
#JASMY #JASMYUSDT #CryptoTA #AltcoinAnalysis #PriceAction #WeeklyChart #SupportResistance #DemandZone #CryptoTrading
Jasmy in accumulation phase. JASMY is consolidating and creating a potential order block. However, considering bullish momentum and bearish responses could result in a swing failure, giving us the perfect opportunity to hunt trendline liquidity. Acumulation is the plan.

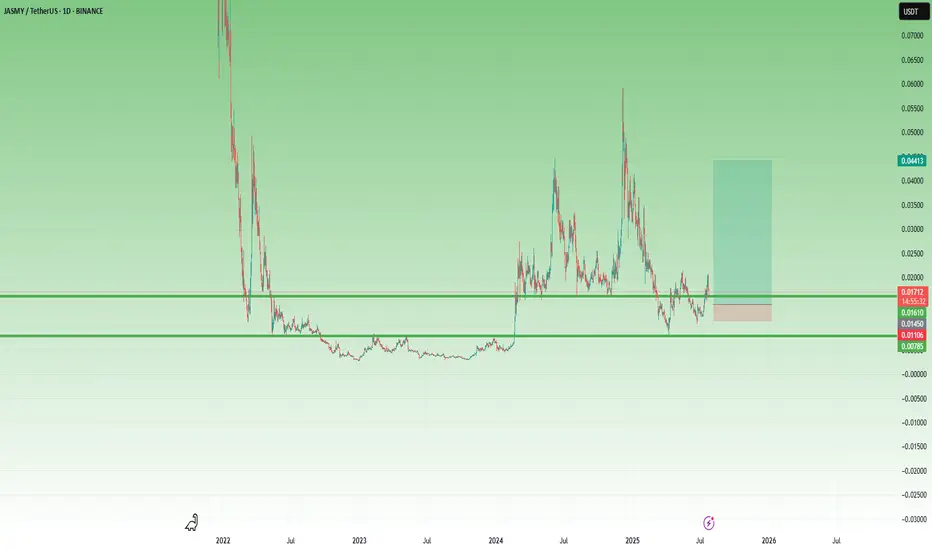
JASMY – A Volatile Setup with x3 Potential 🔸 After bottoming out at 0.003 and spending over a year in accumulation, JASMY finally broke above the key 0.008 resistance zone in February 2024. That breakout triggered a series of explosive moves – but just as violent were the drops that followed.
🔸 What stands out:
• The first post-breakout spike found a new support at 0.015.
• Then came a second vertical move toward 0.06, followed (of course) by a brutal drop.
• But… 0.008 held, and by late June, the chart printed a higher low, showing that buyers became interested.
📍 Right now, the price has reclaimed the 0.015 zone and is trying to stabilize above it. If this level holds, it could become the new base for the next wave.
💡 My plan?
This is very speculative, but I like the setup.
I’m looking to buy around 0.015–0.016, with clear negation below 0.010.
Target? Around 0.045, for a potential x3 move and a tasty 1:8 risk/reward.
⚠️ I’m not the guy who repeats the cliché “ only trade what you can afford to lose, ”
but seriously – this one is for clubbing money, not summer vacation money.
Let the volatility work in our favor. 🚀
Live trade hello friends👋
Considering the fall that we had, you can see that the buyers supported the price at the support point and caused it to grow. Now with the return of the price and the construction of an upward pattern, you can see that we can enter into the transaction with capital and risk management and move to the specified goals with it.💰
🔥Join us for more signals🔥
*Trade safely with us*

Will #JASMY Retest Trigger a Rebound or a Breakdown? Key LevelsYello Paradisers! Have you prepared yourself for what’s about to unfold with #JASMYUSDT? The #JasmyCoin setup is showing signs of a major move:
💎#JASMYUSD has just completed an impulsive move from the Major Demand Zone around 0.01509 and is currently retesting the ascending support after breaking down from the short-term channel. This is the critical moment where disciplined traders prepare their next move, not after the bounce, but before it.
💎What we’re seeing now is a textbook retest of the ascending support, after an aggressive move from the major demand zone. The price is currently hovering just above the 0.01742 support level, a critical area that aligns with the high-volume node from the visible range volume Profile (VRVP), making this a high-probability reaction zone.
💎If the #JASMY price holds here, and we start seeing buyer strength reclaim the broken ascending channel, this could trigger a sharp bounce targeting the mid-term resistance at 0.02221. Above that, the next magnet will be the major resistance sitting around 0.02512, a level likely to attract profit-taking or even large-scale short entries from smart money.
💎However, failure to hold this support and a confirmed breakdown below the 0.01509 zone would invalidate the bullish structure entirely. In that case, we would be looking for a possible bearish continuation, driving the price toward 0.01400 and possibly lower, where more liquidity pockets remain untapped. That move would also trap late long entries and clean out weak hands — the exact kind of shakeout we warn about.
Play it safe, respect the structure, and let the market come to you!
MyCryptoParadise
iFeel the success🌴

Is JASMY Ready for a Massive Comeback? Key Levels to Watch!Yello, Paradisers! After months of relentless selling, could #JASMY finally be staging a comeback? Let's dive into its key technicals:
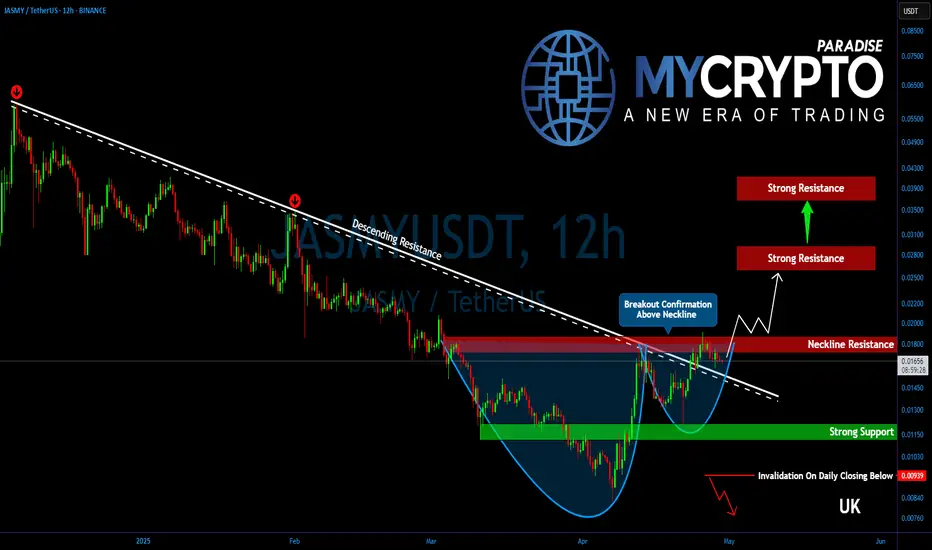
💎After an extended and painful downtrend, JASMY has finally broken out of its multi-month descending trendline resistance. This significant technical breakout marks the first step toward a potential broader recovery. Moreover, the price action is shaping a potential cup and handle formation—a powerful bullish continuation pattern—which strongly suggests that the recovery momentum still has further room to run.
💎At the moment, #JASMYUSDT is battling a crucial resistance zone between $0.01750 and $0.01850. This area serves as the neckline resistance of the developing bullish structure. A clean and convincing breakout above this zone would trigger a major shift in momentum, potentially setting up JASMY for a back-to-back bullish breakout.
💎Should bulls succeed in pushing above this resistance, the next immediate target lies at $0.02500 to $0.02750—a heavy supply zone that coincides perfectly with the 50% Fibonacci retracement. This level is expected to attract some strong profit-taking.
💎However, if bullish strength continues to hold firm even after that, JASMY could extend its rally toward the 61.8% Fibonacci retracement zone, located around $0.03650 to $0.04000. This region is historically known to be a "golden pocket" for reversals and thus demands maximum caution. If signs of exhaustion emerge near this zone, it could potentially mark a medium-term top.
💎JASMY’s first primary support now sits at $0.01500. Below that, a firmer, more critical support base exists between $0.01150 and $0.01100—a zone that has already proven capable of withstanding strong selling pressure in the past.
Paradisers, strive for consistency, not quick profits. Treat the market as a businessman, not as a gambler.
MyCryptoParadise
iFeel the success🌴
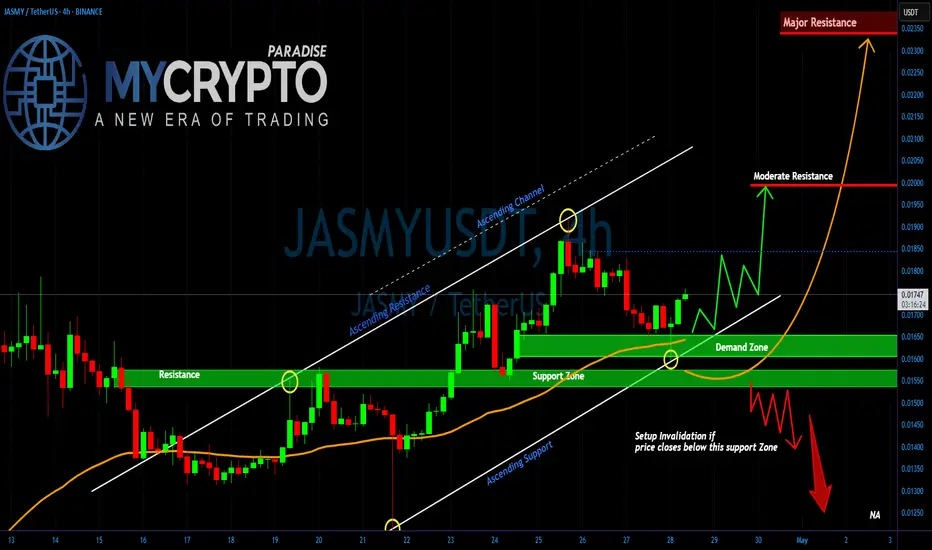
JASMY at a Breaking PointYello, Paradisers! Have you been watching JASMY closely? If not, you might be about to miss one of the most explosive opportunities we've seen in recent days. A major breakout or breakdown is brewing, and the market is preparing for a decisive move!
💎Right now, #JASMYUSDT is sitting above a critical Demand Zone after successfully flipping a strong historical resistance into support. Price action is following an ascending structure, respecting both the Ascending Support and the broader Ascending Channel pattern. As long as the price continues to hold this support region and maintain the bullish market structure, there is a high probability of a breakout towards the Moderate Resistance level around 0.01994. A clean break above this area could fuel a sharp rally straight towards the Major Resistance zone at 0.02337.
💎However, caution is absolutely necessary here. If JASMY fails to hold the current Demand Zone and we see a confirmed close below the support at 0.01540 level, it would invalidate the bullish setup. In that case, a rapid sell-off is likely, with downside targets opening towards the 0.01397 region and possibly even lower levels. This would create a high-risk environment where inexperienced traders could get trapped very quickly.
Stay focused, Paradisers. Be the hunter, not the hunted.
MyCryptoParadise
iFeel the success🌴
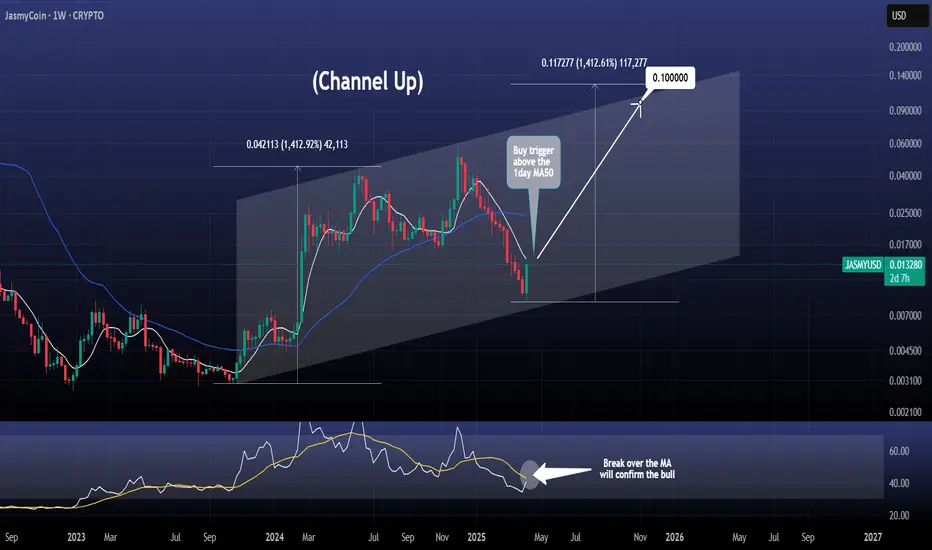
JASMY aiming at $0.10 after this break out!JasmyCoin / JASMYUSD is posting a massive green 1week candle, the strongest one since the December 2nd 2024 that formed the high of this Cycle so far.
This is also the bottom of the Channel Up and a crossing over the 1day MA50 (white line) will be the buy trigger.
Additional indicator to look for is the 1week RSI, giving a buy confirmation over its MA.
Target 0.1000 (+1400%).
Follow us, like the idea and leave a comment below!!
JASMY/USDT: Bullish Breakout and Long OpportunityHello fellow traders,
I've spotted a promising long opportunity on JASMY/USDT that I wanted to share with you.
Here's the setup:
Breakout Confirmation: JASMY has successfully broken out of a descending channel, indicating a potential shift in momentum.
Retracement and Readiness: Following the breakout, the price has retraced, suggesting it's now poised for an upward move.
Target: My target for this trade is the $0.01250 level, which conveniently aligns with the 200-period moving average on the 4-hour timeframe.
Here's my proposed trade plan:
Entry: I'm looking to enter the trade once the price moves above $0.01060.
Stop Loss: To manage risk, I've set my stop loss around $0.00970.
Remember, this is just my analysis, and trading always carries risk. Please do your own due diligence before making any trading decisions.
Wishing you all profitable trades!

#JASMY/USDT#JASMY
The price is moving within a descending channel on the 1-hour frame, adhering well to it, and is on its way to breaking it strongly upwards and retesting it.
We are seeing a bounce from the lower boundary of the descending channel, this support at 0.1233.
We have a downtrend on the RSI indicator that is about to break and retest, supporting the upward trend.
We are looking for stability above the 100 moving average.
Entry price: 0.01279
First target: 0.01300
Second target: 0.01327
Third target: 0.01360

(JASMY) jasmycoinDGT pattern indicator featuring elliott waves. Green diamond is major oversold, green triangles is minor oversold, same for peaks only circles and so on. I'm seeing a lot of oversold signals in cryptocurrency using this indicator, including Ethereum, the blockchain Jasmy is run on as a layer 2 token IoT company.

(JASMY) JASMY "that sux"Jasmy losing like there is no tomorrow. The Elliott Wave prospects of Jasmy seem to have fallen through. The December price was what I wanted to believe was a peak of Elliott Wave patterns with two more to follow only slightly lower but this prolonged down angle on the chart is a bummer.
