JASMY/USDT — Approaching Demand Zone: Reversal or Capitulation?JASMY is entering one of its most decisive phases since 2022.
After forming a long series of lower highs, the price is now approaching the historical demand zone that previously triggered one of JASMY’s strongest reversals — the 0.004–0.003 region.
This yellow block isn’t just another support level:
It is the final major defense zone before the chart steps into a deeper, untouched territory not seen since the 2022–2023 accumulation period.
---
📉 Macro Structure: Descending Triangle Pressure Zone
The chart is developing a compressed descending triangle:
Descending trendline (yellow) = continuous selling pressure.
Horizontal demand zone 0.004–0.003 = the historical level that previously launched a major bullish move.
The triangle apex converges into 2026 = the point where markets typically decide direction.
Statistically, descending triangles lean bearish… unless the support base triggers a strong reversal — and price is heading directly into this decision level.
---
📈 Bullish Scenario — “Reversal Engine”
This is the scenario bulls have been waiting for:
1. Price taps 0.004–0.003, forming a long lower wick or strong rejection candle on the weekly timeframe.
2. A short-squeeze follows, as many stop-losses sit just below 0.003.
3. A bullish weekly close confirms the strength of the demand zone.
4. A breakout above the descending trendline signals a macro trend shift.
🎯 Potential upside targets after a confirmed breakout:
0.008–0.012 (major reaction zone)
Followed by 0.020+ if momentum continues
If this plays out, JASMY could replicate its 2023-style impulsive move after a long sideways accumulation period.
---
📉 Bearish Scenario — “Capitulation Wave”
If the 0.004–0.003 support fails, the chart opens the door to a deeper decline:
1. Weekly breakdown below 0.003 → support invalidation.
2. Increased sell volume indicates capitulation.
3. Price seeks the next liquidity zone near 0.0027 (historical low), possibly lower if panic selling accelerates.
This phase is painful — but ironically, it often forms the macro bottom before a new bullish cycle.
---
🧠 Why the 0.004–0.003 Zone Is So Critical
Previously acted as the launchpad for a large rally.
Hosted major accumulation during 2022–2023.
Acts as the market’s decision point — whether JASMY begins a new long-term trend or extends its macro downtrend.
In other words…
This is the level long-term investors are watching very closely.
---
> “The market is about to decide: can the 0.004–0.003 demand zone hold and spark a macro reversal, or will we see a final capitulation before a new cycle emerges?”
This is a critical moment for JASMY on the weekly timeframe.
#JASMY #JASMYUSDT #CryptoAnalysis #WeeklyChart
#DemandZone #TechnicalAnalysis #CryptoTrading
#Altcoins #DescendingTriangle #PriceAction
JASMYUSDC

JASMY/USDT — Demand Zone: Bounce or Breakdown to Historical Low?Overview
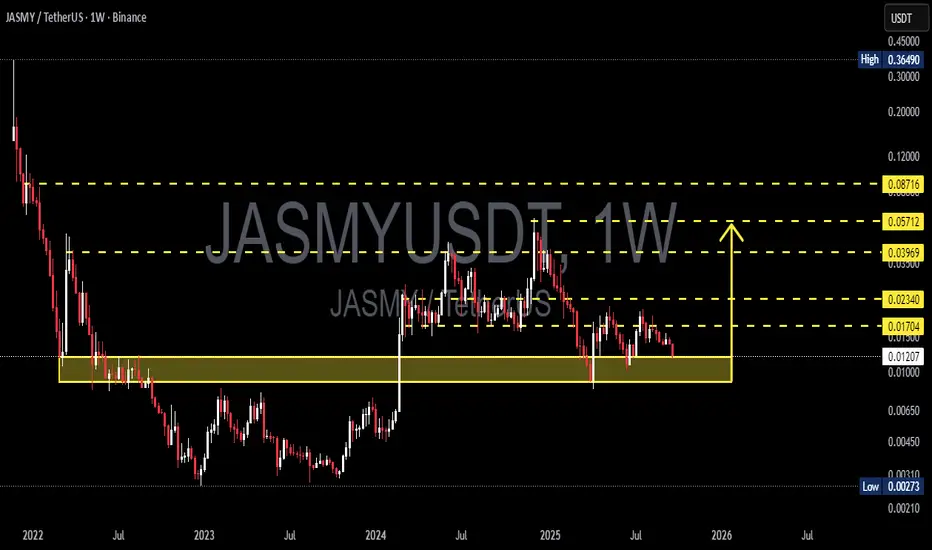
The weekly chart of JASMY/USDT is currently at a crucial point. Price is sitting right inside the long-term demand zone around 0.010 – 0.013 USDT, which has repeatedly acted as a structural floor since 2022. This zone is the “last line of defense” before a potential move back toward the historical low at 0.0027 USDT.
At the same time, if buyers step in strongly, this area could once again serve as the launchpad for a major rebound, with multiple resistance levels above offering clear upside targets.
---
Structure & Pattern
1. Prolonged downtrend since 2021 → characterized by consistent lower highs and lower lows.
2. Strong demand zone (0.010 – 0.013) → historically a critical accumulation area.
3. Long-term consolidation → suggesting accumulation and positioning by larger players.
4. Repeated tests of demand → validates its importance, but the more it’s tested, the higher the risk of eventual breakdown.
---
Bullish Scenario
Trigger: A strong bullish weekly candle (rejection, pin bar, or engulfing) forming within the demand zone.
Confirmation: A weekly close above 0.01704 USDT → early signal that demand is holding.
Targets:
0.02340 (minor resistance),
0.03969 (mid-term resistance),
0.05712 – 0.08716 (major resistance and mid-term bullish targets).
Potential: A rebound from here could lead to impulsive moves, as has happened in previous tests of this same demand zone.
---
Bearish Scenario
Trigger: Weekly close below 0.010 USDT with strong selling volume.
Confirmation: Retest of the broken zone as resistance followed by rejection.
Target: Possible decline toward 0.0027 USDT (historical low).
Risk: A confirmed breakdown here could accelerate panic selling and extend the downtrend.
---
Sentiment & Market Psychology
This demand zone is closely monitored by traders → a bounce could trigger a strong short squeeze.
A breakdown, however, may spark capitulation among retail participants, while smart money positions itself at deeper discounts.
Since this is on the weekly timeframe, the outcome here could define JASMY’s direction for months ahead.
---
Strategy & Risk Management
Aggressive entry: Buy within 0.010–0.013, stop loss slightly below 0.010.
Conservative entry: Wait for a confirmed weekly close above 0.017.
Profit-taking: Scale out at each resistance target.
Risk control: Manage exposure carefully (1–2% per trade), avoid over-leveraging in such a decisive zone.
---
Conclusion
JASMY is at a make-or-break level.
Holding above 0.010–0.013 may trigger a rebound toward 0.017 → 0.023 → 0.087.
Failing to hold could send the market back to retest the historical low at 0.0027.
This zone will determine whether JASMY enters a new accumulation and recovery phase, or extends its multi-year downtrend. Traders should wait for weekly confirmations before committing to major positions.
---
#JASMY #JASMYUSDT #CryptoTA #AltcoinAnalysis #PriceAction #WeeklyChart #SupportResistance #DemandZone #CryptoTrading

JASMYUSDT Ready to Explode? JASMYUSDT Technical analysis update
BINANCE:JASMYUSDT is moving towards the cup and handle neckline resistance, preparing for a breakout. The price has been forming the cup and handle pattern for the last 1,000 days. Once the price breaks above the neckline on the weekly chart, we can expect a significant bullish move, potentially 200% to 600% move possible in JASMY. This breakout could mark the beginning of a strong upward trend.

My $10,000 Portfolio is now live. Here we go!Traders,
The time has come. My first trades for my public-facing portfolio have been triggered. I will cover the first trade in this video and why I entered it as well as overall market analysis. To receive ALL of my trade alerts you'll need to (against house rules). All trade alerts will go out to everyone until I can prove success.
Best to you all!
- Stew
