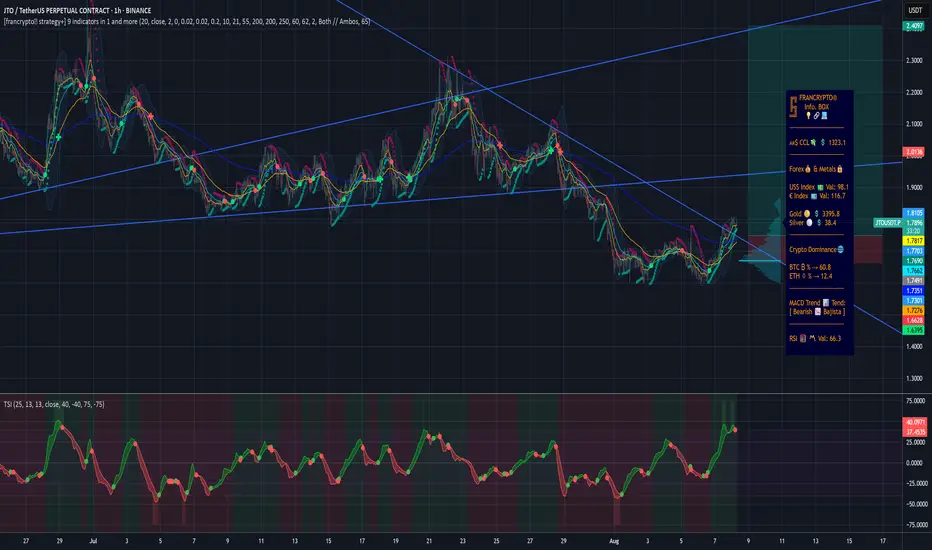
JTO Buy/Long Signal (4H)JTO is currently at key levels and we have a bullish CH on the chart. Above the current price the CP move appears as a spike which indicates there is no significant resistance.
On pullbacks to the support zones we can look for buy or long positions.
The targets are marked on the chart. Take partial profit at the first target and move the stop loss to breakeven.
Do not enter the position without capital management and stop setting
Comment if you have any questions
thank you
JTOUSD

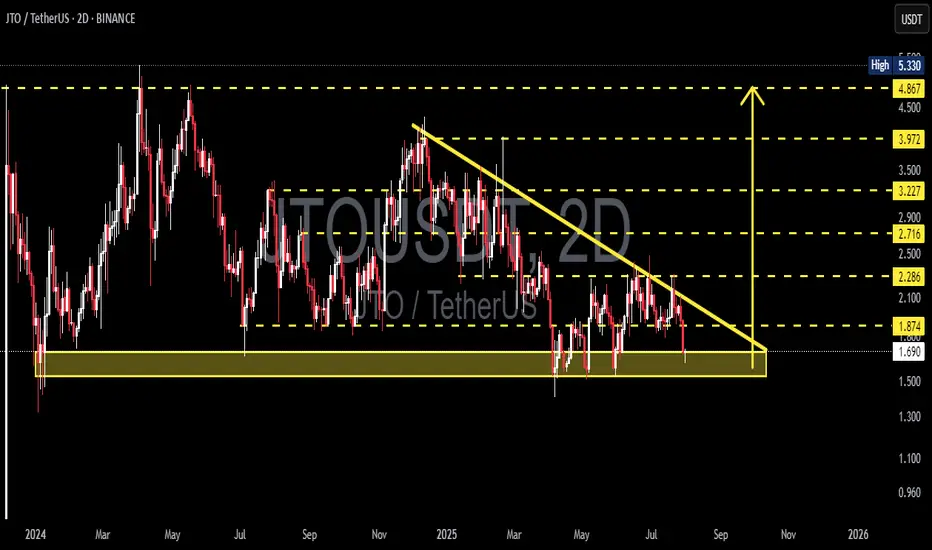
JTO/USDT — Decisive Moment Between Major Rebound or Breakdown?JTO is currently retesting its key support zone at 1.60–1.40, an area that has acted as a strong foundation since early 2024.
Each touch of this zone has triggered notable buying reactions — signaling institutional accumulation, even as the broader trend remains under bearish pressure.
Now, the market stands at a critical crossroad.
Volume is fading, volatility is tightening, and price is compressing within the support zone — a classic setup before a large directional move.
---
🔹 Bullish Scenario — Reversal from the Accumulation Zone
If the price can hold above 1.60–1.40 and break through the key resistance at 1.874, it could trigger a mid-term bullish reversal.
Potential upside targets include:
Target 1: 2.286
Target 2: 2.716
Extended targets: 3.227 – 3.972
Such movement would confirm the formation of a double-bottom accumulation base, often seen before a strong upward recovery.
---
🔻 Bearish Scenario — Breakdown Continuation
On the other hand, if the price closes a 2D candle below 1.40, it would invalidate the accumulation structure and signal continuation of the broader downtrend.
In this case, the next potential downside targets lie at 1.20 – 1.00, marking the next psychological and technical demand zones.
---
📊 Technical Structure & Market Dynamics
The lower-highs formation remains intact, reflecting sustained medium-term bearish pressure.
However, repeated long wicks below the yellow zone suggest liquidity sweeps — typical signs of smart-money accumulation before a rebound.
The 1.60–1.40 zone now acts as the main battleground between long-term buyers and short-term sellers.
---
⚖️ Conclusion
> JTO is at a decisive inflection point.
Holding above 1.60–1.40 could spark a major rebound.
Breaking below 1.40 could confirm another leg down toward 1.20–1.00.
When volatility compresses and the market looks quiet — that’s often when the next big move begins.
---
#JTO #CryptoAnalysis #Altcoin #TechnicalAnalysis #PriceAction #ReversalZone #CryptoMarket #SupportResistance #SwingTrade

JTO/USDT — Ready Strong Rebound or a Major Breakdown?📊 Full Analysis
1. Current Market Outlook
JTO/USDT is now trading right inside the key demand zone (1.50–1.62), which has acted as a major support level since early 2024.
Every retest of this zone has historically triggered a strong bounce, showing institutional buying interest around this area.
However, repeated retests without significant breakouts are gradually weakening the support strength, making this level a true battleground for Bulls vs Bears.
---
2. Structure & Pattern
Range Market: Since March 2025, JTO has been consolidating between 1.62–2.29, forming a clear sideways range.
Lower Highs: Since late 2024, price has been forming lower peaks → a sign of continued selling pressure.
Liquidity Sweep: The latest candle wicked below support before quickly bouncing back → a possible stop-hunt/liquidity grab.
Demand Zone (Golden Box): 1.50–1.62 is the Decision Point that will determine whether JTO rebounds or breaks down.
---
3. Key Technical Levels
Critical Support: 1.62 – 1.50
Minor Resistance: 1.874
Major Resistance: 2.286 (range top)
Bullish Targets: 2.716 → 3.227 → 3.972 → 4.867
Bearish Targets: 1.30 → 1.00 → 0.95 (measured move projection)
---
4. Bullish Scenario (Rebound from Demand Zone)
✅ Aggressive Entry: Buy inside the demand zone 1.50–1.62 with strong rejection candle (hammer / bullish engulfing).
✅ Conservative Entry: Wait for breakout and close above 2.286, then enter on retest confirmation.
🎯 Upside Targets:
Step 1: 1.874 → 2.286
Step 2: 2.716 → 3.227 → 3.972
Step 3: 4.867 if momentum continues.
⚠️ Invalidation: Daily/2D close below 1.50.
---
5. Bearish Scenario (Breakdown of Demand Zone)
❌ Trigger: Daily/2D close below 1.50 with strong selling volume.
🎯 Downside Targets:
First: 1.30 (minor support)
Second: 1.00 (psychological round number)
Third: 0.95 (measured move target from range).
⚠️ Conclusion: If this zone fails, JTO risks entering a capitulation phase toward sub-$1 levels.
---
6. Market Narrative & Psychology
For Bulls, the 1.50–1.62 zone is the last stronghold — holding this zone could form a double bottom and fuel a large reversal.
For Bears, a clean breakdown of this zone would open a free fall toward $1 and below.
In short, this is the make-or-break level for JTO, where the next big move will be decided.
---
📌 Conclusion
As long as JTO holds above 1.50, upside targets toward 2.286 → 3.227 remain possible.
If 1.50 breaks, expect a potential drop to 1.00 or even 0.95.
Watch for 2D/daily candle close confirmation to validate the next major direction.
---
JTO/USDT (2D) is now testing its multi-month demand zone at 1.50–1.62.
This is the critical “Decision Point” for the market:
Bullish: Rejection + breakout above 2.286 → targets 2.716 – 3.227 – 3.972 – 4.867.
Bearish: Breakdown below 1.50 → downside targets 1.30 – 1.00 – 0.95.
This zone will decide whether JTO forms a double bottom reversal or enters a bearish capitulation.
Not financial advice — for educational purposes only.
---
#JTO #JTOUSDT #CryptoAnalysis #DemandZone #SupportResistance #CryptoTrading #SwingTrade #Breakout #BearishScenario #BullishScenario

Bullish on JTOUSDTHere we have a very nice setup: JTO finished the big retrace and is now trying breaking the downward trend. On successfull breakout JTO will pump on top of the old upward channel. Volumes are coming, right now we are over all EMAs and very bullish. Best entry would be 1.75$-1.65$ (if JTO comes down again...).
For more trade ideas check and insights check our profile.
Disclamer: only entertaining purpose, no financial advice - trading is risky.
JTO/USDT at the Edge of Pressure – Breakout or Breakdown Ahead?🧠 Detailed Technical Analysis (2D Timeframe):
JTO/USDT is currently consolidating at a critical support zone within a well-defined Descending Triangle pattern that has been forming for over 6 months.
Key observations:
Price has been making lower highs, forming a downward-sloping resistance trendline.
Meanwhile, strong buying interest has held up the support zone between $1.69 and $1.87, suggesting accumulation.
This creates a classic Descending Triangle, often leading to a sharp breakout or breakdown.
---
📌 Key Levels:
Level Description
$1.69–$1.87 Major Demand Zone / Key Support
Descending Trendline Dynamic Resistance (from Lower Highs)
$2.29 First Resistance (Breakout Trigger)
$2.71 Key Mid-Term Resistance
$3.22 – $3.97 Major Upside Targets
$1.50 & $1.30 Breakdown Targets
---
📈 Bullish Scenario (Breakout):
If the price holds the support and successfully breaks the descending trendline, we could see a strong bullish reversal:
Confirmation breakout may lead to a rally toward $2.29 → $2.71 → $3.22 → up to $3.97.
Breakout strength increases if accompanied by volume surge.
Bullish Catalysts:
Positive project fundamentals.
Volume squeeze near triangle apex.
RSI/MACD divergence (if present).
---
📉 Bearish Scenario (Breakdown):
If price closes below the $1.69 zone with conviction:
Descending triangle confirms as a bearish continuation.
Target downside to $1.50 and potentially $1.30.
Could signal distribution phase by larger players.
Bearish Confirmation: Strong 2D candle close below $1.69 with high volume.
---
🧩 Pattern Breakdown – Descending Triangle:
The pattern represents price compression between lower highs and a horizontal support.
Statistically, 70% of descending triangles resolve to the downside.
However, in oversold conditions or with bullish catalysts, it may lead to a powerful short squeeze breakout.
---
🧭 Summary & Strategy Insight:
JTO/USDT is nearing a decision point. At the edge of the triangle’s apex, volatility is likely to spike — with a strong move in either direction.
💡Possible Strategy:
Conservative entry: Wait for breakout confirmation above the trendline with volume.
Aggressive entry: Speculative buy near $1.70 with tight stop loss.
Avoid heavy positions until the breakout or breakdown confirms.
---
🧲 Suggested Post Title:
> "JTO/USDT at a Crossroads – Descending Triangle Set for Explosive Move?"
A breakout is imminent. Will you be ready?
#JTOUSDT #CryptoBreakout #DescendingTriangle #AltcoinSetup #TechnicalAnalysis #CryptoStrategy #ChartPatterns
#JTO/USDT#JTO
The price is moving within a descending channel on the 1-hour frame and is expected to break and continue upward.
We have a trend to stabilize above the 100 moving average once again.
We have a downtrend on the RSI indicator that supports the upward move with a breakout.
We have a support area at the lower boundary of the channel at 1.84, acting as strong support from which the price can rebound.
We have a major support area in green that pushed the price higher at 1.88.
Entry price: 1.96.
First target: 2.00.
Second target: 2.12.
Third target: 2.22.
To manage risk, don't forget stop loss and capital management.
When you reach the first target, save some profits and then change your stop order to an entry order.
For inquiries, please comment.
Thank you.

#JTO/USDT Forming Bullish Wave #JTO
The price is moving within a descending channel on the 1-hour frame, adhering well to it, and is on its way to breaking it strongly upwards and retesting it.
We have a bounce from the lower boundary of the descending channel. This support is at 1.73.
We have a downtrend on the RSI indicator that is about to be broken and retested, supporting the upside.
There is a major support area in green at 1.65, which represents a strong basis for the upside.
Don't forget a simple thing: ease and capital.
When you reach the first target, save some money and then change your stop-loss order to an entry order.
For inquiries, please leave a comment.
We have a trend to hold above the 100 Moving Average.
Entry price: 1.92.
First target: 2.046.
Second target: 2.15.
Third target: 2.28.
Don't forget a simple thing: ease and capital.
When you reach the first target, save some money and then change your stop-loss order to an entry order.
For inquiries, please leave a comment.
Thank you.
#JTO/USDT#JTO
The price is moving within a descending channel on the 1-hour frame, adhering well to it, and is heading toward a strong breakout and retest.
We are experiencing a rebound from the lower boundary of the descending channel, which is support at 2.08.
We are experiencing a downtrend on the RSI indicator that is about to be broken and retested, supporting the upward trend.
We are heading toward stability above the 100 Moving Average.
Entry price: 2.136
First target: 2.22
Second target: 2.32
Third target: 2.40

JTO : Price at a critical point: Falling or rising?Hello friends
Given the long-term range that this currency has made, the price has now reached the bottom of the range, which is very sensitive, and this currency also has a token release, which can be a warning.
In case of a drop, we have identified important supports for you, so that you can buy with risk and capital management.
*Trade safely with us*

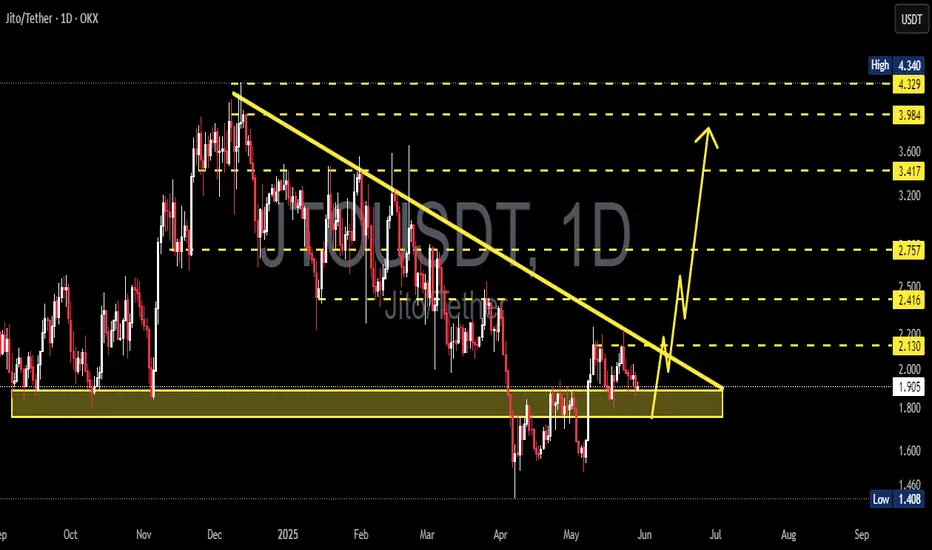
JTOUSDT Approaches Falling Wedge Breakout – Bullish Reversal?The chart indicates a major descending trendline resistance that has been tested multiple times since December 2024. Price action shows strong compression toward this resistance, suggesting a possible breakout moment.
🔄 Pattern Analysis: Falling Wedge
A Falling Wedge pattern is clearly visible:
This pattern typically signifies bullish reversal potential when formed in a downtrend.
Volume generally declines during the pattern and expands on the breakout.
The wedge begins around $3.97 and narrows down toward $2.18, where the current price action sits.
✅ Bullish Scenario:
If price breaks above the wedge resistance convincingly:
Breakout Confirmation Level: Around $2.42 (above the trendline and horizontal resistance)
Targets after breakout:
🎯 $2.73 – First major resistance
🎯 $3.39 – Mid-level resistance from previous structure
🎯 $3.97 – Key horizontal resistance and final wedge origin
🚀 Potential extension to $4.34 (previous swing high)
This would indicate a strong bullish trend resumption, especially if accompanied by high volume.
❌ Bearish Scenario:
If price fails to break above the wedge:
Possible rejection at $2.42, leading to:
🔻 Retest of support at $2.18
🔻 Further decline toward $1.40, the significant previous low
A breakdown below $2.18 would invalidate the wedge breakout and confirm bearish continuation.
⚠️ Key Technical Levels:
Support Zones: $2.18 – $1.40
Resistance Zones: $2.42 – $2.73 – $3.39 – $3.97 – $4.34
Pattern: Falling Wedge (Bullish Bias)
📌 Conclusion:
JTO/USDT is approaching a make-or-break zone. A successful breakout from the wedge could trigger a strong bullish rally, while failure may lead to further downside. Traders should monitor for volume confirmation on the breakout to validate direction.
#JTOUSDT #CryptoBreakout #FallingWedge #AltcoinAnalysis #CryptoTrading #BullishSetup #TechnicalAnalysis #ChartPattern #CryptoSignals

#JTO/USDT#JTO
The price is moving within a descending channel on the 1-hour frame and is expected to break and continue upward.
We have a trend to stabilize above the 100 moving average once again.
We have a downtrend on the RSI indicator that supports the upward move with a breakout.
We have a support area at the lower limit of the channel at 1.95, acting as strong support from which the price can rebound.
Entry price: 2.00
First target: 2.057
Second target: 2.11
Third target: 2.19

Can JTO pull a BNB All-Time-High Move??BNB made a similar pattern that led to it's previous ATH.
Since we are still waiting on the new ETH a time highs, followed by altseason, we can expect to see altcoins beginning to increase when ETH trades sideways. More on that here :
We can also expect to see rallies across other altcoins:
and
But before we see a glorious altseason, ETH needs to start moving to the upside as a starting point.
_______________
BINANCE:JTOUSDT
BINANCE:BNBUSDT

JTOUSDT 1D AnalysisJTO ~ 1D Analysis
#JTO Buy gradually from here if you still have confidence in this coin with a short term target of at least 15%+ from here.
JTO Buy/Long Setup (1D)It appears that JTO is in a bearish pattern on the higher timeframe, but it shows a bullish structure on the lower timeframes and could move to the upside.
The trigger line has been broken, and we have a bullish CH (Change of Character) on the chart.
We are looking for buy/long positions around the SWAP zone.
A daily candle closing below the invalidation level would invalidate this outlook.
For risk management, please don't forget stop loss and capital management
When we reach the first target, save some profit and then change the stop to entry
Comment if you have any questions
Thank You

#JTO/USDT#JTO
The price is moving within a descending channel on the 1-hour frame, adhering well to it, and is heading for a strong breakout and retest.
We are seeing a bounce from the lower boundary of the descending channel, which is support at 1.57.
We have a downtrend on the RSI indicator that is about to break and retest, supporting the upward trend.
We are looking for stability above the 100 moving average.
Entry price: 1.60
First target: 1.64
Second target: 1.70
Third target: 1.76

JTOUSDT 3DJTO ~ 3D Analysis
#JTO Key support that must be maintained. This loss of support will bring even lower prices.

JTOUSD - Symmetrical TriangleA large symmetrical triangle on this daily timeframe
These tend to break out bullishly, being a bullish pattern
Bullish on this Daily

JTO analysis (12H)It is one of the altcoins that does not have a clean chart but has a defined range for Sell and Buy.
The larger pattern on the chart appears to be a Diametric, and the price now seems to have entered wave F of this pattern.
In the red-circled area, we are looking for sell/short setups, while in the green zone, we are looking for buy/long positions.
For risk management, please don't forget stop loss and capital management
Comment if you have any questions
Thank You

#JTO/USDT#JTO
The price is moving in a descending channel on the 1-hour frame and is adhering to it well and is heading to break it strongly upwards and retest it
We have a bounce from the lower limit of the descending channel, this support is at a price of 2.45
We have a downtrend on the RSI indicator that is about to break and retest, which supports the rise
We have a trend to stabilize above the moving average 100
Entry price 2.67
First target 2.78
Second target 3.18
Third target 3.5

#JTO/USDT#JTO
The price is moving in a descending channel on the 1-hour frame and is expected to continue upwards
We have a trend to stabilize above the moving average 100 again
We have a descending trend on the RSI indicator that supports the rise by breaking it upwards
We have a support area at the lower limit of the channel at a price of 2.20
Entry price 2.48
First target 2.62
Second target 2.80
Third target 2.98

JTOUSDT 2DJTO ~ 2D Analysis
#JTO If you still have a Conviction on this coin,. This is a very good support for now, the target of at least 15%+.

JTOUSDT 2DJTO ~ 2D
#JTO If you still have Conviction on this coin,. Buy gradually after break out of this descending channel with a target of at least 20%++

JTO | ALTCOINS | Mixed Signals in BEARs vs BULLsJTO was a hot topic when it was first released and there was a hype surrounding it, like many newly released altcoins (got to get that marketing right 😉)
However, it's been trading very "wicky" over the past few weeks, and the price seems indecisive as a pennant pattern forms. This could play out two ways, and it's likely that the next week will give clearer directions.
I'm largely watching Ethereum, King of the Alts, to make a move before expecting more upside on smaller cap altcoins.
_______________
BINANCE:JTOUSDT
