JTO/USDT — Decisive Moment Between Major Rebound or Breakdown?JTO is currently retesting its key support zone at 1.60–1.40, an area that has acted as a strong foundation since early 2024.
Each touch of this zone has triggered notable buying reactions — signaling institutional accumulation, even as the broader trend remains under bearish pressure.
Now, the market stands at a critical crossroad.
Volume is fading, volatility is tightening, and price is compressing within the support zone — a classic setup before a large directional move.
---
🔹 Bullish Scenario — Reversal from the Accumulation Zone
If the price can hold above 1.60–1.40 and break through the key resistance at 1.874, it could trigger a mid-term bullish reversal.
Potential upside targets include:
Target 1: 2.286
Target 2: 2.716
Extended targets: 3.227 – 3.972
Such movement would confirm the formation of a double-bottom accumulation base, often seen before a strong upward recovery.
---
🔻 Bearish Scenario — Breakdown Continuation
On the other hand, if the price closes a 2D candle below 1.40, it would invalidate the accumulation structure and signal continuation of the broader downtrend.
In this case, the next potential downside targets lie at 1.20 – 1.00, marking the next psychological and technical demand zones.
---
📊 Technical Structure & Market Dynamics
The lower-highs formation remains intact, reflecting sustained medium-term bearish pressure.
However, repeated long wicks below the yellow zone suggest liquidity sweeps — typical signs of smart-money accumulation before a rebound.
The 1.60–1.40 zone now acts as the main battleground between long-term buyers and short-term sellers.
---
⚖️ Conclusion
> JTO is at a decisive inflection point.
Holding above 1.60–1.40 could spark a major rebound.
Breaking below 1.40 could confirm another leg down toward 1.20–1.00.
When volatility compresses and the market looks quiet — that’s often when the next big move begins.
---
#JTO #CryptoAnalysis #Altcoin #TechnicalAnalysis #PriceAction #ReversalZone #CryptoMarket #SupportResistance #SwingTrade
JTOUSDC

JTO/USDT — Ready Strong Rebound or a Major Breakdown?📊 Full Analysis
1. Current Market Outlook
JTO/USDT is now trading right inside the key demand zone (1.50–1.62), which has acted as a major support level since early 2024.
Every retest of this zone has historically triggered a strong bounce, showing institutional buying interest around this area.
However, repeated retests without significant breakouts are gradually weakening the support strength, making this level a true battleground for Bulls vs Bears.
---
2. Structure & Pattern
Range Market: Since March 2025, JTO has been consolidating between 1.62–2.29, forming a clear sideways range.
Lower Highs: Since late 2024, price has been forming lower peaks → a sign of continued selling pressure.
Liquidity Sweep: The latest candle wicked below support before quickly bouncing back → a possible stop-hunt/liquidity grab.
Demand Zone (Golden Box): 1.50–1.62 is the Decision Point that will determine whether JTO rebounds or breaks down.
---
3. Key Technical Levels
Critical Support: 1.62 – 1.50
Minor Resistance: 1.874
Major Resistance: 2.286 (range top)
Bullish Targets: 2.716 → 3.227 → 3.972 → 4.867
Bearish Targets: 1.30 → 1.00 → 0.95 (measured move projection)
---
4. Bullish Scenario (Rebound from Demand Zone)
✅ Aggressive Entry: Buy inside the demand zone 1.50–1.62 with strong rejection candle (hammer / bullish engulfing).
✅ Conservative Entry: Wait for breakout and close above 2.286, then enter on retest confirmation.
🎯 Upside Targets:
Step 1: 1.874 → 2.286
Step 2: 2.716 → 3.227 → 3.972
Step 3: 4.867 if momentum continues.
⚠️ Invalidation: Daily/2D close below 1.50.
---
5. Bearish Scenario (Breakdown of Demand Zone)
❌ Trigger: Daily/2D close below 1.50 with strong selling volume.
🎯 Downside Targets:
First: 1.30 (minor support)
Second: 1.00 (psychological round number)
Third: 0.95 (measured move target from range).
⚠️ Conclusion: If this zone fails, JTO risks entering a capitulation phase toward sub-$1 levels.
---
6. Market Narrative & Psychology
For Bulls, the 1.50–1.62 zone is the last stronghold — holding this zone could form a double bottom and fuel a large reversal.
For Bears, a clean breakdown of this zone would open a free fall toward $1 and below.
In short, this is the make-or-break level for JTO, where the next big move will be decided.
---
📌 Conclusion
As long as JTO holds above 1.50, upside targets toward 2.286 → 3.227 remain possible.
If 1.50 breaks, expect a potential drop to 1.00 or even 0.95.
Watch for 2D/daily candle close confirmation to validate the next major direction.
---
JTO/USDT (2D) is now testing its multi-month demand zone at 1.50–1.62.
This is the critical “Decision Point” for the market:
Bullish: Rejection + breakout above 2.286 → targets 2.716 – 3.227 – 3.972 – 4.867.
Bearish: Breakdown below 1.50 → downside targets 1.30 – 1.00 – 0.95.
This zone will decide whether JTO forms a double bottom reversal or enters a bearish capitulation.
Not financial advice — for educational purposes only.
---
#JTO #JTOUSDT #CryptoAnalysis #DemandZone #SupportResistance #CryptoTrading #SwingTrade #Breakout #BearishScenario #BullishScenario

JTO/USDT at the Edge of Pressure – Breakout or Breakdown Ahead?🧠 Detailed Technical Analysis (2D Timeframe):
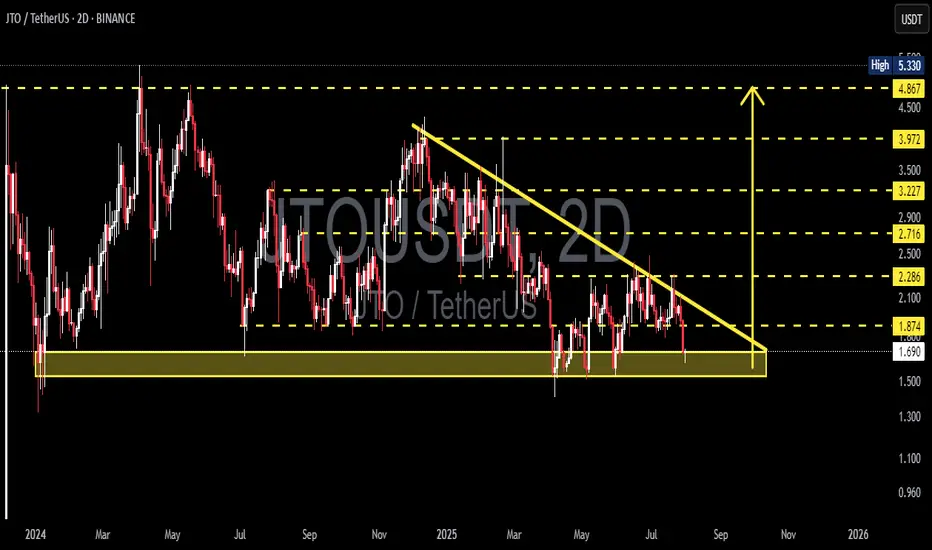
JTO/USDT is currently consolidating at a critical support zone within a well-defined Descending Triangle pattern that has been forming for over 6 months.
Key observations:
Price has been making lower highs, forming a downward-sloping resistance trendline.
Meanwhile, strong buying interest has held up the support zone between $1.69 and $1.87, suggesting accumulation.
This creates a classic Descending Triangle, often leading to a sharp breakout or breakdown.
---
📌 Key Levels:
Level Description
$1.69–$1.87 Major Demand Zone / Key Support
Descending Trendline Dynamic Resistance (from Lower Highs)
$2.29 First Resistance (Breakout Trigger)
$2.71 Key Mid-Term Resistance
$3.22 – $3.97 Major Upside Targets
$1.50 & $1.30 Breakdown Targets
---
📈 Bullish Scenario (Breakout):
If the price holds the support and successfully breaks the descending trendline, we could see a strong bullish reversal:
Confirmation breakout may lead to a rally toward $2.29 → $2.71 → $3.22 → up to $3.97.
Breakout strength increases if accompanied by volume surge.
Bullish Catalysts:
Positive project fundamentals.
Volume squeeze near triangle apex.
RSI/MACD divergence (if present).
---
📉 Bearish Scenario (Breakdown):
If price closes below the $1.69 zone with conviction:
Descending triangle confirms as a bearish continuation.
Target downside to $1.50 and potentially $1.30.
Could signal distribution phase by larger players.
Bearish Confirmation: Strong 2D candle close below $1.69 with high volume.
---
🧩 Pattern Breakdown – Descending Triangle:
The pattern represents price compression between lower highs and a horizontal support.
Statistically, 70% of descending triangles resolve to the downside.
However, in oversold conditions or with bullish catalysts, it may lead to a powerful short squeeze breakout.
---
🧭 Summary & Strategy Insight:
JTO/USDT is nearing a decision point. At the edge of the triangle’s apex, volatility is likely to spike — with a strong move in either direction.
💡Possible Strategy:
Conservative entry: Wait for breakout confirmation above the trendline with volume.
Aggressive entry: Speculative buy near $1.70 with tight stop loss.
Avoid heavy positions until the breakout or breakdown confirms.
---
🧲 Suggested Post Title:
> "JTO/USDT at a Crossroads – Descending Triangle Set for Explosive Move?"
A breakout is imminent. Will you be ready?
#JTOUSDT #CryptoBreakout #DescendingTriangle #AltcoinSetup #TechnicalAnalysis #CryptoStrategy #ChartPatterns
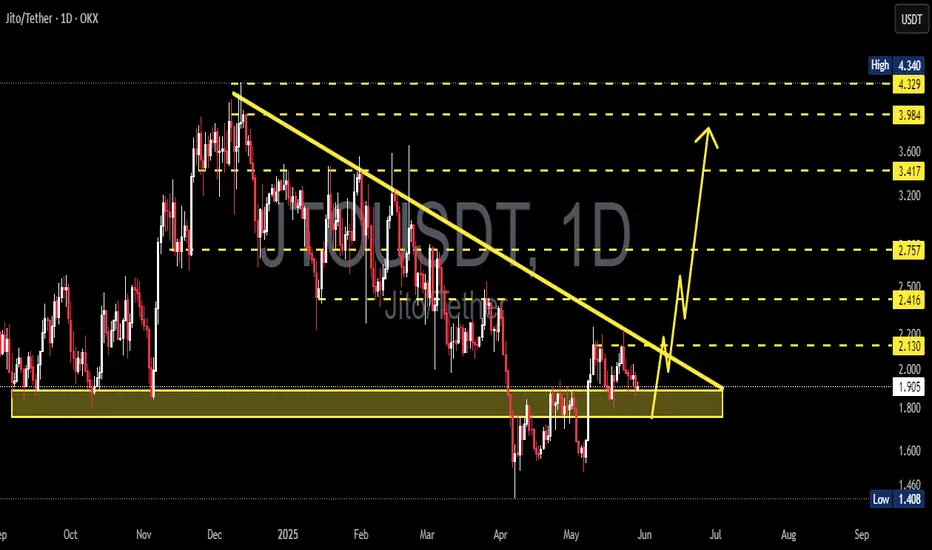
JTOUSDT Approaches Falling Wedge Breakout – Bullish Reversal?The chart indicates a major descending trendline resistance that has been tested multiple times since December 2024. Price action shows strong compression toward this resistance, suggesting a possible breakout moment.
🔄 Pattern Analysis: Falling Wedge
A Falling Wedge pattern is clearly visible:
This pattern typically signifies bullish reversal potential when formed in a downtrend.
Volume generally declines during the pattern and expands on the breakout.
The wedge begins around $3.97 and narrows down toward $2.18, where the current price action sits.
✅ Bullish Scenario:
If price breaks above the wedge resistance convincingly:
Breakout Confirmation Level: Around $2.42 (above the trendline and horizontal resistance)
Targets after breakout:
🎯 $2.73 – First major resistance
🎯 $3.39 – Mid-level resistance from previous structure
🎯 $3.97 – Key horizontal resistance and final wedge origin
🚀 Potential extension to $4.34 (previous swing high)
This would indicate a strong bullish trend resumption, especially if accompanied by high volume.
❌ Bearish Scenario:
If price fails to break above the wedge:
Possible rejection at $2.42, leading to:
🔻 Retest of support at $2.18
🔻 Further decline toward $1.40, the significant previous low
A breakdown below $2.18 would invalidate the wedge breakout and confirm bearish continuation.
⚠️ Key Technical Levels:
Support Zones: $2.18 – $1.40
Resistance Zones: $2.42 – $2.73 – $3.39 – $3.97 – $4.34
Pattern: Falling Wedge (Bullish Bias)
📌 Conclusion:
JTO/USDT is approaching a make-or-break zone. A successful breakout from the wedge could trigger a strong bullish rally, while failure may lead to further downside. Traders should monitor for volume confirmation on the breakout to validate direction.
#JTOUSDT #CryptoBreakout #FallingWedge #AltcoinAnalysis #CryptoTrading #BullishSetup #TechnicalAnalysis #ChartPattern #CryptoSignals

JTOUSDT 1D AnalysisJTO ~ 1D Analysis
#JTO Buy gradually from here if you still have confidence in this coin with a short term target of at least 15%+ from here.
JTOUSDT 3DJTO ~ 3D Analysis
#JTO Key support that must be maintained. This loss of support will bring even lower prices.
