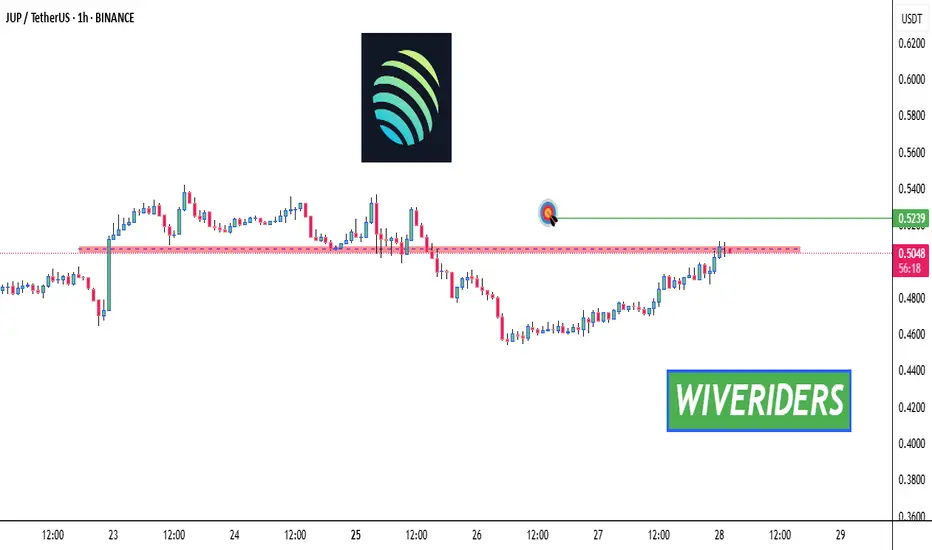
JUP Update🚨📊 JUP Update
JUP has arrived at the important red resistance zone 🔴.
A confirmed breakout is needed
for trend continuation 📈.
Otherwise,
a rejection from this level remains possible ❌.
Key zone to watch,
waiting for confirmation.
JUPUSDT

Jupiter Technical Analysis: Key Zones to Watch Right NowJupiter Technical Analysis: Key Zones to Watch Right Now BYBIT:JUPUSDT
The initial idea published on the second day after the listing has played out perfectly!
We reached the marked accumulation zone almost to the cent.
Sometimes even the most unlikely zones perform exactly as expected — because the initiation–accumulation–distribution cycle is the basic scenario for nearly all tokens after listing. Now, two years later, we’ve returned to the accumulation zone.
The ideal scenario would be to retest this zone once again. The idea becomes invalid if the price drops below $0.02, which I believe is quite unlikely.
The swing position take-profit zone is marked in red — this also aligns with the 2025 yearly open.
The first resistance zone on a rebound, likely around January next year, will be the Point of Control and the weekly order block.

JUPUSDT Forming Falling WedgeJUPUSDT is showing a falling wedge pattern, a strong technical indicator that often signals the end of a downtrend and the beginning of a bullish reversal. The price action within the wedge shows narrowing lows, suggesting that selling pressure is diminishing while buyers are gradually gaining strength. Once the breakout occurs above the wedge resistance, it could mark the start of a sharp upward movement. The technical setup looks favorable, with a clear potential for a significant bullish breakout in the coming sessions.
The trading volume remains steady and positive, reflecting growing accumulation from traders anticipating an upward move. As investor sentiment shifts toward optimism, JUPUSDT could experience increased demand, potentially triggering the expected 90% to 100%+ gain. Volume confirmation at the point of breakout will be a key factor to watch, as strong volume often validates the strength of a breakout and the sustainability of the rally that follows.
Market participants are increasingly paying attention to JUPUSDT due to its combination of solid technical structure and renewed buying interest. The falling wedge pattern aligns with broader bullish market momentum, hinting that this could be one of the coins to watch for a strong mid-term rally. As long as support levels hold and momentum builds, JUPUSDT could soon transition into a full bullish phase, rewarding those positioned early.
✅ Show your support by hitting the like button and
✅ Leaving a comment below! (What is You opinion about this Coin)
Your feedback and engagement keep me inspired to share more insightful market analysis with you!

JUP/USDT — Triangle of Pressure: Ready to Explode or Collapse?JUP is now standing at a critical crossroads, where the next few candles could decide its larger trend. After months of being trapped inside a descending triangle, price is tightening within a compression zone that’s reaching its breaking point — a massive move is loading.
The yellow support zone between 0.33–0.40 USDT has acted as a strong defensive wall for buyers, repeatedly absorbing sell pressure — even forming a deep liquidation wick, suggesting aggressive demand from buyers at lower levels.
However, the descending trendline (series of lower highs) continues to cap every rally attempt. The battle between persistent sellers and patient buyers is nearing maximum pressure, and whichever side breaks first will dictate the next major leg.
---
📈 Bullish Scenario
If price breaks and closes above the descending trendline and 0.4765 USDT with convincing volume, it would mark a structural shift to the upside.
Potential upside targets include:
0.6045 USDT → first confirmation target
0.7204 – 0.9489 USDT → momentum zone if follow-through continues
1.2114 to 1.6672 USDT → extended target zone in case of euphoria
Such a breakout could signal the start of a trend reversal — especially if Bitcoin remains stable and altcoin sentiment improves.
---
📉 Bearish Scenario
On the flip side, a clean breakdown below 0.33 USDT with volume would confirm continuation of the bearish structure, targeting:
0.29 – 0.30 USDT → short-term support
0.15 – 0.19 USDT → extreme liquidity zone (previous liquidation wick)
A decisive breakdown may signal smart money distribution and trigger a new capitulation wave across the market.
---
🔍 Technical Structure
Descending Triangle: Lower highs pressing down into flat support — a pattern of price compression that often precedes a sharp directional breakout.
Long Wick Below Support: Indicates a liquidity sweep or stop-hunt, often a precursor to a sharp rebound if confirmed by bullish follow-through.
Volume & 2D Candle Close: Key elements to validate either breakout or breakdown — without volume, moves risk being fakeouts.
---
💡 Conclusion
JUP is in a high-stakes battleground between bulls and bears — and volatility is brewing.
A breakout above 0.4765 USDT could ignite a strong bullish reversal, while a breakdown below 0.33 USDT could trigger a deeper continuation wave.
For disciplined traders, this isn’t the time to guess — it’s the time to wait for confirmation.
The next breakout will decide who wins this compression war.
---
#JUPUSDT #JUP #CryptoBreakout #TechnicalAnalysis #TradingView #DescendingTriangle #AltcoinSetup #SupportResistance #CryptoMarket #TrendReversal #ChartPattern #LiquidityTrap

JUP - NEUTRALLSE:JUP - price analysis:
Very neutral one the weekly & daily basis.
Globablly: yellow box
Daily zone: 0.500 - 0.4480$
No price direction yet, importants levels are in my view.

JUP/USDT — Critical Demand Zone Retest and Breakout Setup!Currently, JUP/USDT is trading around 0.4318, sitting just above the strong demand zone at 0.33 – 0.38, which is reinforced by an ascending trendline. This structure highlights a phase of accumulation with higher lows, where buyers are still defending price levels, but sellers remain in control as long as price fails to reclaim resistance.
The area has acted as a major base support, rejecting further downside several times. On the other hand, the 0.4883 level stands as the key pivot: only a confirmed close above this level can shift momentum back in favor of the bulls.
---
🟢 Bullish Scenario
Confirmation: Price holds the 0.33–0.38 demand zone and reclaims 0.4883 on a strong 2D close with volume.
Implication: Breakout from accumulation structure → potential impulsive rally.
Upside targets:
TP1: 0.6089 (minor resistance + first measured move target)
TP2: 0.7213
TP3: 0.8075
Mid-term target: 1.1158 (sign of larger reversal)
Measured Move: Range 0.34–0.488 projects a breakout target around 0.63–0.64, aligning with the 0.60–0.72 supply zone.
---
🔴 Bearish Scenario
Confirmation: Breakdown and consistent 2D close below 0.33, followed by failed retest (support turning resistance).
Implication: Higher-low structure breaks → continuation of distribution.
Downside targets:
First support: 0.30
Next level: 0.255 (historical low)
If momentum is strong, extension toward 0.20 possible.
---
📐 Pattern & Market Structure
Main structure: Ascending accumulation with horizontal cap (similar to an ascending triangle, but still capped).
Demand zone: 0.33–0.38 → strong buy area.
Supply zone: 0.4883 → rejection level that needs to flip.
The longer price consolidates here, the higher the probability of an explosive move once direction is chosen.
---
📝 Trading Notes
Conservative long: Wait for a breakout >0.4883, enter on retest confirmation.
Aggressive long: Accumulate within 0.33–0.38 zone with a tight stop below 0.30.
Short setup: Open if price breaks <0.33 with volume and fails retest.
Always apply strict risk management — this is a decision point zone for JUP.
---
🎯 Conclusion
JUP/USDT is at a critical crossroads. A strong rebound from 0.33–0.38 could trigger a move toward 0.60–0.72, while a confirmed breakdown below this zone opens the door to 0.30–0.255. The next big move will be decided by how price reacts to the demand zone + 0.4883 resistance level.
---
#JUP #JUPUSDT #CryptoAnalysis #Altcoin #SupportResistance #Breakout #TechnicalAnalysis #PriceAction #CryptoSetup
JUP - UPDATELSE:JUP - update:
DOJI candle on the daily, but H4 support still holding.
Bullish bias above 0.5150$ 📈
Neutral: $0.5600 - $0.4980
Lower key support: 0.5150 - 0.4950 - 0.4550 - 0.4300$

JUPUSDT: Patience Before the FeastThere are moments in the market when you can feel something building beneath the surface. For BINANCE:JUPUSDT , that feeling of something "cooking" is becoming difficult to ignore, and for good reason.
Let's look at the simple truths on the chart. First, listen to the sound. The volume is picking up, not with a frantic roar, but with a steady, deliberate rhythm. This is often the sound of patient hands accumulating positions.
Second, feel the heat. The price action is coiling, building pressure in a tightening range. This consolidation, this "cooking," is often the quiet preparation before a significant move.
Given these signs, the logic to attempt a long position is sound. But a wise trader doesn't just rush into the kitchen; they wait for the meal to be served.
The blue box on the chart represents our area of interest. It is a zone of calculated support, a logical place to consider entering a long position. We do not chase the price. We let the price come to our predefined zone.
The plan is one of patience. See if the market offers an entry in the blue box. Know your point of invalidation before you risk a single dollar.
The feast may be coming, but entry is reserved for the disciplined.
Disclaimer: This analysis is for informational purposes only and is not financial advice. Trading involves significant risk. Always conduct your own research.
📌I keep my charts clean and simple because I believe clarity leads to better decisions.
📌My approach is built on years of experience and a solid track record. I don’t claim to know it all but I’m confident in my ability to spot high-probability setups.
📌If you would like to learn how to use the heatmap, cumulative volume delta and volume footprint techniques that I use below to determine very accurate demand regions, you can send me a private message. I help anyone who wants it completely free of charge.
🔑I have a long list of my proven technique below:
🎯 ZENUSDT.P: Patience & Profitability | %230 Reaction from the Sniper Entry
🐶 DOGEUSDT.P: Next Move
🎨 RENDERUSDT.P: Opportunity of the Month
💎 ETHUSDT.P: Where to Retrace
🟢 BNBUSDT.P: Potential Surge
📊 BTC Dominance: Reaction Zone
🌊 WAVESUSDT.P: Demand Zone Potential
🟣 UNIUSDT.P: Long-Term Trade
🔵 XRPUSDT.P: Entry Zones
🔗 LINKUSDT.P: Follow The River
📈 BTCUSDT.P: Two Key Demand Zones
🟩 POLUSDT: Bullish Momentum
🌟 PENDLEUSDT.P: Where Opportunity Meets Precision
🔥 BTCUSDT.P: Liquidation of Highly Leveraged Longs
🌊 SOLUSDT.P: SOL's Dip - Your Opportunity
🐸 1000PEPEUSDT.P: Prime Bounce Zone Unlocked
🚀 ETHUSDT.P: Set to Explode - Don't Miss This Game Changer
🤖 IQUSDT: Smart Plan
⚡️ PONDUSDT: A Trade Not Taken Is Better Than a Losing One
💼 STMXUSDT: 2 Buying Areas
🐢 TURBOUSDT: Buy Zones and Buyer Presence
🌍 ICPUSDT.P: Massive Upside Potential | Check the Trade Update For Seeing Results
🟠 IDEXUSDT: Spot Buy Area | %26 Profit if You Trade with MSB
📌 USUALUSDT: Buyers Are Active + %70 Profit in Total
🌟 FORTHUSDT: Sniper Entry +%26 Reaction
🐳 QKCUSDT: Sniper Entry +%57 Reaction
📊 BTC.D: Retest of Key Area Highly Likely
📊 XNOUSDT %80 Reaction with a Simple Blue Box!
📊 BELUSDT Amazing %120 Reaction!
📊 Simple Red Box, Extraordinary Results
📊 TIAUSDT | Still No Buyers—Maintaining a Bearish Outlook
📊 OGNUSDT | One of Today’s Highest Volume Gainers – +32.44%
📊 TRXUSDT - I Do My Thing Again
📊 FLOKIUSDT - +%100 From Blue Box!
📊 SFP/USDT - Perfect Entry %80 Profit!
📊 AAVEUSDT - WE DID IT AGAIN!
I stopped adding to the list because it's kinda tiring to add 5-10 charts in every move but you can check my profile and see that it goes on..

JUPUSDT Is Screaming Reversal – Will You Be the Last Bull HoldinYello, Paradisers – are you about to walk straight into a trap? JUPUSDT is currently showing strong bearish signs right at a key resistance zone, and if you're still holding long positions, it might be time to reconsider before it’s too late.
💎We’re spotting multiple bearish divergences across major indicators: MACD, RSI, and Stochastic RSI are all signaling weakness. On top of that, JUP is moving within an ascending channel, which is typically a bearish continuation pattern. These signals combined are increasing the probability of a sharp downward move from current levels.
💎If we get a proper rejection here, the short setup could easily deliver a 1:1.5 risk-to-reward or better. For more conservative traders, waiting for a pullback with confirmation—such as a bearish candlestick formation backed by high volume—is the smarter play. This approach not only gives a clearer signal but also allows for a tighter stop-loss, improving the overall trade setup.
💎More aggressive traders could consider shorting from the current market price, but keep in mind that confirmation is always key when looking to maximize probability and manage risk effectively.
💎However, if price breaks above the invalidation level and closes a candle above that zone, the bearish outlook will be invalidated. In that case, it’s best to stay out and reassess based on new structure.
🎖Strive for consistency, not quick profits. Treat the market as a businessman, not as a gambler. The only traders who make it in the long run are those who stay patient, wait for high-probability setups, and avoid emotional decisions. Stay sharp and stay disciplined, Paradisers.
MyCryptoParadise
iFeel the success🌴

Record Breaking Solana Highs & The Rise of Dark DexsDark DEXs routed through aggregators are eating Solana spot flow- leaving BINANCE:SOLUSDT & BINANCE:JUPUSDT as the cleanest upside while order-book DEXs fight for share.
TVL on Solana just hit all-time highs, with the biggest lift coming via Jupiter (JUP) routing.
Over the last 30 days, the largest spot volume was on a private “dark DEX” (Humidifi) - not Meteora, BINANCE:RAYUSDT , or BYBIT:PUMPUSDT .
These private venues plug into Jupiter’s aggregator, filling at better prices; efficiency accrues to the dark DEXs + the aggregator + the chain.
Net result: Raydium/Orca can rise with the tide short-term, but market share pressure is real if dark routing keeps compounding.
Trade view: The most direct upside is SOL + JUP. SOL’s pivotal level ≈ $175 - sustained breakout targets $250, then thin resistance up to ~$300.
Watching JUP share of routed volume, SOL TVL/fees, and spot depth for confirmation.
Not financial advice. Do your own research.

$JUPUSDT – Time to Accumulate
Been waiting on this one. Back in mid-July I was eager to enter, but the weekly setup wasn’t ready. Now the monthly shows a potential trend reversal — doesn’t mean it fires instantly, but higher timeframes are giving us a safer zone to scale in slowly.
With NYSE:SOL regaining strength, it’s likely LSE:JUP and NASDAQ:RAY will follow once momentum kicks in.
✅ Buying below 50c
❌ Invalidates if it loses 37c (will wait for a fresh trigger there)
🎯 Targets: 80c → 1.10 once the trend is active
Not the cleanest chart, but the risk/reward here is too good to ignore. BINANCE:JUPUSDT

JUPUSDT Bulls Are In Trouble?Yello Paradisers, did you see how JUPUSDT broke down from its ascending channel right at the crucial 4H resistance zone? That move alone has already triggered warning signals, and now with a bearish CHoCH confirmed together with bearish divergence on both the MACD histogram and RSI, the probability of further downside has increased significantly.
💎 At this stage, aggressive traders could already be looking for short opportunities from the current price action, with a potential reward-to-risk ratio of more than 1:1.5. Conservative traders, however, should ideally wait for a clean retest of the broken resistance zone. A bearish candlestick pattern forming there would provide stronger confirmation before pulling the trigger.
💎 Since we are heading into month-end, a possible liquidity sweep cannot be ruled out. That is why scaling in with smaller position sizes makes more sense here to avoid unnecessary exposure.
💎 Still, discipline is key. If the price manages to break and close back above the invalidation level, this entire bearish setup would be invalidated. In that case, staying out would be the only smart move.
🎖Strive for consistency, not quick profits. Treat the market as a businessman, not as a gambler.
MyCryptoParadise
iFeel the success🌴

JUP Breakout Alert! 🚨 LSE:JUP Breakout Alert! 🚨
LSE:JUP is currently testing the red resistance zone 🔴
If price breaks out, the first target will be the green line level 🎯
A confirmed breakout would signal bullish continuation and could drive price higher ✅
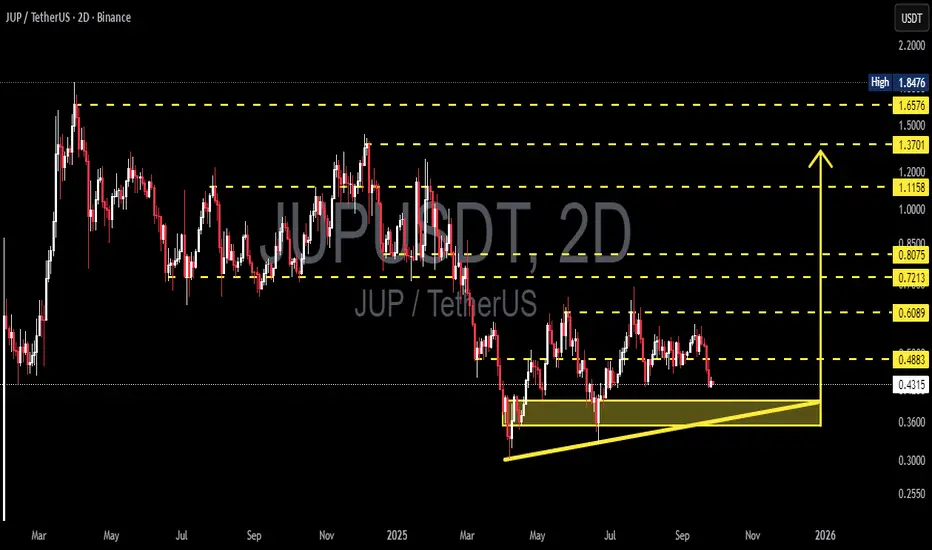
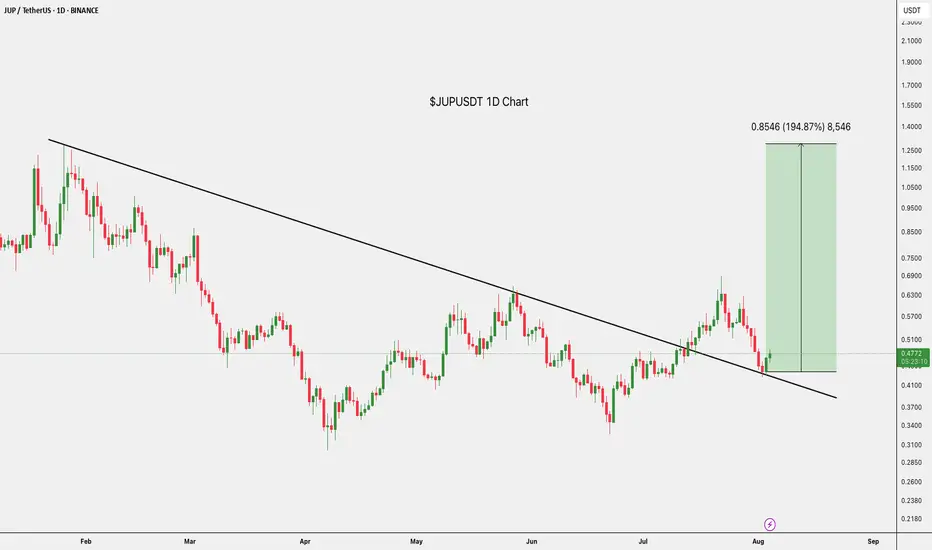
$JUP Breakout Targeting 195%LSE:JUP has broken out of a long-term downtrend and successfully retested the breakout around $0.4675.
The bounce looks strong, and with momentum building, a move toward $1.3354 (nearly 195% upside) is on the cards.
Signs of accumulation are clear; this could be the start of a trend reversal.
DYOR, NFA
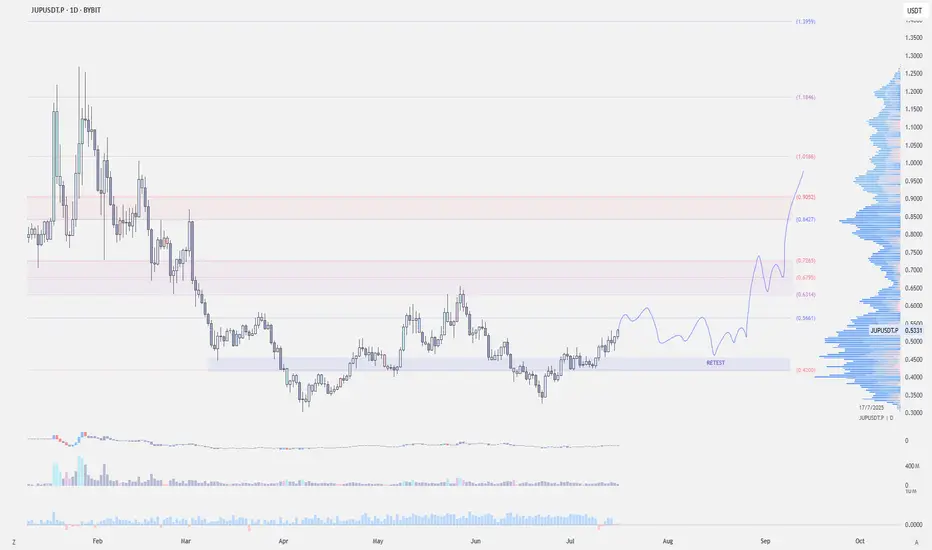
JUP/USDT Retests Key Support! Bounce Incoming or Breakdown Ahead📉 Complete Technical Analysis:
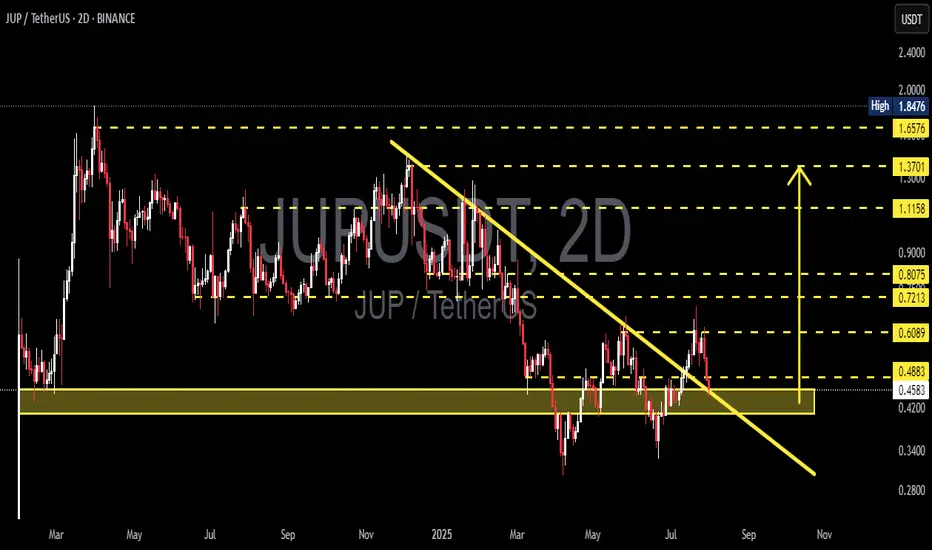
The JUP/USDT pair is currently showing a critical price action after breaking out from a medium-term descending trendline (yellow diagonal line). However, the price is now retesting a major demand zone around $0.4200–$0.4574.
📌 Pattern Identified:
Descending Trendline Breakout: Price successfully broke above a long-standing bearish trendline.
Retest of Breakout Zone: The current move is a classic retest, often seen before a trend reversal continuation.
Strong Demand Zone: The yellow zone ($0.4200–$0.4574) has historically served as a strong accumulation and bounce area.
---
📈 Bullish Scenario:
If the price holds and bounces from the $0.4200–$0.4574 zone, bullish momentum could resume with upside targets:
Short-term target: $0.6089
Next resistances: $0.7213 – $0.8075
A confirmed higher low above support would strengthen the bullish structure.
---
📉 Bearish Scenario:
If the price breaks down below $0.4200, bearish pressure could return, leading to further downside.
Potential decline toward deeper support levels around $0.35–$0.30.
Breakdown with increasing volume would confirm seller dominance.
---
🎯 Key Levels to Watch:
Support Zone: $0.4200 – $0.4574 (Critical Retest Area)
Immediate Resistance: $0.4883, $0.6089
Major Resistance Levels: $0.7213, $0.8075, $1.1158, up to $1.6576
---
🧠 Conclusion:
JUP/USDT is currently at a crucial decision point. The reaction at this support zone will define whether the breakout holds or fails. Traders should watch this level closely for confirmation of the next major move.
#JUPUSDT #CryptoAnalysis #AltcoinUpdate #TechnicalAnalysis #CryptoBreakout #SupportAndResistance #TradingView #Cryptocurrency #ChartPattern #BullishSetup #BearishCase
TradeCityPro | JUP Eyes Breakout as Altseason Momentum Builds👋 Welcome to TradeCity Pro!
In this analysis, I want to review the JUP coin for you. It’s one of the projects in the Solana ecosystem, currently ranked 59 on CoinMarketCap with a market cap of $1.65 billion.
📅 Daily Timeframe
On the daily timeframe, this coin is currently sitting below a very important resistance zone at 0.6312. This is a strong resistance area and serves as the main trigger for a trend reversal in this coin.
✔️ The main support floor for JUP is located at 0.3409, a level price has tested twice before. Now it has returned to 0.6312, and we can see increased market volume at this level, which indicates tension between buyers and sellers.
✨ A breakout of 0.6312 would be a good trigger for a long position, and I plan to open a long if this level breaks. This could potentially be a long-term position with a high risk-to-reward ratio.
🔔 The next major resistance zones are at 0.7858 and 1.1435, which we can use as targets for this position.
🔽 If the price gets rejected from the top and moves down, breaking 0.4186 and 0.3409, we can look to open a short position.
🧩 The break of 0.3409 would confirm the start of a downtrend, and it's one of the key zones where I’ll definitely look to hold a short position if it breaks.
📝 Final Thoughts
This analysis reflects our opinions and is not financial advice.
Share your thoughts in the comments, and don’t forget to share this analysis with your friends! ❤️

JUP / USDTBINANCE:JUPUSDT
### **📊 Chart Overview – JUPUSDT (4H):**
* **Current Price:** \$0.5415
* **Recent Action:** Price dropped sharply from \$0.668 and is now testing a **key support zone around \$0.54 – \$0.55**.
* **Key Supports:**
* **\$0.545 – \$0.54 (current zone).**
* **\$0.504 – \$0.50 (next support).**
* **\$0.466 (major support).**
* **Resistance Levels:** \$0.60 and \$0.668.
---
### **🔍 Technical Breakdown:**
1. **Trendline Resistance:**
* A descending red trendline is currently capping upside movement.
* Price needs to **break and close above \$0.57 – \$0.60** for bullish momentum.
2. **Bullish Scenario:**
* If \$0.54 holds as strong support, we could see a **bounce towards \$0.60 – \$0.65**.
3. **Bearish Scenario:**
* A breakdown below **\$0.54** might push the price down to **\$0.50** or even **\$0.466**.
---
### **📌 Summary:**
JUP is at a **critical support**. The next 1–2 candles on the 4H chart will decide if it bounces or dips toward the \$0.50 level.
---
⚠️ **Disclaimer:**
*This analysis is for informational and educational purposes only. It is not financial advice. Always do your own research (DYOR) and manage risk appropriately.*

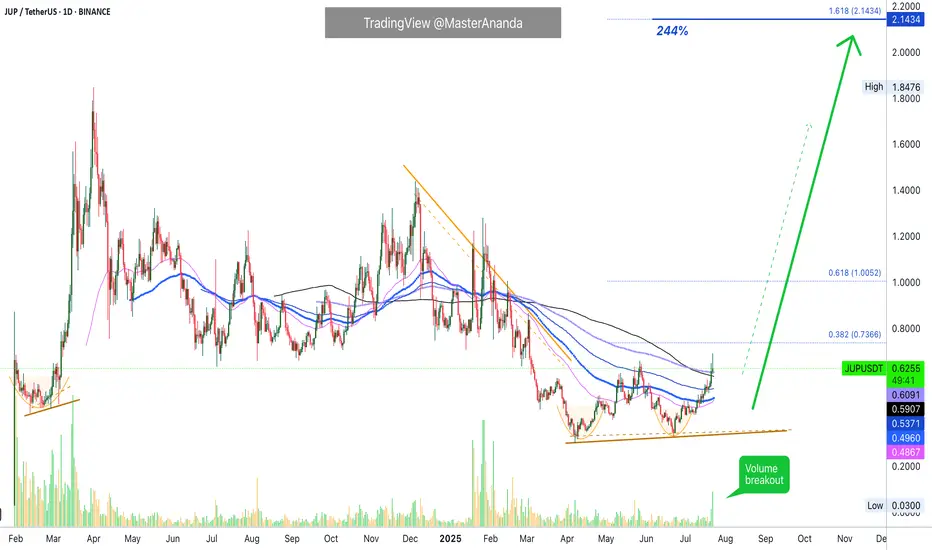
Jupiter & The Exponential Moving Averages · Volume BreakoutFirst I looked at a pair and it was struggling to move past certain long-term EMAs. Then I opened up Jupiter, JUPUSDT, and I can see it moving forward... This is a bullish development.
Just today a multiplicity of bullish signals came together. JUPUSDT broke above its May 2025 high. Hitting the highest price since March, almost 5 months ago.
After a higher low 22-June, JUPUSDT rallied and continued to gain strength. After 9-July, it started to break, one by one, all the moving averages on this chart. These levels were working as resistance.
First EMA55 was conquered after eleven days struggling below. Then EMA89 was conquered one day after, the blue dotted line on the char. Four days later the action moved above EMA144 followed by MA200 and EMA233 yesterday; today, JUPUSDT is trading above all those major levels, with the highest price in five months.
This is as good as it gets and it reveals the intensification of a newly developing bullish wave. This wave will transform into an uptrend and this uptrend will lead to a major bull-run. The bull-run will go hiiiiigh reaching a new all-time high, the end of the bullish cycle; the entire process can take anywhere between 4-6 months or 8-12 months or more. It really depends on the overall market condition, Bitcoin and how active is the project developers team. This can all work together to produce something great.
Volume is starting to rise now. This means that it is still very early in this game.
We are just entering the bullish zone. After a major high is confirm, we can see very strong exponential growth.
While at first it takes months for prices to grow 2-3 levels up, when the wave is advanced we can see several levels increase in a matter of weeks and then it keeps on intensifying until the market goes crazy and that's when you see euphoria and greed. It is still early, but it doesn't hurt to be prepared.
Keep a calm and sane mind, you will need it to maximize profits and close as many as possible successful trades.
Namaste.
$JUP - Long Trade IdeaBINANCE:JUPUSDT | 1D
Entry: .53 to .50
Stoploss: .477 (prev low)
Initial target .57–.60, if we get a strong rejection here, take full profit and look to re-enter on a retest around .47–.45
TPs:
.57-.60
.67-.72
.82-.90
JUP/USDT – Massive Breakout Brewing? Falling Wedge Reversal🧠 Detailed Technical Analysis:
Jupiter (JUP) is currently forming a classic bullish reversal pattern – the Falling Wedge – after months of consistent downward pressure. Since December 2024, JUP has been trending inside a narrowing range of lower highs and lower lows, and it's now approaching a potential breakout zone.
📊 Pattern in Focus: Falling Wedge – A Powerful Bullish Reversal Setup
The Falling Wedge consists of a converging downtrend with declining volatility.
This pattern typically signals a loss of bearish momentum and often precedes a sharp upside breakout.
If confirmed, a breakout can lead to a strong bullish impulse wave with significant gains.
🔍 Key Levels to Watch:
✅ Major Support Zones:
$0.3018 – Historical low and critical defense level
$0.4453 – $0.4883 – Current consolidation base
🚀 Key Resistance Targets (Post-Breakout):
$0.6089 – First resistance after breakout
$0.7213 – Mid-level resistance
$0.8075 – Key breakout zone before bullish expansion
$1.1158 – $1.3701 – Primary medium-term targets
$1.4400 – All-time high and psychological resistance
🔼 Bullish Scenario (High Probability Setup):
If JUP breaks above the falling wedge resistance and clears $0.4883:
✅ A bullish rally could target $0.6089, followed by $0.7213 and $0.8075
✅ If strong momentum follows, JUP might extend gains towards $1.1158 – $1.3701
✅ Watch for breakout confirmation with high volume and potential retest of the breakout zone
🔽 Bearish Scenario (Risk to Consider):
If price gets rejected and breaks below $0.4453:
❌ Downside may resume toward $0.3600 or even retest $0.3018
❌ This could either lead to a prolonged downtrend or form a double bottom base for a future reversal
💡 Conclusion & Strategy:
JUP is at a critical technical juncture. The Falling Wedge formation is one of the most reliable bullish reversal signals.
This setup offers a great risk-reward opportunity for traders watching for a confirmed breakout.
📌 Breakout = Golden Opportunity
📌 Breakdown = Be Cautious & Reassess
Aggressive traders may look to accumulate near $0.44–$0.48 with tight stop-losses.
Conservative traders should wait for a breakout + retest for confirmation before entering.
#JUP #JUPUSDT #CryptoBreakout #FallingWedge #TechnicalAnalysis #AltcoinSetup #CryptoChart #BullishSetup#AltcoinWatch #SwingTradeSetup #CryptoStrategy

JUP Main trend. Channel. Wedge. Double bottom. 06 07 2025Logarithm. Time frame 3 days. Decline from the maximum -84% (this is not enough), but given the capitalization of 59th place, if the market is positive in the near future, then it is quite possible to reverse this cryptocurrency through a double bottom.
All long-term consolidation above with high volatility is the distribution of ladies and gentlemen. Also study the vesting of this cryptocurrency. There are less than half of the tokens on the market, and there are also pauses for 1 year, which is good.
Jupiter (JUP) is a key player in the decentralized finance (DeFi) space, especially in the Solana blockchain.
Main trend is downward. Descending channel.
Secondary trend is downward. Descending wedge.
Local trend is sideways. Potential double bottom in case of a breakout.
The price will move in the corridors of this descending channel from the dynamic lines of its support/resistance. Remember this and use it in your trading strategy, observing money management.
Local breakout zone
Understand where the zones are cheap, and where, on the contrary, the zones are expensive. If you work (tear out movements, there should be short-term or conditionally medium-term transactions, with very mundane goals) conditionally in expensive zones, then limit losses. Do not let yourself be fooled by news noise and the opinions of the majority.

JUPUSDT Retests Breakout Zone: Rally Ahead?JUPUSDT has broken its downtrend and is now in a retest phase, which could lead to a continuation of the bullish move. If the support area holds, there’s potential for upward momentum to resume. Traders are watching this zone closely as a possible entry point, with bullish structure still intact and room for further gains if momentum continues.

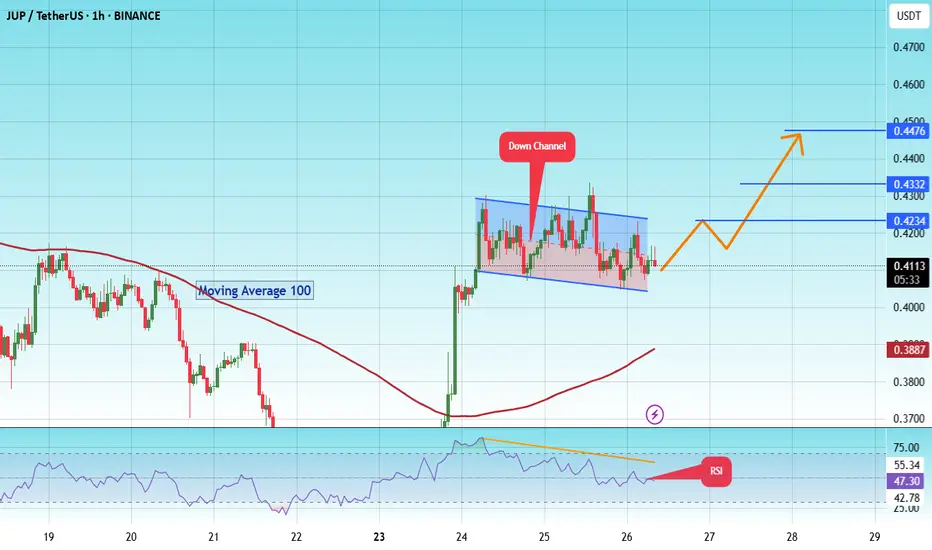
#JUP/USDT#JUP
The price is moving within a descending channel on the 1-hour frame and is expected to break and continue upward.
We have a trend to stabilize above the 100 moving average once again.
We have a downtrend on the RSI indicator, which supports the upward move by breaking it upward.
We have a support area at the lower limit of the channel at 0.4065, acting as strong support from which the price can rebound.
Entry price: 0.4113
First target: 0.4234
Second target: 0.4332
Third target: 0.4477