JUP/USDT — Triangle of Pressure: Ready to Explode or Collapse?JUP is now standing at a critical crossroads, where the next few candles could decide its larger trend. After months of being trapped inside a descending triangle, price is tightening within a compression zone that’s reaching its breaking point — a massive move is loading.
The yellow support zone between 0.33–0.40 USDT has acted as a strong defensive wall for buyers, repeatedly absorbing sell pressure — even forming a deep liquidation wick, suggesting aggressive demand from buyers at lower levels.
However, the descending trendline (series of lower highs) continues to cap every rally attempt. The battle between persistent sellers and patient buyers is nearing maximum pressure, and whichever side breaks first will dictate the next major leg.
---
📈 Bullish Scenario
If price breaks and closes above the descending trendline and 0.4765 USDT with convincing volume, it would mark a structural shift to the upside.
Potential upside targets include:
0.6045 USDT → first confirmation target
0.7204 – 0.9489 USDT → momentum zone if follow-through continues
1.2114 to 1.6672 USDT → extended target zone in case of euphoria
Such a breakout could signal the start of a trend reversal — especially if Bitcoin remains stable and altcoin sentiment improves.
---
📉 Bearish Scenario
On the flip side, a clean breakdown below 0.33 USDT with volume would confirm continuation of the bearish structure, targeting:
0.29 – 0.30 USDT → short-term support
0.15 – 0.19 USDT → extreme liquidity zone (previous liquidation wick)
A decisive breakdown may signal smart money distribution and trigger a new capitulation wave across the market.
---
🔍 Technical Structure
Descending Triangle: Lower highs pressing down into flat support — a pattern of price compression that often precedes a sharp directional breakout.
Long Wick Below Support: Indicates a liquidity sweep or stop-hunt, often a precursor to a sharp rebound if confirmed by bullish follow-through.
Volume & 2D Candle Close: Key elements to validate either breakout or breakdown — without volume, moves risk being fakeouts.
---
💡 Conclusion
JUP is in a high-stakes battleground between bulls and bears — and volatility is brewing.
A breakout above 0.4765 USDT could ignite a strong bullish reversal, while a breakdown below 0.33 USDT could trigger a deeper continuation wave.
For disciplined traders, this isn’t the time to guess — it’s the time to wait for confirmation.
The next breakout will decide who wins this compression war.
---
#JUPUSDT #JUP #CryptoBreakout #TechnicalAnalysis #TradingView #DescendingTriangle #AltcoinSetup #SupportResistance #CryptoMarket #TrendReversal #ChartPattern #LiquidityTrap
Jupusdtlong

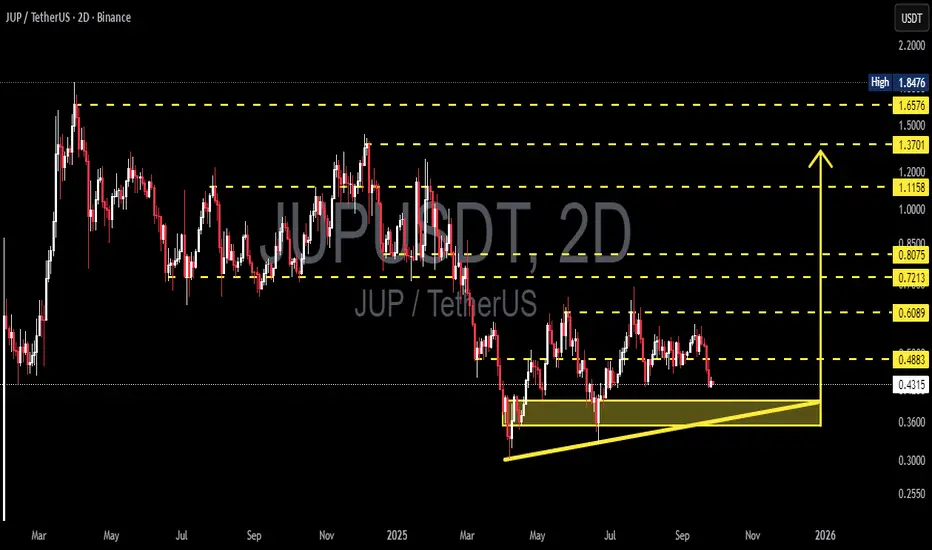
JUP/USDT — Critical Demand Zone Retest and Breakout Setup!Currently, JUP/USDT is trading around 0.4318, sitting just above the strong demand zone at 0.33 – 0.38, which is reinforced by an ascending trendline. This structure highlights a phase of accumulation with higher lows, where buyers are still defending price levels, but sellers remain in control as long as price fails to reclaim resistance.
The area has acted as a major base support, rejecting further downside several times. On the other hand, the 0.4883 level stands as the key pivot: only a confirmed close above this level can shift momentum back in favor of the bulls.
---
🟢 Bullish Scenario
Confirmation: Price holds the 0.33–0.38 demand zone and reclaims 0.4883 on a strong 2D close with volume.
Implication: Breakout from accumulation structure → potential impulsive rally.
Upside targets:
TP1: 0.6089 (minor resistance + first measured move target)
TP2: 0.7213
TP3: 0.8075
Mid-term target: 1.1158 (sign of larger reversal)
Measured Move: Range 0.34–0.488 projects a breakout target around 0.63–0.64, aligning with the 0.60–0.72 supply zone.
---
🔴 Bearish Scenario
Confirmation: Breakdown and consistent 2D close below 0.33, followed by failed retest (support turning resistance).
Implication: Higher-low structure breaks → continuation of distribution.
Downside targets:
First support: 0.30
Next level: 0.255 (historical low)
If momentum is strong, extension toward 0.20 possible.
---
📐 Pattern & Market Structure
Main structure: Ascending accumulation with horizontal cap (similar to an ascending triangle, but still capped).
Demand zone: 0.33–0.38 → strong buy area.
Supply zone: 0.4883 → rejection level that needs to flip.
The longer price consolidates here, the higher the probability of an explosive move once direction is chosen.
---
📝 Trading Notes
Conservative long: Wait for a breakout >0.4883, enter on retest confirmation.
Aggressive long: Accumulate within 0.33–0.38 zone with a tight stop below 0.30.
Short setup: Open if price breaks <0.33 with volume and fails retest.
Always apply strict risk management — this is a decision point zone for JUP.
---
🎯 Conclusion
JUP/USDT is at a critical crossroads. A strong rebound from 0.33–0.38 could trigger a move toward 0.60–0.72, while a confirmed breakdown below this zone opens the door to 0.30–0.255. The next big move will be decided by how price reacts to the demand zone + 0.4883 resistance level.
---
#JUP #JUPUSDT #CryptoAnalysis #Altcoin #SupportResistance #Breakout #TechnicalAnalysis #PriceAction #CryptoSetup
JUP/USDT Retests Key Support! Bounce Incoming or Breakdown Ahead📉 Complete Technical Analysis:
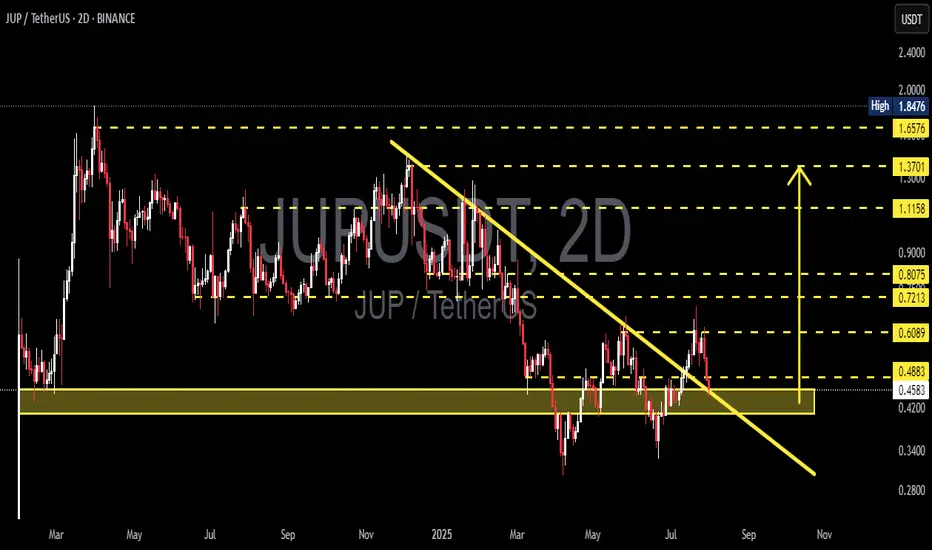
The JUP/USDT pair is currently showing a critical price action after breaking out from a medium-term descending trendline (yellow diagonal line). However, the price is now retesting a major demand zone around $0.4200–$0.4574.
📌 Pattern Identified:
Descending Trendline Breakout: Price successfully broke above a long-standing bearish trendline.
Retest of Breakout Zone: The current move is a classic retest, often seen before a trend reversal continuation.
Strong Demand Zone: The yellow zone ($0.4200–$0.4574) has historically served as a strong accumulation and bounce area.
---
📈 Bullish Scenario:
If the price holds and bounces from the $0.4200–$0.4574 zone, bullish momentum could resume with upside targets:
Short-term target: $0.6089
Next resistances: $0.7213 – $0.8075
A confirmed higher low above support would strengthen the bullish structure.
---
📉 Bearish Scenario:
If the price breaks down below $0.4200, bearish pressure could return, leading to further downside.
Potential decline toward deeper support levels around $0.35–$0.30.
Breakdown with increasing volume would confirm seller dominance.
---
🎯 Key Levels to Watch:
Support Zone: $0.4200 – $0.4574 (Critical Retest Area)
Immediate Resistance: $0.4883, $0.6089
Major Resistance Levels: $0.7213, $0.8075, $1.1158, up to $1.6576
---
🧠 Conclusion:
JUP/USDT is currently at a crucial decision point. The reaction at this support zone will define whether the breakout holds or fails. Traders should watch this level closely for confirmation of the next major move.
#JUPUSDT #CryptoAnalysis #AltcoinUpdate #TechnicalAnalysis #CryptoBreakout #SupportAndResistance #TradingView #Cryptocurrency #ChartPattern #BullishSetup #BearishCase