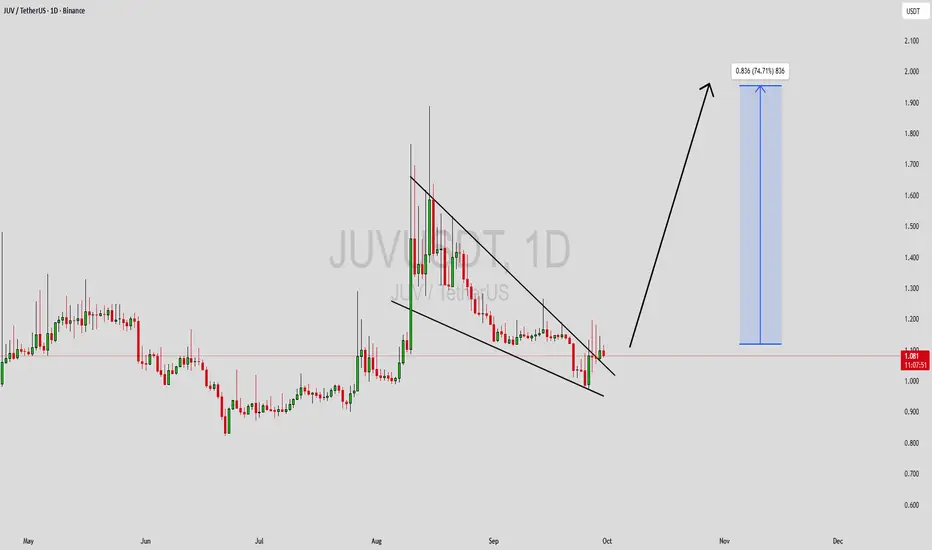
JUVUSDT Forming Falling WedgeJUVUSDT is currently forming a falling wedge pattern, which is widely recognized as a bullish reversal signal in technical analysis. This setup shows that the price is compressing downward with lower highs and lower lows, but with decreasing selling momentum. When combined with strong trading volume, the probability of a bullish breakout increases significantly, giving this coin the potential for a 60% to 70%+ upside move.
The wedge structure indicates that sellers are gradually losing strength while buyers are preparing for an entry. Once JUVUSDT breaks through its key resistance level, momentum traders and long-term investors could step in aggressively, fueling a rapid rally. Historically, this type of breakout has triggered strong surges across various crypto pairs, making this pattern particularly important to watch.
Investor interest in this project has also been building, which strengthens the bullish case. Market sentiment and strong accumulation support the idea that JUVUSDT could soon shift direction and open up new growth opportunities. With favorable technicals and rising engagement, this pair is becoming more attractive to traders searching for high-probability setups.
✅ Show your support by hitting the like button and
✅ Leaving a comment below! (What is You opinion about this Coin)
Your feedback and engagement keep me inspired to share more insightful market analysis with you!
JUVBTC
JUVUSDT UPDATE#JUV
UPDATE
JUV Technical Setup
Pattern: Bullish falling wedge breakout
Current Price: $1.085
Target Price: $1.625
Target % Gain: 50.32%
JUV is breaking out of a falling wedge pattern on the 1D timeframe. The breakout indicates bullish momentum with potential upside toward $1.625. Market structure favors continuation if buying pressure sustains. Always use proper risk management.

JUVUSDT UPDATE\#JUV
UPDATE
JUV Technical Setup
Pattern: Bullish Flag
Current Price: \$1.566
Target Price: \$2.40
Target % Gain: 65.88%
Technical Analysis: JUV is forming a bullish flag on the 1D chart after a strong impulsive move, consolidating within a tight range. Price has held above \$1.40 support with increasing bullish momentum, and a breakout above the flag resistance could trigger a sharp rally toward \$2.40.
Time Frame: 1D
Risk Management Tip: Always use proper risk management.

JUVUSDT Forming Bullish ReversalJUVUSDT has recently triggered a bullish reversal pattern, breaking out of a descending wedge formation—a classic signal often followed by sharp upward moves. This breakout was validated by a strong bullish engulfing candle and robust volume, indicating buyers are firmly asserting control. The technical momentum is further supported by a bullish golden cross on the daily chart, with the 50-period moving average crossing above the 200-period.
Key technical indicators highlight a constructive backdrop: MACD has turned decisively positive, and a clear bullish divergence is present, suggesting the potential for further upside. These momentum signatures, combined with rising volume, paint a favorable setup for continuation toward higher price zones.
Price action is currently testing resistance in the $1.098–$1.102 zone, while support holds firmly around $1.071–$1.073. A breakout above the ceiling—confirmed with sustained volume—could initiate a fresh rally, offering upside potential of around 40% to 45%+ from current levels.
Taken together, JUVUSDT presents a compelling risk–reward scenario. The technical structure is sound, chart patterns affirm bullish sentiment, and trading volume underscores market conviction. If the breakout sustains, it could signal a mid-term uptrend ahead.
✅ Show your support by hitting the like button and
✅ Leaving a comment below! (What is your opinion about this Coin)
Your feedback and engagement keep me inspired to share more insightful market analysis with you!

JUVUSDT Forming Bullish MomentumJUVUSDT is showing signs of a strong recovery from its recent consolidation phase, with a clear bullish momentum starting to emerge. The price action has bounced confidently from a well-defined support zone, highlighted in the chart, and buyers have stepped in aggressively. This indicates strong market interest and could be the early stage of a new upward trend. The expected upside potential ranges from 30% to 40%+, supported by increasing volume and favorable sentiment.
The token is now trading just above a key breakout zone, which has historically acted as resistance but is now turning into strong support. This shift in market structure is often a signal of a bullish reversal. Given the recent breakout attempt and minor pullback for retesting, the chart suggests JUVUSDT may be gearing up for a significant push toward the next resistance level. Technical indicators such as RSI and MACD also hint at further bullish continuation if current levels hold.
Investor interest in JUV is steadily growing, with fundamentals and market sentiment aligning to support a short-to-mid-term rally. The project’s presence in the fan token sector, along with improving volume trends on major exchanges like Binance, reflects increasing confidence among traders and crypto investors.
Traders keeping a close eye on potential breakout setups should not overlook JUVUSDT. The current technical setup offers a promising opportunity with a favorable risk-reward ratio, especially if the bullish momentum accelerates from here.
✅ Show your support by hitting the like button and
✅ Leaving a comment below! (What is You opinion about this Coin)
Your feedback and engagement keep me inspired to share more insightful market analysis with you!

JUVUSDT: Descending Channel – 120%-130% Gains on Breakout!JUVUSDT is currently forming a Descending Channel pattern, and it is looking for a breakout in the near future. The Descending Channel is a bearish technical pattern where the price oscillates between parallel descending trendlines, indicating that the price is in a downtrend. However, the pattern often leads to a breakout to the upside once the price clears the upper resistance trendline. With strong volume backing the pattern, the breakout could signal the start of a major bullish move, potentially driving the price up by 120% to 130%+.
The good volume behind the Descending Channel formation shows that the market is actively watching this level. A breakout from a descending channel often leads to a sharp rally, as many traders will jump in once the price breaks through the upper resistance. The growing investor interest in JUVUSDT suggests that the market is becoming more optimistic about the potential upside. This increasing participation could fuel the breakout, pushing the price higher and leading to the anticipated 120% to 130%+ gain.
The potential for substantial gains in JUVUSDT becomes more apparent as the price nears the breakout point. The Descending Channel pattern is typically followed by a reversal, especially when the price breaks through the resistance and gains momentum. If JUVUSDT can maintain strength at these levels and break above the upper trendline of the channel, a bullish phase could begin, driving the price to new highs. With the increasing volume and investor interest, the projected 120% to 130%+ gain is within reach.
Traders should monitor the price closely as it approaches the resistance trendline, looking for confirmation of the breakout. A successful breakout above the Descending Channel could result in a swift upward movement, providing significant returns for those who position themselves ahead of the move. The combination of a clear technical setup, strong volume, and growing investor interest makes JUVUSDT a prime candidate for those seeking high-potential trades.
✅ Show your support by hitting the like button and
✅ Leaving a comment below!
Your feedback and engagement keep me inspired to share more insightful market analysis with you!

#JUV/USDT#JUV
The price is moving in a descending channel on a 1-day frame upwards and is expected to continue
We have a trend to stabilize above the moving average 100 again
We have an upward trend on the RSI indicator that supports the rise by breaking it upwards
We have a support area at the lower limit of the channel at a price of 1.45
Entry price 1.70
First target 1.94
Second target 2.14
Third target 2.43

#JUV/USDT: Bollinger Band breakout🔸 Hey traders, we've identified a Bollinger Band breakout on the $JUV / $USDT chart. The price has moved outside of the upper Bollinger Band, which can indicate a potential bullish trend. The next resistance key levels are at 3.06 | 3.19 | 3.42 and the major support zones are respectively at 2.83 | 2.73 | 2.5. We may consider buying at the current price zone 3.4 and targetting higher levels.
📊 Technical Metrics Index Summary:
⎿ Current price ⌁ 3.4 ₮
⎿ 24h Change: 🚀 7.595%
⎿ 24h Volume: 1,475,496.451 ₮
⎿ Oscillators: BUY
⎿ Moving Averages: STRONG_BUY
Welcome to the home of charting big: TradingView
Benefit from a ton of financial analysis features, instruments and data. Have a look around, and if you do choose to go with an upgraded plan, you'll get up to $30.
Discover it here


