KAITO/USDT | Low-Risk Setup with 125%+ Upside Potential🚀 Trade Setup Details:
🕯 #KAITO/USDT 🔼 Buy | Long 🔼
⌛️ TimeFrame: 1D
--------------------
🛡 Risk Management (Example):
🛡 Based on $10,000 Balance
🛡 Loss-Limit: 1% (Conservative)
🛡 The Signal Margin: $634.52
--------------------
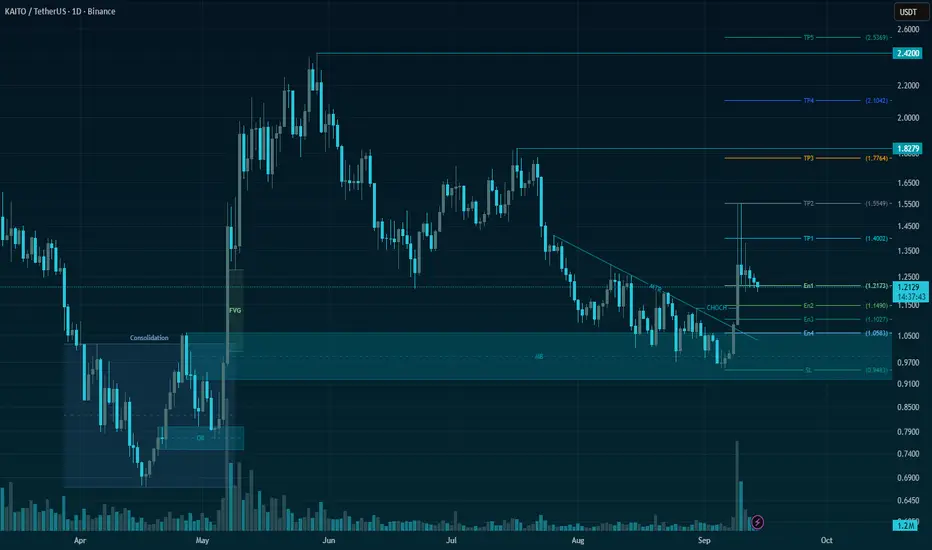
☄️ En1: 1.2173 (Amount: $63.45)
☄️ En2: 1.149 (Amount: $222.08)
☄️ En3: 1.1027 (Amount: $285.53)
☄️ En4: 1.0583 (Amount: $63.45)
--------------------
☄️ If All Entries Are Activated, Then:
☄️ Average.En: 1.1257 ($634.52)
--------------------
☑️ TP1: 1.4002 (+24.38%) (RR:1.55)
☑️ TP2: 1.5549 (+38.13%) (RR:2.42)
☑️ TP3: 1.7764 (+57.8%) (RR:3.67)
☑️ TP4: 2.1042 (+86.92%) (RR:5.52)
☑️ TP5: 2.537 (+125.37%) (RR:7.95)
☑️ TP6: Open 🔝
--------------------
❌ SL: 0.9483 (-15.76%) (-$100)
--------------------
💯 Maximum.Lev: 3X
⌛️ Trading Type: Swing Trading
‼️ Signal Risk: 🙂 Low-Risk! 🙂
--------------------
🔗 www.tradingview.com
❤️ Your Like & Comments are valuable to us ❤️
Kaitoanalysis
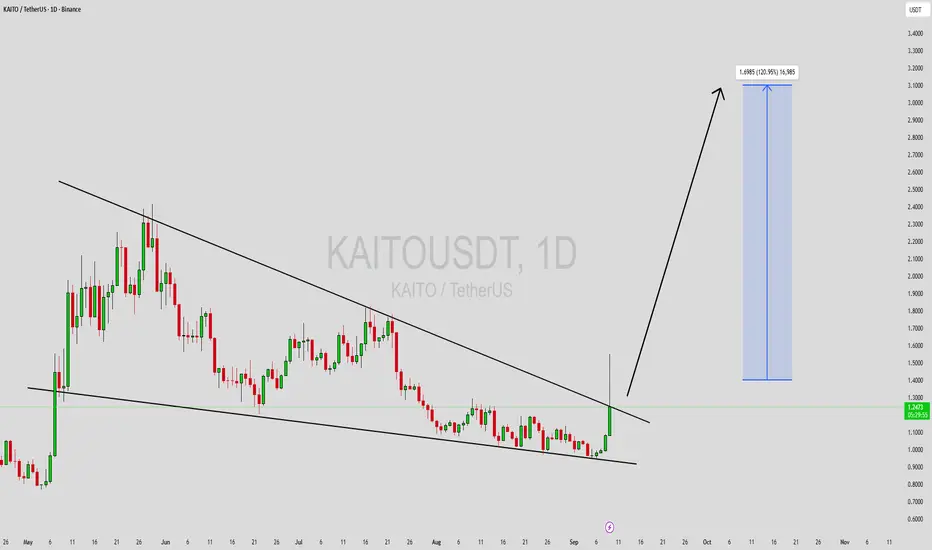
KAITOUSDT Forming Falling WedgeKAITOUSDT is currently forming a falling wedge pattern, which is widely recognized as a bullish reversal signal in technical analysis. The narrowing range of price action reflects declining selling pressure, while strong buying interest is gradually emerging. With trading volume showing healthy activity, the setup points toward a potential breakout, with expected gains in the range of 90% to 100% once key resistance levels are surpassed.
The falling wedge often indicates market accumulation, as investors and traders position themselves ahead of an upward breakout. For KAITOUSDT, this structure suggests that momentum could shift dramatically in favor of the bulls, pushing price into a strong rally. The combination of healthy volume and favorable chart structure enhances the reliability of this bullish setup.
Investor sentiment toward this project is also increasing, reflecting growing confidence in both its long-term potential and near-term trading opportunities. This rising interest aligns with the technical signals, further strengthening the possibility of a significant upward price move.
In conclusion, KAITOUSDT is poised for a potential breakout as it nears the end of its falling wedge pattern. With a projected gain of 90% to 100% and increasing investor participation, this setup could present a powerful trading opportunity for market watchers.
✅ Show your support by hitting the like button and
✅ Leaving a comment below! (What is You opinion about this Coin)
Your feedback and engagement keep me inspired to share more insightful market analysis with you!
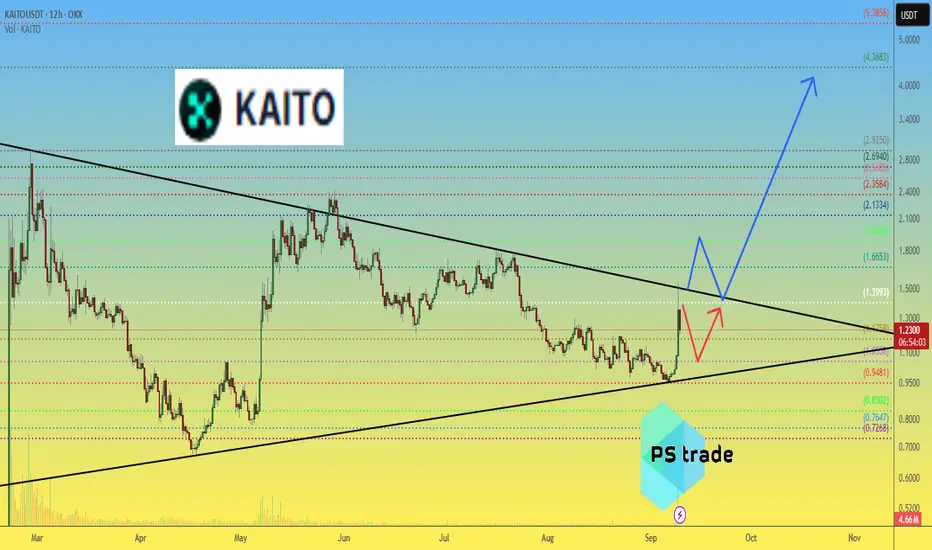
KAITO price analysis📊 The chart of OKX:KAITOUSDT suggests consolidation is coming to an end.
Historically, such phases often precede a strong breakout move 🚀
Key question for traders:
▪️ Would you take profits at ❤ $2 🔥 $3 👍 $5 or hold for a much higher target?
Your insights matter — share your view in the comments 👇
It will be interesting to compare different strategies within the community.
🧠 DYOR | This is not financial advice, just thinking out loud.
______________
◆ Follow us ❤️ for daily crypto insights & updates!
🚀 Don’t miss out on important market move
Signals Are Lining Up for a KAITO Breakout! Key Levels to WatchYello, Paradisers! Are you watching what just happened with #KAITO? Because this could be the early phase of a massive reversal after weeks of correction, and the risk-reward setup is getting too attractive to ignore…
💎After a strong bullish rally, KAITO entered a classic falling wedge correction, a bullish continuation pattern. Now, the price is approaching critical levels and beginning to show signs of strength, printing a bullish divergence on the RSI.
💎Recently, KAITO tested a major support zone between $1.200 and $1.250, and reacted positively. Even more promising, price action is shaping a potential morning star pattern, a powerful reversal signal, right at this demand zone.
💎#KAITOUSDT looks primed to retest the falling wedge resistance at $1.40. This is the first big hurdle, and if bulls manage to hold strength, price could quickly see momentum push price towards $1.60–$1.70, a heavy resistance area where aggressive profit-taking is expected.
💎If the wedge breakout confirms, the broader structure suggests that KAITO has the potential to run all the way to $2.00–$2.10. That’s not just a psychological level, it also marks the pattern target and aligns with the 50% Fibonacci retracement of the prior downtrend.
Paradisers, strive for consistency, not quick profits. Treat the market as a businessman, not as a gambler.
MyCryptoParadise
iFeel the success🌴

KAITO COIN PRICE ANALYSIS AND POSSIBLE TRADE IDEAS !!$KAITO Coin Update!!
• Currently Overall Short term Structure look bearish🚨
• But if you want build quick scalp on it then you can take risk on its local support areas that are mentioned on a chart with Tight SL🚨
Warning : That's just my analysis DYOR Before taking any action🚨
