Kaspa is coiling: June–July could decide everythingFor those still watching Kaspa, the technicals suggest the next upside move is likely around June–July.
I’m currently tracking two scenarios. If KAS holds the $0.028 support, the move higher should remain on schedule. However, if that level is lost, price could rotate down toward $0.015, which would push the volatility expansion out to late July–early August.
With these apexes in mind, this setup still provides a solid window for accumulation ahead of the next major move. Keep these levels on watch.
Kaspausdt

KAS/USDT at a Critical Point — Break or Bearish Continuation?On the 1D timeframe, KAS/USDT is still moving within a clear bearish trend structure since the peak around 0.118–0.115. Price continues to form lower highs and lower lows, confirmed by a well-respected descending trendline (yellow line) acting as a major dynamic resistance.
Currently, price is trading around 0.049–0.050, attempting to form a minor higher low after bouncing from the demand / swing low area at 0.036–0.038.
---
Market Structure & Technical Pattern
Primary Trend: Bearish (Lower High – Lower Low)
Main Pattern:
Descending Trendline / Bearish Structure
→ Indicates sustained selling pressure since August.
Recent Price Action:
A technical rebound / dead cat bounce is in progress, but there is no confirmed trend reversal yet.
Key Support & Resistance Levels:
Strong resistances:
0.0585 – 0.0646 – 0.0705 – 0.0815
Major supply zone:
0.0899 – 0.105 – 0.114
Important supports:
0.0490 – 0.0430
Critical support (range low):
0.0360
---
Bullish Scenario (Reversal / Recovery Setup)
The bullish scenario becomes valid only if price breaks and closes decisively above the descending trendline.
Bullish Confirmation:
Breakout and daily close above the trendline
Bullish continuation candle
Ideally supported by increasing volume
Upside Targets:
🎯 0.0585 (nearest resistance)
🎯 0.0646
🎯 0.0705
🎯 0.0815 (key level for medium-term trend reversal confirmation)
A sustained hold above 0.0815 would invalidate the current daily bearish structure and open the door for a medium-term bullish reversal.
---
Bearish Scenario (Rejection / Downtrend Continuation)
If price fails to break the trendline and forms a clear rejection or bearish engulfing pattern, this would signal the formation of a new lower high.
Bearish Confirmation:
Strong rejection at the trendline
Daily close back below 0.049
Breakdown of minor structure
Downside Targets:
🔻 0.0430
🔻 0.0390
🔻 0.0360 (major demand & key swing low)
A clean breakdown below 0.0360 would increase the risk of further downside continuation.
---
Conclusion
KAS/USDT is currently trading in a critical decision zone, positioned between a potential early reversal and continued bearish momentum.
The descending trendline remains the key level to watch.
➡️ Not bullish until a confirmed breakout occurs.
➡️ Bearish risks remain as long as price stays below the trendline.
Waiting for a clear price reaction around the trendline is strongly recommended before making major trading decisions.
---
#KAS #KASUSDT #Kaspa #CryptoAnalysis #TechnicalAnalysis #PriceAction #Downtrend #Trendline #SupportResistance #DailyChart #Altcoin #BearishMarket #PotentialReversal

Kaspa road to yearly openI think MEXC:KASUSDT can bounce at least in middle term to yearly open 2025 + the same level its a first big liquidity pool!
On left side you can see pure 3 drives pattern! So congrats everyone who out in 2024 Because when on weekly tf after 11000% gains any asset form this pattern its so rare can move higher! Usually its a bearish sign!
We already sweep sell side liquidity and close first main M fvg! But like usual we have a most possible 2 scenarios!
- Negative we can drop to next m fvg and only after that bounce to yearly open
- Positive hold the line now close W fvg and after small retest going to yearly 2025 open next year!

Breaking: Kaspa ($KAS) Surge 20% Today Kaspa ( CSE:KAS ) Surge 17% today amidst Network upgrade boosts.
Kaspa Breaks Through Momentum Wall as Network Confidence Builds
CSE:KAS has pushed up nearly 20% in the last 24 hours, reclaiming the $0.06 zone with surprising strength after several days of tight consolidation. The move seems driven more by conviction: rising liquidity, steady miner participation, and the continued narrative around #Kaspa 's blockDAG throughput advantage are giving it a fundamentally supported lift.
The $0.13 axis is the resistant point CSE:KAS needs to break to cement a move to the $.0.50 pivot. However, failure to break that region will resort to consolidation to the base of the support point.
What Is KASPA (KAS)?
Kaspa is a fast, scalable Layer-1 cryptocurrency built on proof-of-work (PoW) and powered by the GHOSTDAG protocol — a novel consensus mechanism that extends Nakamoto’s original design. Unlike traditional blockchains that discard competing blocks, GHOSTDAG allows parallel blocks to coexist and orders them within a Directed Acyclic Graph (blockDAG), enabling high throughput while preserving decentralization and security. Kaspa currently processes 10 blocks per second, with a long-term goal of scaling to 100 blocks per second, offering confirmation times limited only by internet latency.
Kaspa Price Data
The Kaspa price today is $0.059932 USD with a 24-hour trading volume of $122,411,751 USD. Kaspa is up 15.10% in the last 24 hours. The current CoinMarketCap ranking is #47, with a market cap of $1,615,781,305 USD. It has a circulating supply of 26,960,329,287 KAS coins and a max. supply of 28,704,026,601 KAS coins.

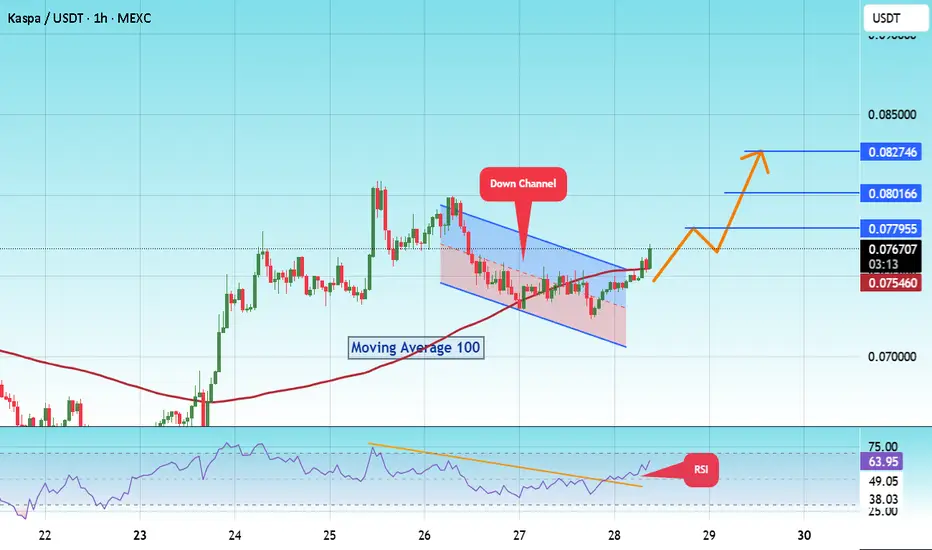
$KASUSDT Breaks Trendline #KAS
The price is moving within a descending channel on the 1-hour frame and is expected to break and continue upward.
We have a trend to stabilize above the 100 moving average once again.
We have a downtrend on the RSI indicator that supports the upward break.
We have a support area at the lower limit of the channel at 0.071500, acting as strong support from which the price can rebound.
Entry price: 0.075917
First target: 0.077955
Second target: 0.080166
Third target: 0.082746
To manage risk, don't forget stop loss and capital management.
When you reach the first target, save some profits and then change the stop order to an entry order.
For inquiries, please comment.
Thank you.
KAS/USDT Analysis (4H/1H)1️⃣ 🟢 KAS/USDT
KAS/USDT found a bottom at 0.0831 USDT and is now tracing a quick five-wave rally. A clean 4H candle close above 0.0875 USDT flips the bias bullish. First target: 0.0901 USDT. 🚀✨
2️⃣ Wave Structure
• Wave (1) peaked near 0.0872 USDT
• Wave (2) held at 0.0831 USDT (strong flip)
• Wave (3) climbed toward 0.0880 USDT
• Wave (4) pulled back to 0.0862 USDT (higher low!)
• Wave (5) projects up to 0.0925–0.0930 USDT once 0.0875 breaks
3️⃣ Key Levels
• 0.0831 USDT – Wave (2) support (pivot) ✅
• 0.0862 USDT – Wave (4) higher-low 💪
• 0.0875 USDT – 4H trendline resistance ⚠️
• 0.0877–0.0880 USDT – resistance zone (former support)
• 0.0901 USDT – first profit zone 🔥
• 0.0925–0.0930 USDT – Wave (5) extension 🎯
4️⃣ Indicators
• 4H MACD: still slightly negative but histogram flattening → bears weakening
• 1H MACD: just crossed bullish → short-term upside momentum ✅
• If 1H MACD stays positive as price hits 0.0875, expect a quick breakout
5️⃣ Trade Plan
• Entry: Wait for a 4H candle close above 0.0875 USDT. Confirm on 1H that price stays above.
• Long near 0.0877–0.0880 USDT.
• Stop Loss under 0.0855 USDT (below Wave (4) at 0.0862).
• TP 1: 0.0901 USDT (take 50% off).
• TP 2: 0.0925–0.0930 USDT (exit remaining).
6️⃣ Invalidation
If price closes below 0.0831 USDT on 4H, the bull count fails. Risk shifts down toward 0.0796 USDT. 🚨
7️⃣ Aggressive Entry (ADHD-Friendly Tip)
• Start a small long at 0.0862–0.0864 USDT (Wave (4)).
• Tight stop under 0.0855 USDT.
• Add more once 0.0877 USDT flips.
8️⃣ Quick Signals to Watch
• 4H close > 0.0875 USDT → GO! 🟢
• 1H candle stays above 0.0875 USDT → Confirm!
• 1H MACD histogram positive → Keep it rolling!
9️⃣ Bullmaster Conclusion
“KAS/USDT shows textbook 5-wave structure off the 0.0831 pivot. With a higher-low into 0.0862 and bullish MACD on the 1 hour, the path of least resistance is up, provided we break the 4 hour descending trendline at 0.0875–0.0880. Our first target is 0.0901, where momentum may pause, but a sustained rally could carry us into the 0.0925–0.0930 zone. A stop under 0.0855 protects the setup—bulls look ready to flip control.”
🔟 Next 8 Hours (Zoomed-In OR in a nutshell )
• Watch for 1H MACD staying green → fuels the bounce into 0.0875
• If 1H price holds > 0.0875, it’s a go→ 0.0901 then 0.0925!
• If price dips back under 0.0862 on 1H → abort mission; bears still in charge.
Let’s keep it simple, stay focused, and ride those bullish waves! 🌊🐂✨

KAS to $3.50 Long TermKaspa has a bright future as a robust blockdag.
Weekly long-term targets $0.75, $1.75, $3.50
Short term resistances on the chart

KASPA price scenario dec 16 2024KASPA price scenario dec 16 2024
Kas has still some work to do to break out up the channel in my opinion

KASUSD - Bull Continuation Nice curved trend that i think price will break out of and move high
Daily chart
A Very bullish coin

$KAS broke major support and could face a significant drop!CRYPTO:KASUSD has been experiencing steady declines after failing to sustain higher levels over the past few months. It recently broke a critical major support trendline, signaling the potential for further downside.
This breakdown occurred after several attempts to push higher were rejected, especially around the $0.20 range, which had acted as strong resistance in the past.
The break below the trendline, which has held strong for months, signals that selling pressure is intensifying.
We're now closely watching how it reacts within the Supply Zone around $0.1251 - $0.1291. A rejection from here could accelerate the move downward.
Key Levels to Watch:
Short Entry Idea 1: Rejection from $0.1291
Short Entry Idea 2: Rejection from 4H SIBI at $0.1257
TP1: $0.1183
TP2: $0.1079
TP3: $0.0915
Expect further downside if CRYPTOCAP:KAS fails to reclaim these levels soon, as we could see it test Major Demand Zones below.
------------
Disclaimer:
This analysis is for educational and informational purposes only. It is not financial advice, and you should not take it as such. Always conduct your own research and due diligence before making any trading decisions. Markets are highly volatile, and following any chart blindly can lead to significant losses. Trade responsibly and use risk management strategies.

Will Kasia stay in the support zone?Hello everyone, let's take a look at the Kaspa chart in USDT pair, taking into account the time frame of one day. you can see here how the price has returned to the very important support zone from $0.177 to $0.0931, this is a very important zone because it is the last place of support before a strong price drop.
You can see here how the price is struggling to maintain the level in the triangle, from which we can see candles that are trying to pay off the triangle with the bottom, then the last support line is visible.
Looking the other way, when the price starts to rise again, first of all you can see the resistance at the level of $0.144, then the level at the price of $0.168 will be important, and then the very important resistance at the price of $0.208, which previously turned out to be the price peak.

Countdown to December: KASPA’s Potential Key Entry!It makes sense for this price trajectory to be fulfilled by December. It would be a great opportunity for those who missed the entire run in 2023—I only caught a small portion of it myself.
Regardless, I’ll start adding to a position type trade below 11c. If it reclaims 14c before moving lower, I may consider a deviation entry.
So, we have two scenarios now. It’s time to wait and see which one triggers first.
CRYPTOCAP:KAS

Kaspa | KAS (100X in Bear Market!)If Kas can jump 10000% in bear market, what will happen in bull market then ?
Well first of all Respect the pump and the beautiful chart pattern because while all world class banks dump like Ponzi scheme there are many solid projects in crypto that shines and shows crypto is the future of the finance and technology.
Kas still didn't list on big exchanges which means there are more liquidity and attention on the way but right now you should know the best case scenario for a token with 320 million dollars market cap is a billion which means almost 300% from here so don't do YOLO and jump in with hype
if you are in good gain then take some profit and have some fun and if you wonder whats the next Kaspa and crypto gem then you can count on our experts

KASPA trading plan and technical analysis (4h chart frame)Technical Analysis + trade plan by Blaž Fabjan
Pattern: Falling Wedge
The chart shows a clear Falling Wedge pattern, which is typically a bullish reversal signal. This pattern is characterized by a downward sloping resistance and support line that converges. A breakout from this pattern often leads to a price surge.
The breakout is expected as the price is nearing the end of the wedge and has touched the support line multiple times.
Support and Resistance:
Resistance Line: The upper boundary of the wedge acts as a resistance level. A successful breakout would target higher price levels.
Support Line: The lower boundary of the wedge acts as support and has held several times.
Indicators:
RSI (Relative Strength Index): The RSI is around 38.57, indicating that the asset is close to oversold territory. A bounce is likely once the RSI dips further or consolidates.
Stochastic RSI: Currently, the Stochastic RSI is at 30.08 and 37.92. This also indicates a potential reversal from oversold conditions, supporting the bullish outlook.
Volume: The volume has been declining, which is typical before a breakout. Watch for an increase in volume as confirmation of a breakout.
VMC Cipher B: The indicator suggests that the downward pressure is easing. A shift towards green momentum waves could signal the start of the upward trend.
HMA Histogram: This indicator is showing a very slight bullish crossover, reinforcing the potential for a reversal.
Price Action:
Price is currently consolidating just above the support of the wedge. This creates a critical juncture, where the next few candles could determine the breakout direction.
If the price breaks out of the wedge, expect a retest of the former resistance turned support before moving higher.
Trading Plan by Blaž Fabjan:
Entry:
Aggressive Entry: Enter at the current price (~$0.1366) anticipating an imminent breakout from the falling wedge.
Conservative Entry: Wait for a confirmed breakout above the resistance level of the wedge (around $0.145), followed by a successful retest before entering a long position.
Stop Loss:
Set a stop loss slightly below the wedge support, around $0.127 to $0.129, to limit downside risk in case of a false breakout or continued downtrend.
Targets:
First Target (T1): $0.160 - This target aligns with the previous high and key resistance.
Second Target (T2): $0.180 - If the momentum continues, this level could be reached, representing a measured move from the wedge breakout.
Third Target (T3): $0.200 - For more aggressive traders looking to hold longer, this level represents a strong psychological resistance.
Risk Management:
Position sizing should be calculated based on your risk tolerance, but a 2-3% risk per trade is generally recommended. Ensure you are not overexposed.
Use a trailing stop once the price reaches the first target to lock in profits while allowing for further upside.
Confirmation:
Watch for an increase in volume and strong bullish candles breaking through the wedge's resistance line to confirm the breakout.
If the price fails to break out of the wedge or closes below the support, the pattern is invalidated, and short-term bearish action could continue.
Conclusion:
The falling wedge pattern and supporting indicators suggest a potential bullish breakout in the near term. A well-planned entry near the breakout, combined with a proper stop-loss and profit targets, offers a favorable risk-reward ratio for this setup. Be cautious of potential false breakouts and follow through with the technical signals closely.

KAS zones for correctionKAS idea shared before but here is small updates MEXC:KASUSDT
Possible Targets and explanation idea
➡️W tf. Basic 3 drive pattern on a Weekly chart - bearish pattern
➡️M fvg like a magnet for correction
➡️Most likely we will test buy line on a W tf. and will close at least 50% fvg
➡️Leave 2 main liquidity pools around M fvg
➡️Money inflow indicator Bearish div marked on a chart
➡️Money outflow on a W chart
Hope you enjoyed the content I created, You can support with your likes and comments this idea so more people can watch!
✅Disclaimer: Please be aware of the risks involved in trading. This idea was made for educational purposes only not for financial Investment Purposes.
---
• Look at my ideas about interesting altcoins in the related section down below ↓
• For more ideas please hit "Like" and "Follow"!

KASPA TECHNICAL ANALYSIS + TRADE PLAN 2024 BY BLAŽ FABJANTA+TRADE plan by Blaž Fabjan
Descending Triangle Formation:
A clear descending triangle pattern is observed with lower highs (resistance) and a horizontal support around the $0.14 level. This is typically a bearish pattern, but in some cases, it can lead to a breakout to the upside.
The current price is close to the triangle’s apex, indicating a potential breakout soon.
Support and Resistance Levels:
Resistance: The downtrend resistance line is around $0.145 to $0.15. A break above this level would indicate a bullish reversal.
Support: The horizontal support around $0.14 has been tested multiple times. If the price breaks below this, it could trigger a further decline toward the next major support at around $0.13.
Indicators:
Volume Moving Average Convergence Divergence (VMAC): There are visible divergences, suggesting that momentum might be building. The overall indicator seems to support a bullish divergence.
Relative Strength Index (RSI): The RSI is near the oversold region (~35.49). This suggests that selling pressure might be easing, and a reversal could be imminent.
Stochastic Oscillator: The stochastic is near oversold levels, which often precedes a bullish move if it crosses upward.
Hull Moving Average (HMA): The histogram is showing signs of reduced bearish momentum, with green candles suggesting a possible bullish shift.
Trading Strategy
Bullish Scenario (Breakout to the upside):
Entry: Consider entering a long position on a confirmed breakout above $0.145-$0.15 (the resistance line). This would signal the end of the descending triangle and likely lead to upward momentum.
Target 1: $0.17, which would align with the projected move from the triangle breakout.
Target 2: $0.19, a previous high and psychological resistance level.
Stop Loss: Place a stop loss below $0.138 to minimize risk in case of a false breakout or bearish continuation.
Bearish Scenario (Breakout to the downside):
Entry: If price breaks below the $0.14 support level with volume, it could signal a bearish continuation. Short positions could be considered in this case.
Target 1: $0.13, the next major support.
Target 2: $0.12, the next significant psychological support level.
Stop Loss: A stop loss above $0.145 (above the resistance) would minimize risk if the trade reverses.
To sum up:
The current technical picture is at a critical point with a descending triangle suggesting a potential breakout in either direction. The oversold conditions in the RSI and stochastic, along with possible bullish divergence, lean towards a bullish breakout. However, be prepared for a downside if the $0.14 support fails.
Monitoring the volume during the breakout is crucial to confirm the direction and strength of the move.

Kaspa technical analysis + trade plan (27.09.2024) by BFTechnical Analysis + trade plan by Blaž Fabjan
Chart Pattern: Falling Wedge (Uptrend Bias)
A falling wedge pattern is present, which typically signals a bullish reversal. In this case, the price seems to be nearing the breakout point of the wedge. The breakout direction is upwards, and this pattern typically leads to a price increase if confirmed.
Support and Resistance Levels
Resistance Line: The upper line of the falling wedge, acting as dynamic resistance.
Support Line: The lower line of the wedge, acting as dynamic support.
Volume
Volume levels indicate significant interest, especially when approaching a potential breakout zone. The volume profile shows that recent trading sessions have been accompanied by a spike in activity, which can be a good sign for momentum.
Indicators
VMC Cipher B (Divergences): This indicator shows divergence signals, indicating possible trend reversals. It appears to be bullish with green dots forming at key points, suggesting an upward move.
RSI (Relative Strength Index): The RSI is around 54.79, which is neutral but slightly tilting towards bullish. It suggests that the market isn't overbought or oversold.
Stochastic Oscillator: Around 75.24, this indicator shows a bullish cross, indicating momentum might be shifting upward, but it's approaching the overbought zone.
HMA+ Histogram: Appears to be indicating short-term momentum change as the trend might be shifting upwards.
Price Prediction/Target
If the falling wedge plays out as expected, the price could target higher levels, breaking the $0.165-$0.170 range. The chart suggests a further upward target in the next phase, as highlighted by the projected arrow and airplane symbol.
Trading Plan
Entry Strategy:
Buy on Breakout: If the price breaks above the resistance line of the falling wedge (around $0.166 or slightly higher), consider entering a long position.
Confirmation: Wait for at least a 4-hour candle close above the resistance to confirm the breakout.
Aggressive Entry: You could also enter once the price reaches near the support line but remains cautious if the breakout has not been confirmed.
Stop Loss:
Place a stop loss below the recent swing low or just under the support line of the wedge (around $0.160). This will protect against a potential fake breakout.
Take Profit Targets:
Short-term Target: $0.175 - $0.180 (the first major resistance after breakout).
Medium-term Target: $0.190 and beyond, as indicated by the chart.
Risk Management:
Avoid risking more than 2-3% of your total portfolio on this trade.
Adjust your position size based on the stop-loss distance and your risk tolerance.
Monitoring:
Keep an eye on the volume and the RSI levels. If RSI enters the overbought zone (above 70), consider reducing your position or securing profits.
Watch for any signs of a failed breakout, as this could lead to a sharp drop back into the wedge pattern.
Exit Strategy:
If the price fails to break out and starts to drop below the support line, exit the trade.
If the price hits the overbought zone on both RSI and Stochastic, it might be wise to secure profits at key levels mentioned.
Conclusion:
The overall outlook based on the chart suggests a bullish breakout is likely if the falling wedge pattern completes. This offers a good risk-to-reward ratio for a long position if managed carefully with proper stop losses and monitoring of key indicators like volume and RSI.

KASPA USDT 4H CHART TA+price predictionHi! Today I will analyze Kaspa / Usdt chart on 4h timeframe and I will look up what's following in near future - price prediction. TA by Blaž Fabjan
The descending triangle is highlighted, signaling a potential bearish continuation or reversal.
1. Resistance is marked on the chart, suggesting that the price is struggling to break above that level.
2. Support is seen near the base of the triangle. If this support level breaks, a more significant downside is expected.
Indicators:
VMC Cipher Divergences: Suggesting a mix of bullish and bearish divergences. Current momentum appears bearish, as evidenced by the divergences. However, there could be a potential reversal, depending on the market structure.
RSI (Relative Strength Index): Sitting near the lower range (~42.77), which suggests that the asset is not yet oversold, but it's approaching a level that could present a buying opportunity if oversold conditions are met.
Stochastic RSI: It appears oversold (~42.35), indicating that a reversal or upward momentum might be due soon.
Price Action:
The chart shows a potential downward move towards the lower boundary of the triangle, which is marked with an emoji representing the target zone. A bounce from this zone may lead to a bullish breakout, as indicated by the upward arrow.
If the price falls below the triangle, the next support is likely around the $0.1500 level (as per the emoji), with a possible further decline if that level is breached.
Volume:
The volume appears stable, but no significant spikes indicate a strong trend change or momentum yet. Low volume during a potential breakdown would suggest a weaker move, while a volume spike could confirm the breakout/breakdown.
Trading Plan
Short-Term Outlook (Bearish Continuation):
Entry: If the price breaks below the current support at ~$0.1600, short positions could be considered, targeting the next support near $0.1500 or lower.
Stop Loss: Set just above the resistance level, around $0.1700, to minimize risk.
Target: Short-term targets would be $0.1500 (first support), potentially moving lower depending on market conditions.
Bullish Reversal (Medium- to Long-Term Outlook):
Entry: If the price bounces off support (as indicated by the chart), wait for confirmation of a reversal before entering. Look for a close above $0.1700 as a bullish sign.
Stop Loss: Set below the triangle's lower boundary at ~$0.1550.
Target: First target could be around $0.2100, following the chart’s indication of a potential sharp upward movement. Breakouts from descending triangles often lead to significant upward momentum.
Confirmation:
Wait for confirmation of direction either through volume increase or a clear breakout from the triangle. Trade cautiously within the triangle as price movements could be choppy.
In summary, the chart suggests a possible short-term bearish movement towards the $0.1500 level, followed by a potential bullish reversal. Watch for breakout confirmation and act accordingly based on the defined trading plan.

KAS/USDT Trading ScenarioThe KAS’s price chart continues to follow an upward trend, with the trendline successfully acting as a support level four times, indicating its significant strength. From a volume profile perspective, the current asset price is in a zone of heightened market participant interest, with a key volume level POC at $0.16833.
After the news about a potential Fed rate cut, a short-term correction is likely, as the market has probably already priced this event in. In this case, we may see sell-offs following the news release. However, in the long term, growth potential remains, with the trendline, once again being tested, serving as a possible reversal point.

KAS - Slightly bullish, make or break in the next few daysKAS - Slightly bullish. MACD coming back to neutral, despite recent selling pressure and bearish divergence. KAS is still staying within the larger bull channel and held at the 0.12 cent level, so I expect a possible bounce to 0.17 before coming back down to the 200 DMA. If we hold at the 0.14 level, I foresee KAS testing the shorter bull channel lower bound which is now resistance.
If KAS does not hold at the 0.14 level over the next few days, I expect it will test the bottom of the larger channel which is in the 0.12 cent range. In that case, it might bounce off the bottom of the channel keeping in the bullish structure but a death cross can push KAS out of that channel quickly on failure.

KASPA / USDT 4H TIMEFRAME MEXC TECHNICAL ANALYSISFalling Wedge Pattern:
The chart shows a falling wedge pattern, which is a bullish signal. This pattern suggests that the price might soon reverse and move upward.
Oversold Conditions:
The RSI and Stochastic RSI indicators are in the oversold zone. This typically means that the asset is undervalued and could see a price increase soon.
Volume Spike:
There's a noticeable increase in trading volume as the price reaches the bottom of the wedge. This suggests strong buying interest and supports the idea of an upcoming upward move.
Potential Price Target:
If the price breaks out of the wedge, it could move toward the $0.22 to $0.24 range, as shown by the projected arrow on the chart.
Conclusion:
The chart suggests a potential bullish reversal. If the price breaks above the wedge, it could lead to a significant upward move. Keep an eye on the breakout level and consider managing risk by setting a stop-loss below the recent low.
This analysis highlights the key factors indicating a potential price increase for the KAS/USDT pair.

Kaspa - BullishKaspa - Bullish. Kaspa has been green in a sea of red this past week, still very bullishon the daily with a healthy pullback.
-Tested the top of the long-term bullish channel which started 11/04/2023.
-Moving with the more recent bullish channel starting 5/1/24.
-Keeping with the long-term trendline with a healthy pullback to 0.18269 (keeping with trendline)
-Pullback from the highs of 0.2078 on 8/2/24, matching up with when it was overbought on the MACD.
-Pullback on 8/2/24 coincided with peak fear on the fear & greed index, coming out of peak greed zone toward neutral 8/3/24.
I think KASPA will hold at 0.1859, or possibly tag the bottom of the bullish channel (which it historically likes to do) at 0.1802 before moving to retest the top part of the long-term channel and advance out of that while in the short-term bullish channel to 0.2233. I especially think this will be the case if the wider crypto market is still bleeding on 8/3/24 when the US session gets started.
Invalidation would be if on 8/3/24 we see a sustained pullback below 0.1802.

KASPA - bullish market leaderi found this coin KASPA, decent market cap, not on binance and most importantly monthly and weekly green. great for swing long.
Wait for confirmations on weekly or pullback on support zones.
-Nav
