Early bear market bottom? Kaspa is bullish & ready to grow next!I like Kaspa very much right now and I can no longer say that a lower low is necessary down the road. You know some projects can detach completely from the rest of the market, many projects. This can be one of those.
The truth is that KASUSDT reached as low as July 2023 this week. That's basically an entire bullish cycle completely eradicated, nullified—reset.
What's to like? Where is the good news?
The good news is that Kaspa is trading at bottom prices. A major low came in recently and the week is closing green with a strong volume breakout, the highest volume since November 2025.
It all depends on how this bullish phase develops but a strong rise would reveal the start of a new uptrend. Say, if KASUSDT were to hit $0.19 in the coming months, this would be enough for the ensuing correction to end as a higher low, keeping the chart technically bullish.
Maybe a rise to $0.14 can also support a higher low. On the other hand, if the current move, the one that is starting just now, peaks at only $0.095 then we can expect a major crash right after with new lows, lower lows.
This wouldn't be bad either, it would simply mean better entry prices Q3 2026 in anticipation of years of growth. Remember, after Bitcoin's bear market bottom is in, the market will grow for years to come.
Ok. So Kaspa is bullish and ready to grow next. This is very easy to predict.
Thank you for reading.
Namaste.
KASUSDT

KAS/USDT at a Critical Point — Break or Bearish Continuation?On the 1D timeframe, KAS/USDT is still moving within a clear bearish trend structure since the peak around 0.118–0.115. Price continues to form lower highs and lower lows, confirmed by a well-respected descending trendline (yellow line) acting as a major dynamic resistance.
Currently, price is trading around 0.049–0.050, attempting to form a minor higher low after bouncing from the demand / swing low area at 0.036–0.038.
---
Market Structure & Technical Pattern
Primary Trend: Bearish (Lower High – Lower Low)
Main Pattern:
Descending Trendline / Bearish Structure
→ Indicates sustained selling pressure since August.
Recent Price Action:
A technical rebound / dead cat bounce is in progress, but there is no confirmed trend reversal yet.
Key Support & Resistance Levels:
Strong resistances:
0.0585 – 0.0646 – 0.0705 – 0.0815
Major supply zone:
0.0899 – 0.105 – 0.114
Important supports:
0.0490 – 0.0430
Critical support (range low):
0.0360
---
Bullish Scenario (Reversal / Recovery Setup)
The bullish scenario becomes valid only if price breaks and closes decisively above the descending trendline.
Bullish Confirmation:
Breakout and daily close above the trendline
Bullish continuation candle
Ideally supported by increasing volume
Upside Targets:
🎯 0.0585 (nearest resistance)
🎯 0.0646
🎯 0.0705
🎯 0.0815 (key level for medium-term trend reversal confirmation)
A sustained hold above 0.0815 would invalidate the current daily bearish structure and open the door for a medium-term bullish reversal.
---
Bearish Scenario (Rejection / Downtrend Continuation)
If price fails to break the trendline and forms a clear rejection or bearish engulfing pattern, this would signal the formation of a new lower high.
Bearish Confirmation:
Strong rejection at the trendline
Daily close back below 0.049
Breakdown of minor structure
Downside Targets:
🔻 0.0430
🔻 0.0390
🔻 0.0360 (major demand & key swing low)
A clean breakdown below 0.0360 would increase the risk of further downside continuation.
---
Conclusion
KAS/USDT is currently trading in a critical decision zone, positioned between a potential early reversal and continued bearish momentum.
The descending trendline remains the key level to watch.
➡️ Not bullish until a confirmed breakout occurs.
➡️ Bearish risks remain as long as price stays below the trendline.
Waiting for a clear price reaction around the trendline is strongly recommended before making major trading decisions.
---
#KAS #KASUSDT #Kaspa #CryptoAnalysis #TechnicalAnalysis #PriceAction #Downtrend #Trendline #SupportResistance #DailyChart #Altcoin #BearishMarket #PotentialReversal

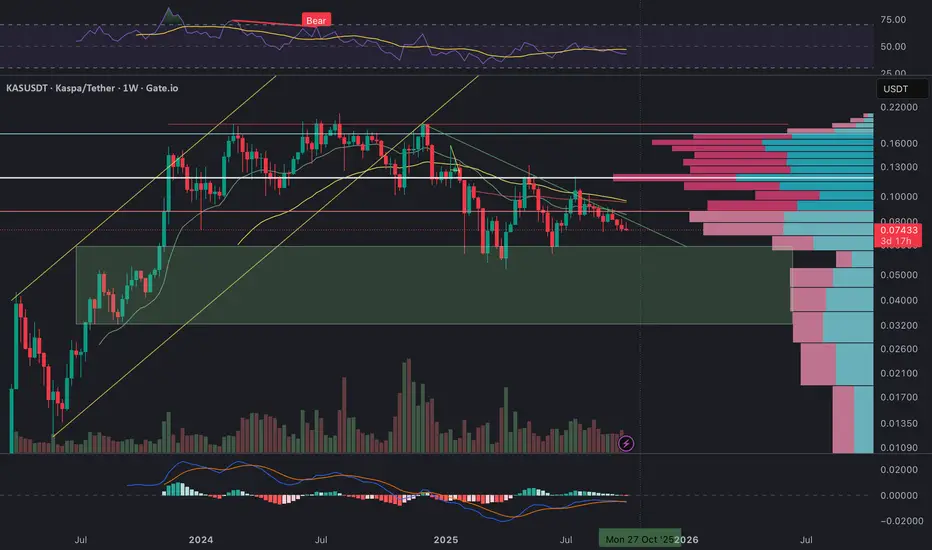
Kaspa road to yearly openI think MEXC:KASUSDT can bounce at least in middle term to yearly open 2025 + the same level its a first big liquidity pool!
On left side you can see pure 3 drives pattern! So congrats everyone who out in 2024 Because when on weekly tf after 11000% gains any asset form this pattern its so rare can move higher! Usually its a bearish sign!
We already sweep sell side liquidity and close first main M fvg! But like usual we have a most possible 2 scenarios!
- Negative we can drop to next m fvg and only after that bounce to yearly open
- Positive hold the line now close W fvg and after small retest going to yearly 2025 open next year!

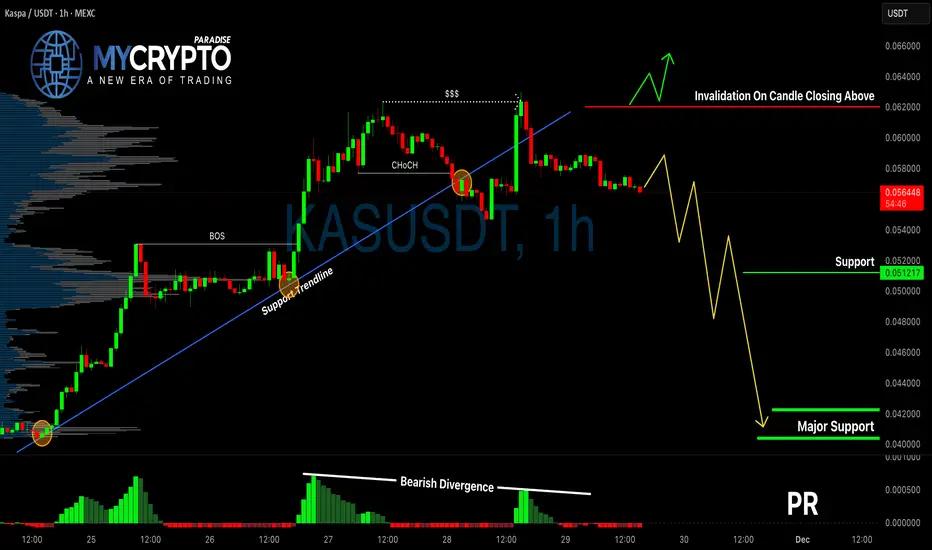
KASUSDT Breakdown Confirmed?Yello Paradisers, have you already positioned yourself on KASUSDT’s bearish move, or are you about to get trapped by a false bounce? The market just gave us a major clue, and ignoring it could cost you.
💎KASUSDT has officially broken below a critical supportive trendline, which was previously holding the structure intact. This breakdown wasn’t random—it came with a clean bearish CHoCH (Change of Character), and the MACD histogram is flashing a clear bearish divergence. These combined signals significantly increase the probability that this is not just a minor pullback, but the beginning of a more aggressive downside move.
💎From the current market level, there is already a straightforward 1:1 risk-reward opportunity on the table. However, if price pulls back toward the previous support (now resistance), that would offer a much better entry zone with improved risk-reward. But don’t jump in blindly—what we want to see at that level is a bearish candlestick confirmation. Without it, you're only guessing. With it, you’re trading with probability on your side.
💎On the flip side, if KASUSDT breaks out and closes decisively above the invalidation level, that would fully invalidate the current bearish thesis. In that case, it’s smarter to stay on the sidelines and wait for a new high-probability setup to form. This market doesn’t reward impulsive decisions—it rewards patience, discipline, and precision.
🎖Strive for consistency, not quick profits. Treat the market as a businessman, not as a gambler.
MyCryptoParadise
iFeel the success🌴
KASPA Update🚨📊 KASPA Update
KASPA buyers are testing the red resistance zone again 🔴
after getting rejected many times before.
This level has acted as a strong ceiling,
but now price is pushing into it with momentum,
so a possible breakout this time is on the table
if buyers continue to apply pressure.

KAS Update
🚨📊 KAS Update
KAS is approaching an important resistance zone 🔴,
but sellers are not in control this time.
Price is moving upward with strength,
and this next red zone will be the key level to watch.
KAS must break out above this resistance
to show a clean continuation toward higher targets.
Until that breakout happens,
price may face some slowdown at the resistance area.

KASPA can go much HIGHERAccording to the All time high at $0.19 there is a trendline for 5th wave and that could top out about $0.44 for KASPA

𐤊 $KAS KASPA Weekly Outlook: Testing the Final Line of DefenseKaspa has been consolidating for several months, drifting steadily lower within a well-defined descending channel after breaking down from the 2024 uptrend. Price is now hovering around a crucial support zone between 0.073 and 0.070 USDT, which also coincides with the lower boundary of the major demand region (highlighted in green).
From a structural point of view, KAS remains in a macro corrective phase. Momentum indicators are showing signs of exhaustion on the downside – the RSI is hovering near the 40 level and flattening out, while MACD has started to compress with a potential bullish crossover forming if buyers step in this week.
The Volume Profile clearly shows heavy supply between 0.10 – 0.12 USDT, marking this zone as the key resistance cluster that must be reclaimed to confirm any trend reversal. Until then, rallies into 0.081 – 0.085 are likely to face selling pressure.
Technically, this area around 0.074 USDT represents the “final line of defense” before a deeper retest toward 0.06 – 0.055 (the next historical demand pocket). However, if bulls manage to defend this support and push price back above the descending trendline and the 0.0815 zone, a medium-term reversal toward 0.095 – 0.10 could develop.
In short:
• Trend: Still bearish but approaching exhaustion
• Key Support: 0.073 – 0.070
• Immediate Resistance: 0.0815, then 0.090 – 0.095
• Macro Target (if breakout): 0.10 – 0.12
• Breakdown Target: 0.060 – 0.055
Volume and structure suggest we are near a make-or-break zone. A weekly close below 0.073 would confirm continuation of the downtrend, while a rebound above 0.081 could be the first real signal of accumulation before the next bullish leg.
KAS Market Update📊 CSE:KAS Market Update
Two potential entry / re-entry zones:
👉 First around $0.083927 🟢
👉 Second deeper entry around $0.077555 🟢
⚡ Wait for confirmation — both levels could offer strong bounce setups 🚀
⚡ Trade smarter, not hope 🔑

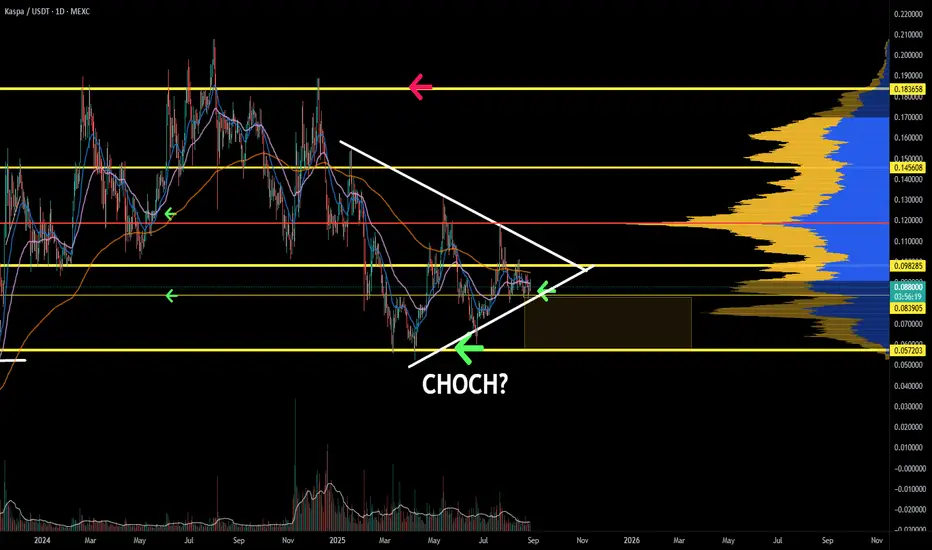
Kaspa in the trenches looking for its bottom. KAS is consolidating above the defined POI. If a proper CHOCH can be achieved here, we have likely touched the bottom. However, a BOS will bring the price down to the next extension.
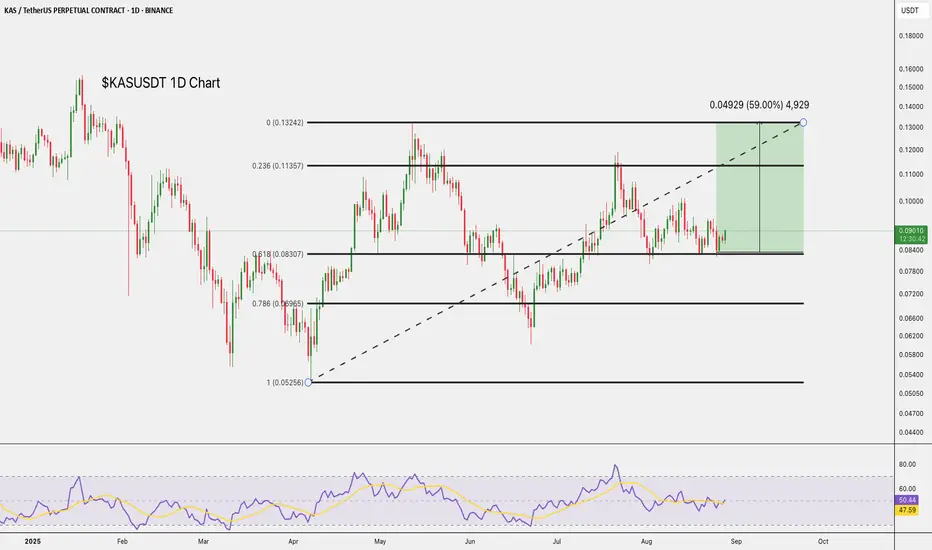
$KAS Poised for 59% Upside.CSE:KAS is holding above the $0.08403 support.
A bounce here could push it toward $0.10118 and possibly $0.13275, offering about 59% upside.
RSI is neutral, leaving room for momentum to build.
DYOR, NFA
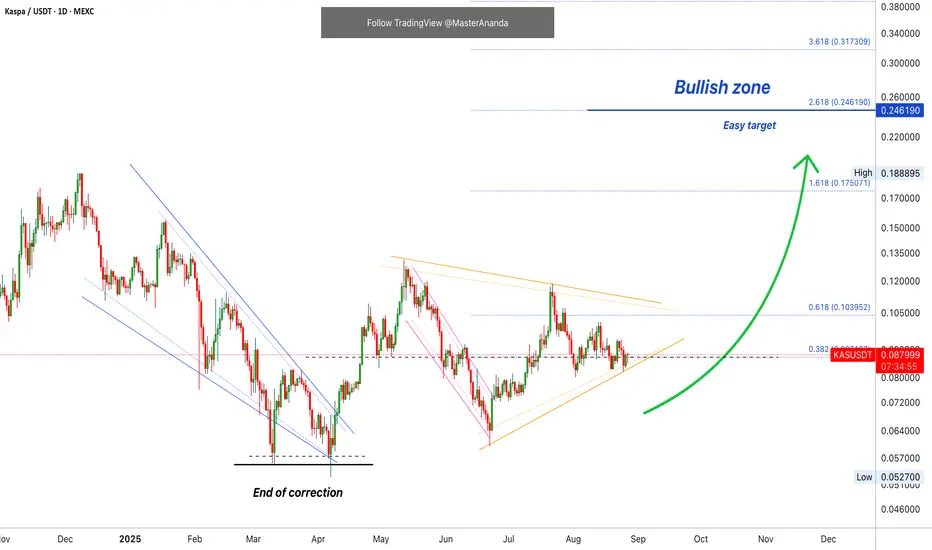
Kaspa · Futures Trade-NumbersHere we have the daily (D) Kaspa (KASUSDT) chart. To me is really important to start by knowing the market direction. I can start with a process of elimination.
An uptrend is not present because we don't have higher highs and higher lows.
A downtrend is not present because we don't have lower highs and lower lows.
Which one comes next?
A correction (downtrend) just ended and the market produced a bullish move as a bounce. The jump from the 7-April low and support to the high mid-May. That's the first move and that's change.
So we know the market is no longer in a downtrend and we know it produced a bullish jump.
What happens after this bullish jump? What happens after the May peak?
The market corrects but ends in a higher low. This is classic. I know these are the same signals but they work. It is basic and simple.
The retrace from May ended in a higher low in June and this reveals a bullish bias.
So we know we are in a transition. Not a downtrend but not an uptrend either, but we know the market is bullish because the last jump ended in a higher low. The last jump is being consolidated before additional growth.
This one can take up to 10X or even more. You have to choose your own level of margin of course. Full trade-numbers below:
_____
LONG KASUSDT
ENTRY: 0.083000 - 0.089000 (STOP: 0.082000)
TARGETS: 0.103952, 0.131119, 1.58286, 1.75071, 0.202222, 0.246190
_____
Thank you for reading.
If you enjoy the content, consider hitting follow. It only takes a minute and it makes the whole difference.
Namaste.
KAS Setup – Retest of Broken Resistance as SupportKASPA (KAS) has recently broken above a key resistance zone, and is now retesting that level as support — a classic bullish continuation signal.
📌 Entry Zone: $0.090 – $0.095
🎯 Targets:
• TP1: $0.105 – $0.12
• TP2: $0.13 – $0.15
• TP3: $0.17 – $0.19
🛑 Stop Loss: Just below $0.08
If the support holds, this area offers a low-risk, high-reward opportunity for spot traders targeting the next leg up.
📈 Always manage your risk. Wait for confirmation on lower timeframes if needed.

Kaspa Bullish · The Wait is Over · Ready to GrowWe have a very interesting situation here with the Kaspa chart, KASUSDT. There is no going back. Once the bottom is in, you know the next logical step is a change of trend. It can take some time before the low settles; the low is process not a one-day event. But here it settled already and this is all we need to know that the bullish bias is fully confirmed. You can now enter KASUSDT with lev while resting easy.
Good evening my fellow Cryptocurrency trader, I hope you are having a wonderful day.
The first low happened 10-March and then a lower and final low 7-April, also a technical double-bottom. Here Kaspa produces a small reaction and grows 150%. Notice that growing 150% in 30 days is small in the Crypto-world. If you were trading conventional markets, you would have to wait 10 years to get 70% growth.
Anyway, the initial bullish reaction to confirm the end of the correction goes into retrace and 16-June (the week), 22-June specifically, the market produces a higher low. This is the final retrace before maximum growth. I mean, there will be retraces and corrections in the future but the wave that is about to start now will not be 150%, it can be much bigger and last a lot longer, this is the 2025 bull market bullish phase. It will be a major wave.
This is just a friendly reminder to let you know, you can go all-in.
Thanks a lot for your continued support.
You will be happy with the results.
Namaste.

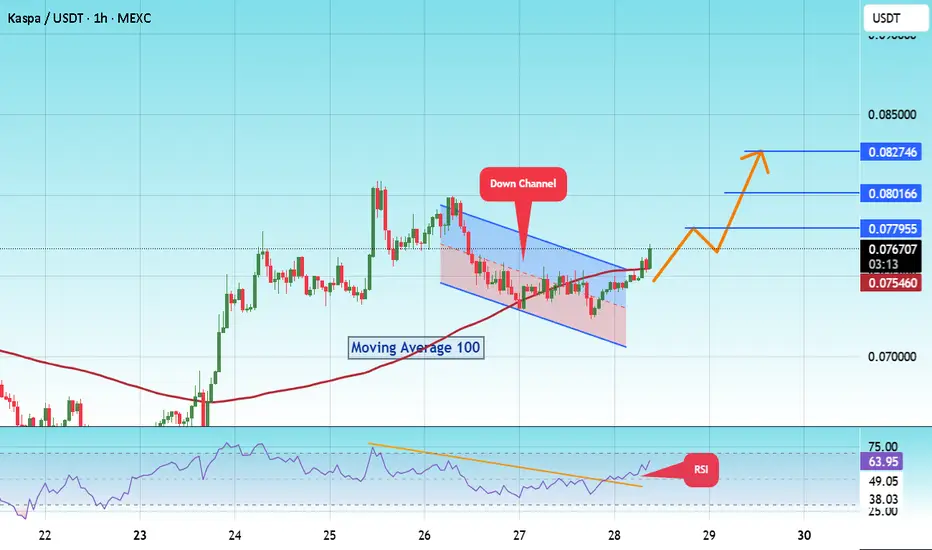
$KASUSDT Breaks Trendline #KAS
The price is moving within a descending channel on the 1-hour frame and is expected to break and continue upward.
We have a trend to stabilize above the 100 moving average once again.
We have a downtrend on the RSI indicator that supports the upward break.
We have a support area at the lower limit of the channel at 0.071500, acting as strong support from which the price can rebound.
Entry price: 0.075917
First target: 0.077955
Second target: 0.080166
Third target: 0.082746
To manage risk, don't forget stop loss and capital management.
When you reach the first target, save some profits and then change the stop order to an entry order.
For inquiries, please comment.
Thank you.
KAS IS TESTING RED RESISTANCE ZONE🚨 KAS Testing Red Resistance – Waiting for Breakout 📈
KAS is currently testing the red resistance zone.
If breakout is confirmed, the first target could be the green line level! 📊

TradeCityPro | KAS Ranges Near Top with Bullish Momentum Rising👋 Welcome to TradeCity Pro!
In this analysis, I want to review the coin KAS for you. It’s one of the Layer One projects, and its token currently ranks 40 on CoinMarketCap with a market cap of 2.35 billion dollars.
⏳ 4-Hour Timeframe
On the four hour timeframe, the price is moving inside a range box between the levels of 0.082767 (which I’ve also marked as a zone) and 0.091126, and is currently near the top of the box.
✔️ Considering that other coins and market indexes like Bitcoin and Total2 are showing bullish confirmations, the activation of this coin’s long trigger could initiate a strong upward move.
📊 The volume increase shown on the chart is another reason why the probability of breaking the top of the box has gone up.
📈 For a long position, we can enter with the trigger at 0.091126. If the breakout candle comes with strong volume, we’ll have volume confirmation as well, and momentum confirmation will come from RSI breaking above 62.96.
✨ Given the confirmations, the likelihood of this trigger activating seems high, and we can target a move to 0.102417 or even 0.126033.
🛒 For a spot buy of this coin, it’s better to wait for a break above 0.126033. We can open a futures position at the 0.091126 trigger aiming for 0.126033, and once the price reaches 0.126033, we can use the profits from the futures trade to enter the spot market.
🔽 As for bearish movement and a short trigger, the first sign would be rejection from the 0.091126 area. The main trend reversal trigger will be the breakdown of the support zone.
📝 Final Thoughts
This analysis reflects our opinions and is not financial advice.
Share your thoughts in the comments, and don’t forget to share this analysis with your friends! ❤️

KAS (Kaspa) – Long Swing Setup from Key SupportKAS is retracing into a key support zone around $0.108, which has previously acted as a springboard for bullish reversals. This level aligns with a potential higher low structure on the daily chart, and offers a favorable risk/reward setup for a swing long.
🔹 Entry Zone:
$0.108
🎯 Take Profit Targets:
🥇 $0.13 – $0.154
🥈 $0.175 – $0.19
🛑 Stop Loss:
Just below $0.097 (breakdown below support invalidates setup)

Kaspa Update, Including Targets (PP: 344% & 496%)If you are a Kaspa trader, holder or lover, let me start by saying that the chart looks great. It looks awesome to say the least.
Looking at the red dashed line on the chart, we can see that KASUSDT produced a perfect bottom and is now on the bullish zone.
Looking at the blue line, both the horizontal line and EMA21, we can see this week is breaking above a strong resistance level, the lows matching 4-November and 29-April from 2024. This weekly candle is also full green and trades at the highest price since February.
Ok, now that the basics are in, let me take some time for a greeting...
Good afternoon my fellow Cryptocurrency trader, how are you feeling in this wonderful day?
Now that EMA21 weekly is being conquered as resistance, bullish growth is about to be fully confirmed.
The signals are in. The Altcoins are bullish and this we already know long ago. Bitcoin is trading safely and strongly above 100K and once Bitcoin becomes strong, the Altcoins follow; Kaspa is set to grow.
We have several targets on the chart. The certainty level for a bullish wave is high, 100%. First target is easy and should be ignored, 0.148 and 0.174, these are too easy so we aim higher.
New ATH is set at the 1.618 Fib. extension sitting at 0.303. This is a good target but still easy. The next target is 0.458 and that's a target where we should consider taking some profits but, it can go higher and it is very likely to go much higher.
Thanks a lot for your continued support.
I hope that you enjoy the content.
Namaste.

KAS – Long Spot Trade Setup (Structural Recovery in Play)KAS is beginning to show early signs of reversal, reclaiming the 20-day SMA after forming a double bottom near the $0.087 zone. This signals a potential shift in momentum and offers a favorable risk-reward opportunity.
🔹 Entry Zone:
$0.087 – $0.094
🎯 Take Profit Targets:
🥇 $0.108 – $0.120
🥈 $0.133 – $0.154
🛑 Stop Loss:
Just below $0.080

Kaspa Bullish Signal Revealed —Focus On The Long-TermKaspa just broke decisively above EMA55 on the daily timeframe, opening up two major targets for this current advance and confirming at least 3 months of growth for this bullish wave and period.
Now, every time a strong resistance level is hit, there is a retrace.
When a strong move happens, there is a pause.
The market never moves up, up, up unless it is in a bull run phase. The market also never moves straight down; the market moves in waves.
So it is natural to see a pause after a strong bullish breakout. After several days of pause, we get additional growth.
Look at the bigger picture, consider this; From the 7-April low to yesterday's high Kaspa is up by 89%. You see? Nice growth and this growth will continue long-term, but long-term.
You can be certain that the market will produce higher highs and higher lows, but this does not remove the possibility of flash crashes and shakeouts, in fact, these type of moves are part of normal market behavior, not the exception but the norm.
When people see strong bullish action they tend to rush, jump and buy-in. They don't buy when prices are low but when the breakout happens out of excitement, an impulse.
What happens is that the market stops and go bland for a few days. This impulse dies out and these people close the trade at lower prices, and then the market resumes growing.
You can do good; you simply wait/hold and it will grow.
You should buy when I publish my charts. If you bought out of excitement, focus on the long-term. FOCUS ON THE LONG-TERM.
Thanks a lot for your continued support.
Namaste.

Trading opportunity for KASUSDTBased on technical factors there is a Sell position in :
📊 KASUSDT
🔴 Sell Now
🪫Stop loss 0.11000
🔋Target 0.06767
📏 R/R 2
💸RISK : 1%
We hope it is profitable for you ❤️
Please support our activity with your likes👍 and comments📝

KASUSDT ShortLooks like KASUSDT is wrapping up an ABCDE reversal pattern right on the daily 50EMA — point E seems to be the final touch.
What stands out is how that 50EMA is acting like a brick wall — price got rejected at A, C, and now again at E.
My target’s the support zone marked on the chart.
I’m not setting a tight stop — too easy to get wicked out by some stop-hunting move.
I’ll only cut the trade if we get multiple candle bodies closing clean above the daily 50EMA.
