KAS/USDT at a Critical Point — Break or Bearish Continuation?On the 1D timeframe, KAS/USDT is still moving within a clear bearish trend structure since the peak around 0.118–0.115. Price continues to form lower highs and lower lows, confirmed by a well-respected descending trendline (yellow line) acting as a major dynamic resistance.
Currently, price is trading around 0.049–0.050, attempting to form a minor higher low after bouncing from the demand / swing low area at 0.036–0.038.
---
Market Structure & Technical Pattern
Primary Trend: Bearish (Lower High – Lower Low)
Main Pattern:
Descending Trendline / Bearish Structure
→ Indicates sustained selling pressure since August.
Recent Price Action:
A technical rebound / dead cat bounce is in progress, but there is no confirmed trend reversal yet.
Key Support & Resistance Levels:
Strong resistances:
0.0585 – 0.0646 – 0.0705 – 0.0815
Major supply zone:
0.0899 – 0.105 – 0.114
Important supports:
0.0490 – 0.0430
Critical support (range low):
0.0360
---
Bullish Scenario (Reversal / Recovery Setup)
The bullish scenario becomes valid only if price breaks and closes decisively above the descending trendline.
Bullish Confirmation:
Breakout and daily close above the trendline
Bullish continuation candle
Ideally supported by increasing volume
Upside Targets:
🎯 0.0585 (nearest resistance)
🎯 0.0646
🎯 0.0705
🎯 0.0815 (key level for medium-term trend reversal confirmation)
A sustained hold above 0.0815 would invalidate the current daily bearish structure and open the door for a medium-term bullish reversal.
---
Bearish Scenario (Rejection / Downtrend Continuation)
If price fails to break the trendline and forms a clear rejection or bearish engulfing pattern, this would signal the formation of a new lower high.
Bearish Confirmation:
Strong rejection at the trendline
Daily close back below 0.049
Breakdown of minor structure
Downside Targets:
🔻 0.0430
🔻 0.0390
🔻 0.0360 (major demand & key swing low)
A clean breakdown below 0.0360 would increase the risk of further downside continuation.
---
Conclusion
KAS/USDT is currently trading in a critical decision zone, positioned between a potential early reversal and continued bearish momentum.
The descending trendline remains the key level to watch.
➡️ Not bullish until a confirmed breakout occurs.
➡️ Bearish risks remain as long as price stays below the trendline.
Waiting for a clear price reaction around the trendline is strongly recommended before making major trading decisions.
---
#KAS #KASUSDT #Kaspa #CryptoAnalysis #TechnicalAnalysis #PriceAction #Downtrend #Trendline #SupportResistance #DailyChart #Altcoin #BearishMarket #PotentialReversal
Kasusdtanalysis

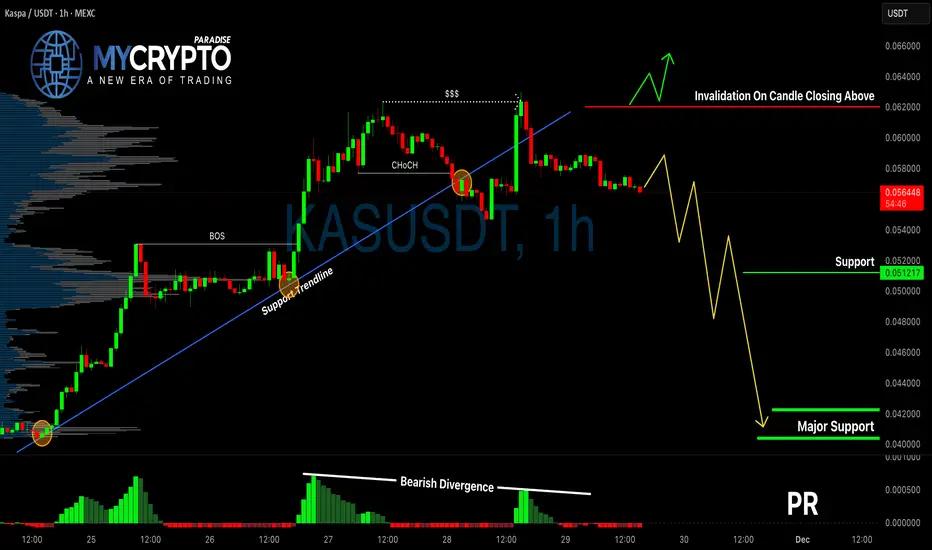
KASUSDT Breakdown Confirmed?Yello Paradisers, have you already positioned yourself on KASUSDT’s bearish move, or are you about to get trapped by a false bounce? The market just gave us a major clue, and ignoring it could cost you.
💎KASUSDT has officially broken below a critical supportive trendline, which was previously holding the structure intact. This breakdown wasn’t random—it came with a clean bearish CHoCH (Change of Character), and the MACD histogram is flashing a clear bearish divergence. These combined signals significantly increase the probability that this is not just a minor pullback, but the beginning of a more aggressive downside move.
💎From the current market level, there is already a straightforward 1:1 risk-reward opportunity on the table. However, if price pulls back toward the previous support (now resistance), that would offer a much better entry zone with improved risk-reward. But don’t jump in blindly—what we want to see at that level is a bearish candlestick confirmation. Without it, you're only guessing. With it, you’re trading with probability on your side.
💎On the flip side, if KASUSDT breaks out and closes decisively above the invalidation level, that would fully invalidate the current bearish thesis. In that case, it’s smarter to stay on the sidelines and wait for a new high-probability setup to form. This market doesn’t reward impulsive decisions—it rewards patience, discipline, and precision.
🎖Strive for consistency, not quick profits. Treat the market as a businessman, not as a gambler.
MyCryptoParadise
iFeel the success🌴
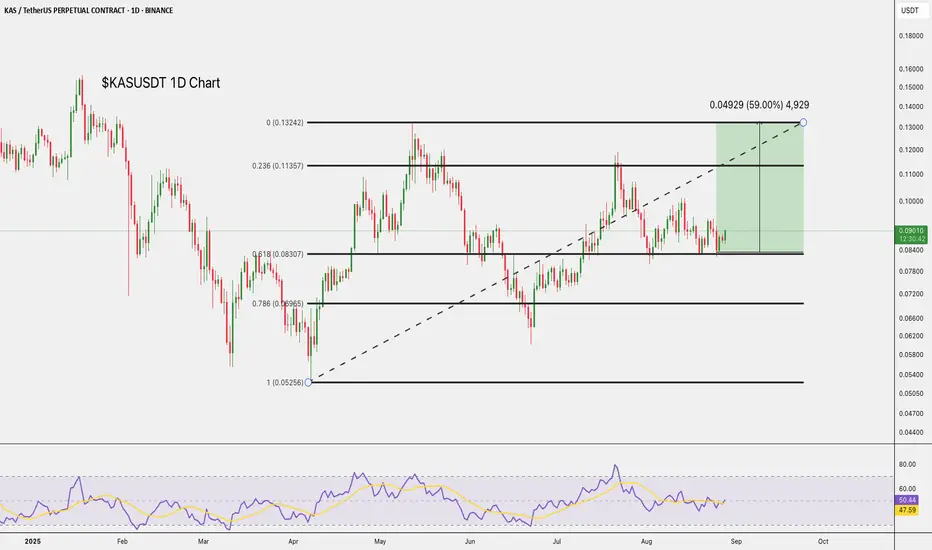
$KAS Poised for 59% Upside.CSE:KAS is holding above the $0.08403 support.
A bounce here could push it toward $0.10118 and possibly $0.13275, offering about 59% upside.
RSI is neutral, leaving room for momentum to build.
DYOR, NFA
KAS zones for correctionKAS idea shared before but here is small updates MEXC:KASUSDT
Possible Targets and explanation idea
➡️W tf. Basic 3 drive pattern on a Weekly chart - bearish pattern
➡️M fvg like a magnet for correction
➡️Most likely we will test buy line on a W tf. and will close at least 50% fvg
➡️Leave 2 main liquidity pools around M fvg
➡️Money inflow indicator Bearish div marked on a chart
➡️Money outflow on a W chart
Hope you enjoyed the content I created, You can support with your likes and comments this idea so more people can watch!
✅Disclaimer: Please be aware of the risks involved in trading. This idea was made for educational purposes only not for financial Investment Purposes.
---
• Look at my ideas about interesting altcoins in the related section down below ↓
• For more ideas please hit "Like" and "Follow"!

KAS/USDT Trading ScenarioThe KAS’s price chart continues to follow an upward trend, with the trendline successfully acting as a support level four times, indicating its significant strength. From a volume profile perspective, the current asset price is in a zone of heightened market participant interest, with a key volume level POC at $0.16833.
After the news about a potential Fed rate cut, a short-term correction is likely, as the market has probably already priced this event in. In this case, we may see sell-offs following the news release. However, in the long term, growth potential remains, with the trendline, once again being tested, serving as a possible reversal point.


Chart Idea - KASUSDT Swing Long SetupKASUSDT Long Setup
Confirmations:
- Weekly Stoch RSI cross over
- Bounced beautifully from 0.618 fib level of 0.097 range
- Successful retest of weekly bull flag breakout support which coincides with 0.382 fib level
Entry: 0.11
TP: 0.378
SL: 0.099
It’s a swing long which can play out in weeks if not months.

KASUSDT 1WKAS ~ 1W
#KAS Buy from here, a new high will soon be formed.
Target at least 20%++ from here.

Riding the Bull: KASPA Breakout in Uptrend ChannelTrend Analysis:
Uptrend Channel: The chart indicates an upward-trending channel. The price is oscillating between the upper and lower boundaries of the channel, suggesting a long-term bullish trend.
Support and Resistance Levels:
Support : The current support level is around $0.11060, which aligns with the lower boundary of the channel.
Resistance: Key resistance levels are marked at $0.16000 and $0.19337, which align with the upper boundary of the channel.
Key Price Levels:
Current Price: The current price is $0.1401.
Immediate Resistance: The price is approaching the immediate resistance at $0.14047 .
Immediate Support: The next support level to watch is $0.10233 , which is a significant level below the current price.
Indicators:
Stochastic Oscillator : The stochastic oscillator is visible at the bottom of the chart, showing potential overbought or oversold conditions.
The oscillator is currently in a mid-range, suggesting that there is room for movement in either direction.
Volume : The volume bars indicate the trading activity. There seems to be an increase in volume, suggesting heightened trading interest.
Potential Scenarios:
Bullish Scenario:
If the price breaks above the immediate resistance at $0.14047, it could move towards the next resistance level at $0.16000.
A further break above $0.16000 could see the price reaching $0.19337, which is near the upper boundary of the channel.
Bearish Scenario:
If the price fails to hold the support at $0.13174, it could fall towards the next support at $0.11060.
A break below $0.11060 could lead to a further decline towards $0.10233, aligning with the lower boundary of the channel.

🚀 KAS Support Hold: Potential for Higher Levels! 📈💹📊 Analysis:
Current Situation: KAS is holding support above $0.15.
Retest Scenario: If it holds on the retest, higher levels could be on the horizon.
📉 Trade Strategy:
Entry: Consider entering the trade between $0.14 and $0.15 support area.
Stop Loss: Set under $0.135 to manage risk.
Take Profit: Aim for higher levels around $0.20 or $0.25.
KAS/USDTI'm excited to share a technical analysis of KAS/USDT, where the project Kaspa introduces a revolutionary blockDAG structure based on the GhostDAG/PHANTOM protocol. This innovative approach makes Kaspa the fastest and most scalable instant confirmation transaction layer built on a proof-of-work engine.
Key Project Information:
Coin: KAS/USDT
Project: Kaspa, employing the GhostDAG/PHANTOM protocol
Structure: BlockDAG, a groundbreaking ledger structure
Consensus: Scalable generalization of Nakamoto Consensus
Technical Analysis:
As illustrated in the chart below:
Monthly Open Price: $0.1280
Weekly Open Price: $0.1060
Monday Highest Price: $0.1090
Monday Low Price: $0.095 (a significant level triggering a market response)
Trade Plan:
Buy Levels: $0.11300 and $0.11900
Stop Area: $0.10, up to Monday's low at $0.095
First Target: $0.13700 (20% potential gain)
Second Main Target: $0.18500 (60% potential gain)
The trend is expected to turn bullish upon breaking the $0.1200 level, paving the way for further upside potential.
Remember, this is not trading advice but an analysis for your consideration. Enjoy the run, stay safe, and may everyone reap profitable rewards.

KASUSDTMEXC:KASUSDT Long idea
⛔"Daily crypto market analyses I provide are personal opinions & not financial advice. Trading carries risks, so do your own research & seek advisor's help. #DYOR
Don't forget to 🚀 and comment

KAS NEW VOLUME INCREASEThank you for reading this update.
Depending on our study we see that KAS has a good chance of volume increase.
This updates depending on day trade, And the market should confirm with time the right market way.
#Nottradingadvice

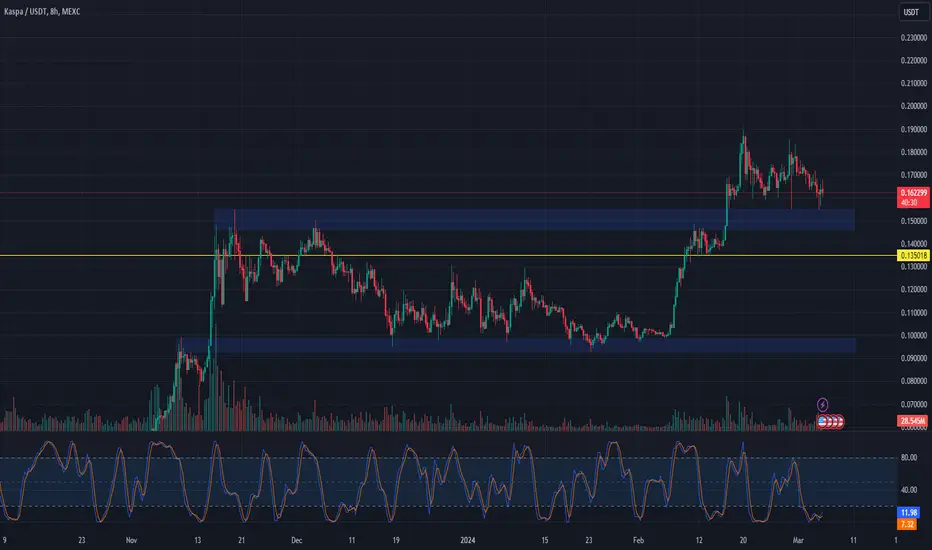
How strong resistance breakout is best buy ?When price is rejected at the resistance level multiple times and when price finally manages to breakout the resistance is one of the best opportunity for the LONG trade (Vice versa for short trade)
In the above chart of KASPA is one of the best example showing this behaviour.
KASPA price got rejected more than 4 times because of strong resistance and once the price managed to breakout the resistance , price went up in a sudden surge gaining 135% in space of 1-2 weeks.
We should keep an eye on these type of resistance breakouts, these are the best entry for LONG trades with very minimal list.
Follow us for more such tips and share your thoughts in the comments.
Cheers
GreenCrypto

KASPA very bearish..After my VERY SUCCESFUL prediction about Kaspa, im back again.
Kaspa is entering bearish period. As you can see with the latest breakout to ATH (0,054) Volume was even lower than previous times, which is absolutely bearish. After the breakout, KASPA immediatly dumped to 0,043, which is another bearish sign. It seems whales just wanted to exit and needed a little bit liquidity (which they are not getting).
Beside of this, You see Kaspa has made DOUBLE TOP, this is one of the most bearish patterns, I dont see Kaspa going any higher and i expect a huge dump towards at least 0,025.
BE CAREFUL.
My PREVIOUS prediction about Kaspa was PERFECT:
MEXC:KASUSDT KUCOIN:KASUSDT CRYPTO:KASUSD COINEX:KASUSDT

BULLISH WEEKLY HEIKIN ASHIVery bullish looking chart for Kaspa. Following an ascending channel, bouncing off the 20/21 week SMA/EMA (bull market support band)
Heikin Ashi just turned GREEN on the weekly
Looks to be primed for upside!

KASPA kas/usdt (Head and shoulder) ?In trading, the term "head and shoulders" refers to a popular chart pattern used in technical analysis to predict potential trend reversals. The head and shoulders pattern typically forms after an uptrend and is considered a bearish reversal pattern. It consists of three peaks or highs, with the middle peak (the "head") being higher than the two surrounding peaks (the "shoulders"). Here's how the pattern is typically identified:
Left Shoulder: This is the first peak and occurs during an uptrend.
Head: The highest peak of the pattern, representing a brief consolidation or continuation of the uptrend.
Right Shoulder: This is the third peak, usually lower than the head, and forms after a minor rally from the head.
The pattern is considered complete when there is a confirmation of a trend reversal. Traders often look for specific criteria to confirm the pattern:
Neckline: Draw a line connecting the lows of the left shoulder and the right shoulder. The neckline serves as a key support level.
Breakdown: A breakdown occurs when the price of the asset falls below the neckline, indicating that the pattern is valid and a trend reversal may be underway.
Volume: It's common to see a significant increase in trading volume when the breakdown occurs, confirming the pattern.
Once the head and shoulders pattern is confirmed, traders often use it as a signal to open short positions (sell) or to close long positions (take profits) in anticipation of a bearish move in the price of the asset.
It's important to note that while the head and shoulders pattern is a widely recognized and studied technical pattern, it is not foolproof, and false signals can occur. Traders often use additional technical analysis tools and indicators to confirm their trading decisions and manage risk.
In summary, the head and shoulders pattern in trading is a bearish reversal pattern that forms after an uptrend and is characterized by three peaks, with the middle peak (the head) being higher than the two surrounding peaks (the shoulders). It can be a signal that a trend reversal is imminent, but traders should use additional analysis and risk management strategies when trading based on this pattern.

KASUSDT at 4h resistance, likely to head downThe price has bounced well from the daily support DS1 which was our target for the last short trade. We did not take any long though it was a good opportunity for going long. However, now price is coming close to 4h resistance 4HR1 area. I think this zone shall resist the price and push it down again towards the daily support zone. Since the price has strength moving upwards, I will keep the size small for this short trade.

KASUSDT likely to head to daily support 0.034-0.035The price bounce from hourly support HS1 and hit the hourly resistance HR1. The price is likely to move further down from here towards daily resistance DS1. This makes a short trade favorable here. The target of this short trade should be the daily support DS1 around 0.034-0.035. There is another large time frame idea of the price heading towards weekly support but thats not presented here as we would like to do multiple trades here and therefore, trading mid time frame levels.

KASUSDT at hourly support, likely to bounce to 0.039636The price has been rejected from weekly resistance and currently trading at hourly support. The price is likely to bounce here towards LTF resistance. Therefore a long trade is favorable here. The target of the trade should be 0.039636.
