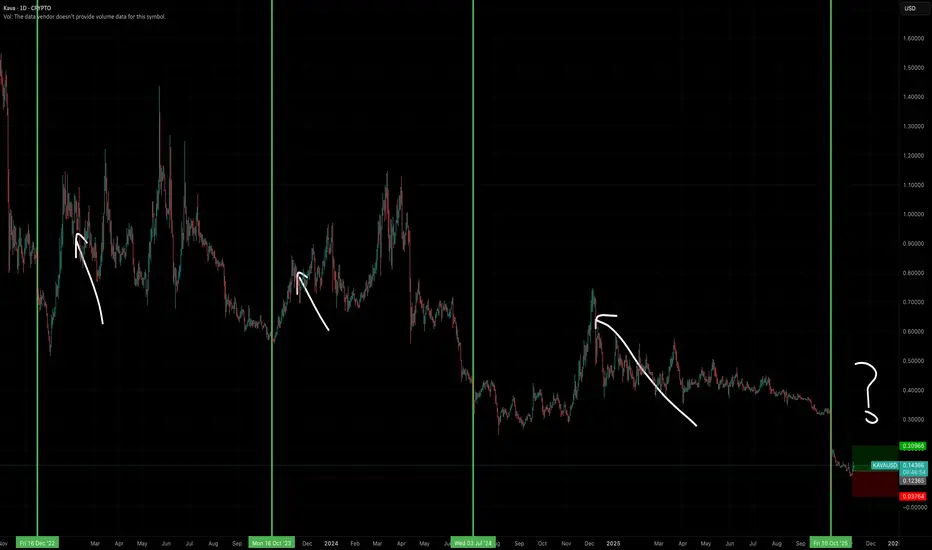
Taking a short position on KAVA (4H)📉 KAVA – Bearish Market Structure & Short Setup Based on Liquidity Concepts
Liquidity pools above the price have been fully swept, indicating a classic liquidity grab on the buy side. Following this move, the market printed a bearish Change of Character (CHoCH), which clearly signals a shift in market structure from bullish to bearish.
After the CHoCH formation, price dropped aggressively with strong momentum and displacement, confirming the presence of smart money and validating the bearish bias. This impulsive move suggests that the market maker has already collected opposite-side (buy-side) orders and is now positioning price lower.
At the moment, sell-side liquidity pools below the chart remain untouched, which increases the probability of further downside continuation. As long as these liquidity levels are not swept, the bearish scenario remains valid and technically sound.
Based on this structure, we can look for sell/short opportunities within the identified order zone / supply area. This zone aligns with smart money concepts and offers a favorable risk-to-reward (R:R) setup.
📍 Entry Strategy (DCA):
We have two potential entry points, and it is recommended to enter the position using a DCA (Dollar Cost Averaging) approach to optimize entry price and manage risk more effectively.
🎯 Targets:
All take-profit targets are clearly marked on the chart, focusing on sell-side liquidity levels and key structure lows.
❌ Invalidation:
This bearish setup will be invalidated if a daily candle closes above the invalidation level. A confirmed daily close above this level would indicate a failure of bearish structure and negate this analysis.
⚠️ Disclaimer:
This analysis is based on Smart Money Concepts (SMC), liquidity theory, and market structure. Always apply proper risk management and wait for confirmation before entering a trade.
If you would like us to analyze a coin or altcoin for you, first like this post, then comment the name of your altcoin below.
Kava

KAVA ready to shootBINANCE:KAVAUSDT is heavily oversold and will likely rebound quickly to complete its mean reversion.
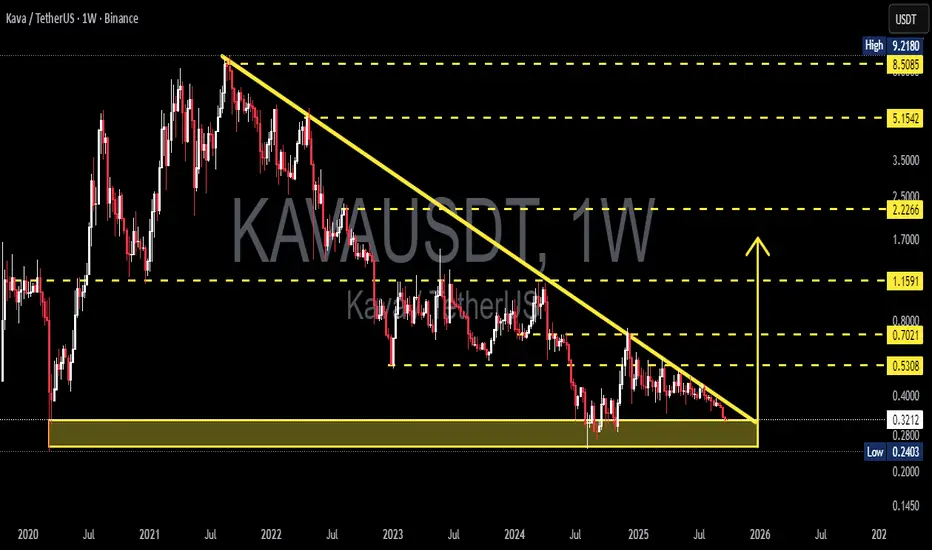
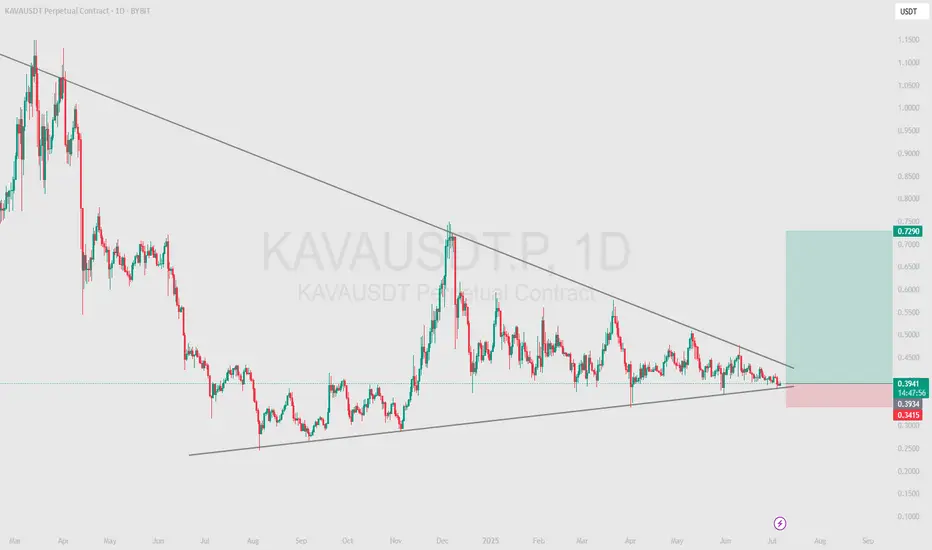
KAVA/USDT — Descending Triangle at a Major Decision Zone!KAVA is currently standing at a critical crossroads. After a prolonged downtrend from its all-time high, the price is now consolidating inside a descending triangle on the weekly timeframe. Lower highs keep pressing the price downward, while the historical support zone at $0.24 – $0.32 is still holding as the last line of defense.
The triangle is getting tighter (apex approaching), which often signals an imminent big move — either a bullish reversal or a bearish continuation.
---
🔎 Pattern Analysis
Main pattern: Descending Triangle
→ Traditionally seen as a bearish continuation, but if the support holds strong, it could act as a springboard for a major reversal.
Historical support: $0.24 – $0.32 (yellow box), a make-or-break area before entering uncharted lower territory.
Falling trendline: The multi-year descending line from 2021 remains the key resistance that bulls must reclaim.
---
🚀 Bullish Scenario
1. Breakout confirmation → A weekly close above the descending trendline.
2. Stronger signal → Break + retest above $0.53.
3. Upside targets:
$0.70 → first psychological barrier.
$1.16 → strong historical resistance.
$2.22 → mid-term breakout target.
4. Extra signals: Rising volume + RSI recovery from oversold would strengthen bullish momentum.
---
🐻 Bearish Scenario
1. Breakdown confirmation → A weekly close below $0.24 with strong volume.
2. Downside targets:
Below $0.24 → opens room for deeper lows.
Sustained breakdown would confirm the continuation of the multi-year bearish trend.
3. Risk factor: Watch for potential false breakdowns (bear traps) if price quickly reclaims the support.
---
🎯 Conclusion
$0.24 – $0.32 is KAVA’s do-or-die zone.
Holding this level → chances of a major reversal.
Losing this level → the bearish trend extends even further.
KAVA is in its final stage of accumulation or distribution. Traders should wait for clear breakout confirmation before committing, as volatility is likely to expand once price exits this structure.
---
KAVA/USDT is consolidating at historical support $0.24 – $0.32, trapped inside a descending triangle. The apex is near → a decisive move is coming.
Bullish case: Breakout above the trendline and $0.53 → targets $0.70 – $1.16 – $2.22.
Bearish case: Breakdown below $0.24 → opens the door for deeper lows.
This is a multi-year turning point for KAVA. Patience for confirmation could reward traders with the next major move.
---
#KAVA #KAVAUSDT #Crypto #Altcoins #PriceAction #DescendingTriangle #SupportResistance #CryptoAnalysis #BreakoutTrading
KAVA/USDT - Bullish Breakout Set to Accelerate Gains!🚀 Trade Setup Details:
🕯 #KAVA/USDT 🔼 Buy | Long 🔼
⌛️ TimeFrame: 1D
--------------------
🛡 Risk Management (Example):
🛡 Based on $1000 Balance
🛡 Loss-Limit: 1% (Conservative)
🛡 Then Your Signal Margin: $30.81
--------------------
☄️ En1: 0.4285 (Amount: $3.08)
☄️ En2: 0.3757 (Amount: $10.78)
☄️ En3: 0.3421 (Amount: $13.86)
☄️ En4: 0.3116 (Amount: $3.08)
--------------------
☄️ If All Entries Are Activated, Then:
☄️ Average.En: 0.3595 ($30.81)
--------------------
☑️ TP1: 0.5892 (+63.89%) (RR:1.97)
☑️ TP2: 0.7478 (+108.01%) (RR:3.33)
☑️ TP3: 1.0124 (+181.61%) (RR:5.59)
☑️ TP4: 1.4884 (+314.02%) (RR:9.67)
☑️ TP5: 2.2778 (+533.6%) (RR:16.44)
☑️ TP6: Open 🔝
--------------------
❌ SL: 0.2428 (-32.46%) (-$10)
--------------------
💯 Maximum.Lev: 2X
⌛️ Trading Type: Swing Trading
‼️ Signal Risk: 🙂 Low-Risk! 🙂
🔎 Technical Analysis Breakdown:
This technical analysis is based on Price Action, Elliott waves, SMC (Smart Money Concepts), and ICT (Inner Circle Trader) concepts. All entry points, Target Points, and Stop Losses are calculated using professional mathematical formulas. As a result, you can have an optimal trade setup based on great risk management.
The daily chart for KAVA/USDT signals strong bullish momentum with multiple strategic entry points offering an excellent risk-reward setup. Market sentiment is turning increasingly optimistic as KAVA’s ecosystem gains traction with DeFi integrations and cross-chain interoperability, positioning it well for sustained growth.
📊 Sentiment & Market Context:
Fundamentally, KAVA stands out as a leading DeFi platform built for secure lending and staking across multiple blockchains, attracting a growing user base and institutional interest. This combination of solid tech and positive market context underpins the bullish bias.
⚠️ Disclaimer:
Trading involves significant risk, and past performance does not guarantee future results. This analysis is for informational purposes only and should not be considered financial advice. Always conduct your research and trade responsibly.
💡 Stay Updated:
Like this technical analysis? Follow me for more in-depth insights, technical setups, and market updates. Let's trade smarter together!

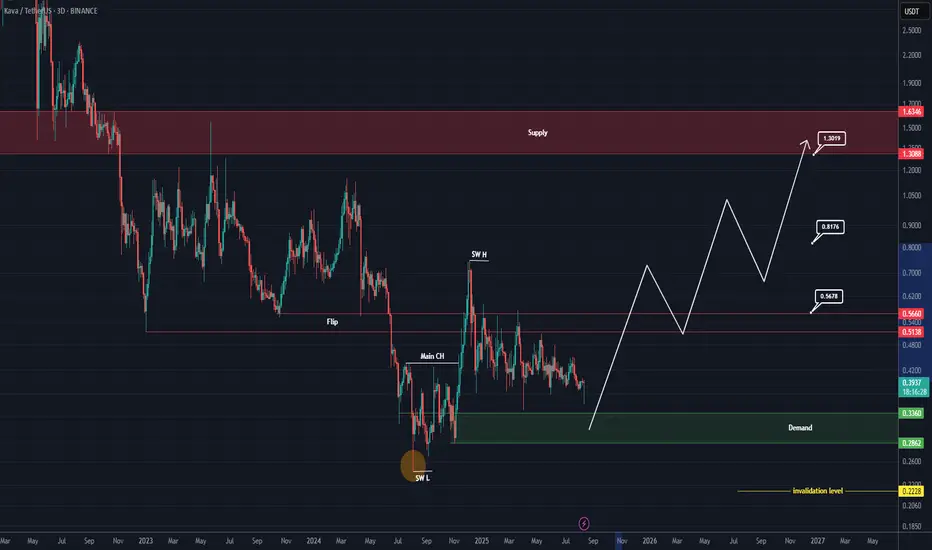
KAVA is ready to take off (3D)After a strong bullish wave, KAVA has entered a time correction phase. Despite the altcoin market being very volatile, KAVA has not experienced a significant price correction and is approaching a strong support zone. It is expected that upon touching this area, a bullish move will form in higher timeframes.
We are looking for buy/long positions in the green-marked area.
Targets are indicated on the chart.
A daily candle close below the invalidation level will nullify this analysis.
For risk management, please don't forget stop loss and capital management
When we reach the first target, save some profit and then change the stop to entry
Comment if you have any questions
Thank You
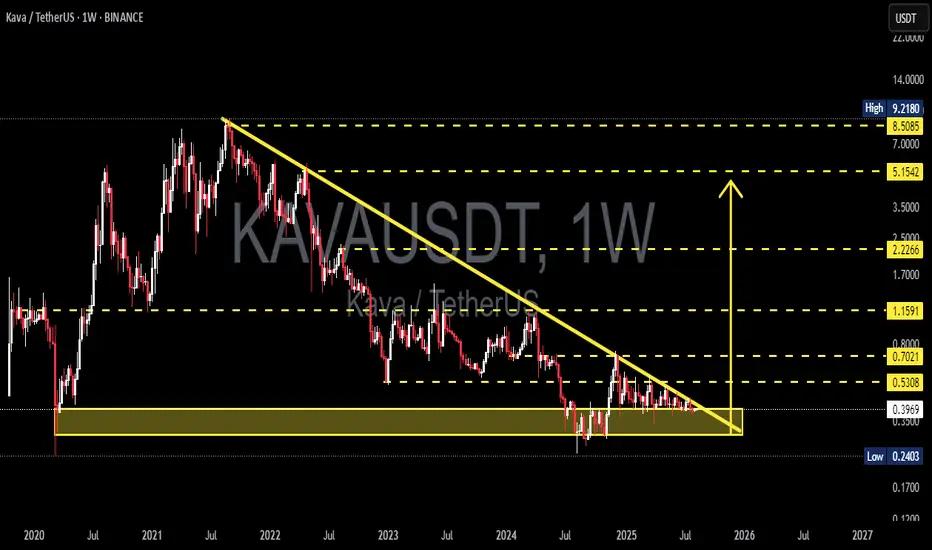
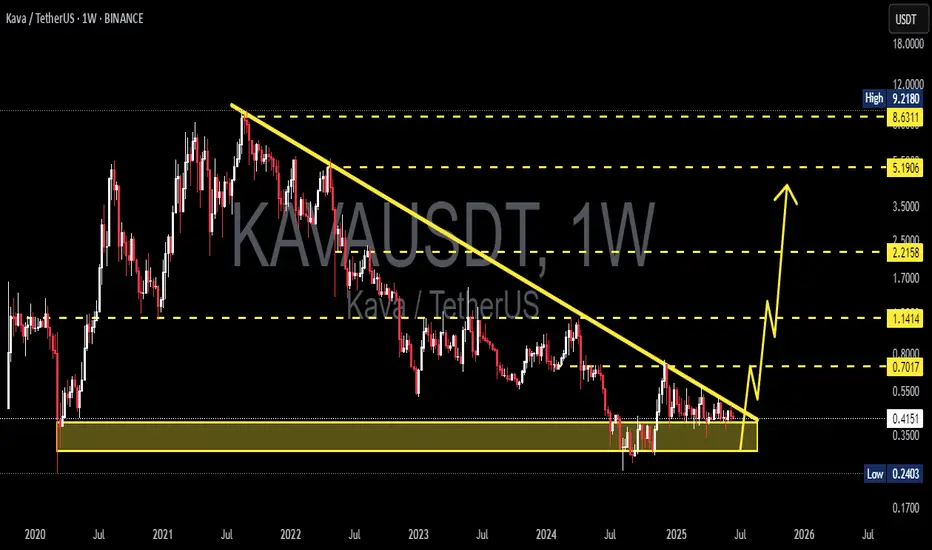
KAVA at Make-or-Break Point — Breakout or Breakdown Ahead?KAVA price is forming a descending triangle on the weekly timeframe, with a long-term downtrend resistance line from the 2021 peak converging toward a horizontal support zone (~0.24–0.40). Price action is compressing near the apex — suggesting that a strong move (either breakout or breakdown) could occur in the coming weeks/months. Weekly timeframe signals carry more weight, so confirmation on a weekly close is highly recommended.
Key Levels (from chart)
Resistance / upside targets: 0.5308 → 0.7021 → 1.1591 → 2.2266 → 5.1542 → 8.5085 → 9.2180
Current price (chart): ~0.3972
Key support zone (yellow box): ~0.24 (Low 0.2403) to ~0.40
Pattern & Technical Interpretation
Pattern: Descending triangle — series of lower highs (downward sloping trendline) + horizontal support.
Implication: In a long-term downtrend, descending triangles often act as bearish continuation patterns. However, a confirmed breakout above the trendline can also signal a bullish reversal.
Compression & timing: Price is nearing the apex → expect volatility to spike once a breakout/breakdown occurs.
Bullish Scenario (confirmation needed)
1. Trigger: Weekly close above the descending trendline (break & hold), ideally followed by a successful retest as support.
2. Extra confirmation: Weekly close above 0.5308 would strengthen the bullish case.
3. Targets: 0.53 → 0.70 → 1.16 (next major resistance zones). If momentum remains strong, higher targets like 2.22 and beyond come into play.
4. Entry strategy: Post-breakout entry after weekly close confirmation, or aggressive scaling in at support with a tight stop-loss.
Bearish Scenario (confirmation needed)
1. Trigger: Weekly close below the support zone (~0.24–0.40), especially with a large breakdown candle.
2. Implication: Breakdown from a descending triangle often accelerates selling pressure — potential retest of historical lows (around or below 0.2403).
3. Entry strategy: Short positions only after confirmed breakdown; conservative longs should avoid entries until reversal signs appear.
Trading Plan & Risk Management (principles)
Always wait for weekly confirmation to avoid false breakouts.
Stop-loss for aggressive longs: just below the support zone (e.g., under 0.24). For breakout longs: below the retested trendline support.
Position sizing: manage exposure due to weekly timeframe + high crypto volatility.
Take profit progressively at major horizontal resistance levels (0.53, 0.70, 1.16…).
Beware of fakeouts — watch for candle closes and retests.
Additional Notes
Weekly timeframe setups tend to be stronger but slower to play out.
Monitor KAVA fundamentals and overall crypto market sentiment (especially BTC trend) — these can speed up or reverse a breakout.
If posting to TradingView, include these levels and clearly state your breakout/breakdown confirmation criteria.
#KAVA #KAVAUSDT #Crypto #TechnicalAnalysis #SupportResistance #DescendingTriangle #Breakout #CryptoTrading
baby baby KAVAlook how lovely this triangle is! I longed the dip near the trendline! lets see whats gonna happen! big gainssssss

Kava: 5 Strong Bullish Signals, Cup & Handle, High Volume & MoreThe cup & handle pattern doesn't work at resistance. You cannot use this pattern in any meaningful way at the top of a rising trend. For the C&H to be valid, it needs to happen at the end of a downtrend, near the market bottom because this is a bullish reversal pattern.
Here we have KAVAUSDT weekly up-close. August 2024 marks the lowest prices since March 2020, in more than 3.5 years. Including this strong multiple years low, we have the cup pattern forming followed by the handle. See the chart:
This is the classic cup and handle (C&H) pattern and here it is valid and can work as a reversal signal.
One signal in isolation is never enough, it needs to be coupled with 3-4 additional signals to have a strong setup. The next signal comes from the trading volume. As KAVAUSDT reached the lowest in almost 4 years, trading volume goes through the roof; the highest buy-volume ever. This is another strong signal.
We have the reversal pattern, long-term double-bottom, increasing volume, local higher low (the handle low vs the cup low) and marketwide action (the rest of the altcoins market going bullish).
There you have five signals total all supporting a change of trend. This means that soon Kava will start to grow and you know this for certain because you have the supporting data coming from the chart.
Namaste.

KAVA - We are expecting the rocket at 80%The KAVAUSDT chart shows a clear downward channel, indicating a bearish trend. However, the price is currently consolidating around the middle of the channel, creating uncertainty about the immediate direction.
Recommended signal: wait for confirmation of a breakout above the upper boundary for longs or a breakout below the lower boundary for shorts.
Is KAVA/USDT About to Explode? Major Breakout Incoming!Technical Analysis (Timeframe: 1W - Weekly)
1. Descending Triangle Breakout Setup
KAVA has been in a prolonged downtrend since 2021, forming a large descending triangle pattern. Currently, the price is nearing the apex of this formation, signaling a potential breakout in the near term.
2. Strong Accumulation Zone
A strong support base has formed between $0.24 – $0.40, which has held for over a year. This suggests significant accumulation by long-term investors at these levels.
3. Breakout Confirmation Imminent
If KAVA successfully breaks above the long-term descending trendline (yellow line), a major shift in market structure could occur, triggering a bullish rally.
4. Key Upside Targets
The following resistance levels may act as profit-taking zones if the breakout confirms:
$0.5308 – Initial minor resistance.
$0.7021 – Psychological resistance zone.
$1.1591 – Previous structural resistance.
$2.2266 – Medium-term upside target.
$5.1542 – $8.5085 – Long-term bull cycle potential targets.
5. Ideal Trading Scenario
Entry Strategy: Buy on breakout confirmation above the trendline or buy on successful retest.
Risk Management: Consider a stop-loss if price falls back below the accumulation zone (~$0.40).
🟢 Conclusion:
KAVA is approaching a critical turning point after a prolonged consolidation phase. A confirmed breakout from this pattern could initiate a strong upward trend, making it a compelling setup for swing traders and long-term investors.
📌 Note: Always apply proper risk management and wait for volume confirmation or supporting indicators before entering any trade.
#KAVA #KAVAUSDT #CryptoBreakout #AltcoinSeason #TechnicalAnalysis #CryptoChart #TradingSignals #BreakoutAlert #CryptoTrading #AltcoinAnalysis #BullishSetup #AccumulationZone

KAVAUSDT 1W AnalysisKAVA ~ 1W Analysis
#KAVA This is the lowest support block for now. Buy from here if you still have faith in this coin with a short term target of at least 15%++
Kava : Day trade volumeKava can show new volume on day trade volume. We will follow this coin in the coming time frames for the uptrend.

KAVAUSDT Forming a Bullish WaveKAVAUSDT is currently presenting a strong bullish wave pattern formation on the daily timeframe, hinting at a potential continuation of the upward trend. After a period of consolidation, KAVA has started to push higher with increasing bullish momentum. This movement is accompanied by solid volume, suggesting that the current wave could be the beginning of a larger impulse leg. The structure is favorable for swing traders and position traders looking to capture mid-term gains in the range of 60% to 70% or more.
From a technical perspective, the price has respected key support zones and is now forming higher highs and higher lows—a classic sign of a bullish trend in development. The overall market sentiment around KAVA is improving, and this is reflected in its rising trading volumes and increased mentions across crypto discussion platforms. If the bullish wave continues to unfold as expected, KAVA could challenge previous resistance levels and break into a new bullish phase.
KAVA also benefits from growing investor interest due to its strong fundamentals in the DeFi ecosystem. As a cross-chain DeFi platform, KAVA provides lending and stablecoin services, making it an attractive asset in a maturing crypto market. Technical indicators such as RSI and MACD are showing bullish signals, further supporting the case for a significant upside move. With volume surging and structure aligning, KAVA appears well-positioned to deliver a strong breakout rally.
Keep an eye on price levels around recent breakout zones as potential entry points. A successful retest could provide a good risk-reward setup for traders aiming to ride the bullish wave. Continued buying pressure and sustained volume would be key signs of strength in the coming days.
✅ Show your support by hitting the like button and
✅ Leaving a comment below! (What is You opinion about this Coin)
Your feedback and engagement keep me inspired to share more insightful market analysis with you!
KAVA USDT LONGKAVA is breaking out From massive Falling Wedge in Weekly Time Frame,
Everything is supportive here from Fundamentals to Price action with RSI

Trading opportunity for KAVAUSDTBased on technical factors there is a Sell position in :
📊 KAVAUSDT
🔴 Sell Now
🪫Stop loss 0.4315
🔋Target 0.3300
📏 R/R 2
💸RISK : 1%
We hope it is profitable for you ❤️
Please support our activity with your likes👍 and comments📝

KAVA / USDT - Turning TablesEvening friends,
I've been keeping an eye on Kava, and if the market doesn't shit the bed we might be looking into big gains coming up the next couple of weeks.
Always do your own research, but I do like this coin as it has got good fundamentals.
Trade thirsty!

KAVAUSD – Midpoint Retest with a Shot at a Daily Higher LowCOINBASE:KAVAUSD / COINBASE:KAVAUSDC
Watching KAVA here on the daily, and it’s at a key decision point that could define the next leg. We’ve got two sets of Fibonacci retracements drawn: the first from the March 2024 high to the August 2024 low, and the second from the August low to the December high. Right now, price is retesting the 50% level of the larger March–August move—aka the midpoint of the macro range—and it's still holding above the 50% retracement of the more recent August–December leg. We’re also sitting right on the 38.2% Fib of that second move, which tends to act as a key area for potential higher lows.
The idea here is simple: I’m playing for a daily higher low. We had a strong move off the December lows, followed by a healthy consolidation, and this is where bulls need to step in. Structure-wise, this is the ideal area for bulls to attempt a defense if the trend is going to continue. EMAs are curling up, and price is still holding above the 12 and 26 EMAs for now, which gives me confidence in a potential bounce.
If the Trade Goes as Planned (Bullish Case)
If buyers step in here and confirm a higher low—ideally somewhere between $0.48 and $0.50—we’d expect a continuation toward the recent high at $0.56. If that level breaks, then $0.64 becomes the next area of interest based on prior price structure and confluence with the upper Fib retracement levels. From there, we could even make a push toward the $0.74 area, where the last major rejection happened in late 2024.
A strong bounce here also sets up a potential inverse head and shoulders structure on the daily if we revisit that neckline around $0.56 again with momentum. In short, a higher low here gives the bulls the setup they need to retake trend control.
If the Trade Fails (Bearish Case)
If price fails to hold the $0.48–$0.50 region and breaks below the August–December 50% Fib level, then we’re likely heading back to the $0.44 zone. That’s where the 200-day SMA is sitting, and it’s also a major pivot from previous support. A loss of that zone opens the door to a full retrace toward $0.39 or even $0.37—last seen during the November-December basing structure.
In that case, the trend would flip neutral at best and would require a fresh base-building phase before bulls could even think about regaining momentum.
TL;DR
Thesis: Playing for a daily higher low above key Fib levels and EMAs.
Bullish Target: Reclaim $0.56 → push toward $0.64–$0.74 if momentum follows through.
Bearish Invalidator: Break below $0.48 = likely revisit of $0.44 or lower.
Not financial advice. Just sharing my thinking as I try to stack confluence and play the levels. Let’s see if this bounce gets legs.

Breaking: $KAVA Surged 10% Today Amidst A Falling Wedge KAVA the Layer-1 blockchain that combines the speed and interoperability of Cosmos with the developer power of Ethereum's native token SEED_DONKEYDAN_MARKET_CAP:KAVA urged 10% today amidst a bullish pennant.
From the first week of December, 2024 SEED_DONKEYDAN_MARKET_CAP:KAVA underwent a falling wedge pattern losing almost 50% of market value. Consequent to the bullish pennant formed, SEED_DONKEYDAN_MARKET_CAP:KAVA coin surged 10% hinting at a 36% surge to the recent high of December 4, 2024.
Kava Price Live Data
The live Kava price today is $0.539085 USD with a 24-hour trading volume of $25,133,445 USD. Kava is up 8.88% in the last 24 hours, with a live market cap of $583,750,357 USD. It has a circulating supply of 1,082,853,482 KAVA coins and the max. supply is not available.

KAVABINANCE:KAVAUSDT
KAVA / USDT
1D time frame ( wait for the price to come to buying zone)
analysis tools
____________
SMC
FVG
Trend lines
Fibonacci
Support & resistance
MACD Cross
EMA Cross
______________________________________________________________
Golden Advices.
********************
* Please calculate your losses before any entry.
* Do not enter any trade you find it not suitable for you.
* No FOMO - No Rush , it is a long journey.
Useful Tags.
****************
My total posts
www.tradingview.com

KAVAUSDT 1WKAVA ~ 1W Analysis
#KAVA This is the lowest support for now. Buy gradually from here with a short -term target of at least 20%+.

KAVA is bearish (4H)KAVA has been consistently making lower highs and lower lows in the swing structure for some time.
Now, a major base has been broken, and a Flip zone has formed. There are also liquidity pools below the chart, which we have marked.
From the supply zone, it can move toward the targets shown on the chart. The targets are clearly marked on the chart.
A daily candle closing above the invalidation level will invalidate this analysis.
Do not enter the position without capital management and stop setting
Comment if you have any questions
thank you

TradeCityPro | KAVA: A Dive into DeFi's Cosmos Ecosystem👋 Welcome to TradeCityPro!
In this analysis, I want to discuss the KAVA coin, a notable DeFi platform in the Cosmos ecosystem, which currently ranks 129th with a market cap of $472 million.
📅 Weekly Timeframe
We are witnessing a downward trend in the weekly timeframe, where the price has been moving along a descending trend line, with the most recent bottom recorded at the $0.2872 area.
🔍 Currently, a significant price ceiling has been set at $0.6981, and the price has recently been rejected from the descending trend line, likely moving towards the support floor again.
🔼 The support at $0.2872 is crucial, and if broken, the price could set a new historical bottom. For the trend to turn bullish, confirmation will come after breaking the trend line and surpassing the resistance at $1.1434.
📊 Volume divergence has been observed with the trend for some time now, but this divergence has yet to impact the trend, which continues to persist.
📅 Daily Timeframe
In the daily timeframe, we can observe the price movement in greater detail.
⚡️ As you can see, after reaching $0.7197, a corrective phase began, and currently, at the 0.618 Fibonacci level, a significant support has formed, overlapping with the $0.4118 area, creating a Potential Reversal Zone (PRZ).
✅ If the support at $0.4118 is breached, we might witness the next downward leg of the price, which could extend to the 0.786 Fibonacci level, and in case of increased downward momentum, the next target could be at $0.2925.
🛒 On the other hand, for a long-term long position, you could enter upon breaking the trigger at $0.5577, holding the position towards a target of $0.7179. The main trigger for spot buying is also $0.7179, but it is better to get the spot trigger confirmation from this coin’s Bitcoin pair.
📝 Final Thoughts
This analysis reflects our opinions and is not financial advice.
Share your thoughts in the comments, and don’t forget to share this analysis with your friends! ❤️

KAVA/USDT 300% Growth PotentialKAVA is one of the few coins that held exceptionally well during the recent market manipulation. While most cryptos printed new lower lows, KAVA/USDT formed a solid double bottom around the psychological support at $0.40.
From a technical perspective, this setup suggests strong upside potential. If the support holds, we could see a significant bullish breakout in the coming months. I wouldn't be surprised if the price skyrockets by 300% over the next three months.
Are you bullish on KAVA?
