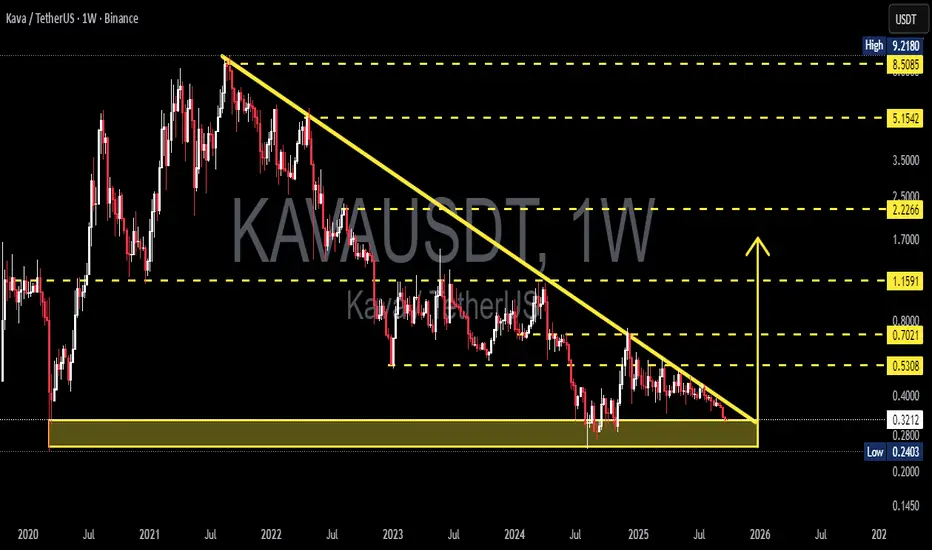
KAVA/USDT — Descending Triangle at a Major Decision Zone!KAVA is currently standing at a critical crossroads. After a prolonged downtrend from its all-time high, the price is now consolidating inside a descending triangle on the weekly timeframe. Lower highs keep pressing the price downward, while the historical support zone at $0.24 – $0.32 is still holding as the last line of defense.
The triangle is getting tighter (apex approaching), which often signals an imminent big move — either a bullish reversal or a bearish continuation.
---
🔎 Pattern Analysis
Main pattern: Descending Triangle
→ Traditionally seen as a bearish continuation, but if the support holds strong, it could act as a springboard for a major reversal.
Historical support: $0.24 – $0.32 (yellow box), a make-or-break area before entering uncharted lower territory.
Falling trendline: The multi-year descending line from 2021 remains the key resistance that bulls must reclaim.
---
🚀 Bullish Scenario
1. Breakout confirmation → A weekly close above the descending trendline.
2. Stronger signal → Break + retest above $0.53.
3. Upside targets:
$0.70 → first psychological barrier.
$1.16 → strong historical resistance.
$2.22 → mid-term breakout target.
4. Extra signals: Rising volume + RSI recovery from oversold would strengthen bullish momentum.
---
🐻 Bearish Scenario
1. Breakdown confirmation → A weekly close below $0.24 with strong volume.
2. Downside targets:
Below $0.24 → opens room for deeper lows.
Sustained breakdown would confirm the continuation of the multi-year bearish trend.
3. Risk factor: Watch for potential false breakdowns (bear traps) if price quickly reclaims the support.
---
🎯 Conclusion
$0.24 – $0.32 is KAVA’s do-or-die zone.
Holding this level → chances of a major reversal.
Losing this level → the bearish trend extends even further.
KAVA is in its final stage of accumulation or distribution. Traders should wait for clear breakout confirmation before committing, as volatility is likely to expand once price exits this structure.
---
KAVA/USDT is consolidating at historical support $0.24 – $0.32, trapped inside a descending triangle. The apex is near → a decisive move is coming.
Bullish case: Breakout above the trendline and $0.53 → targets $0.70 – $1.16 – $2.22.
Bearish case: Breakdown below $0.24 → opens the door for deeper lows.
This is a multi-year turning point for KAVA. Patience for confirmation could reward traders with the next major move.
---
#KAVA #KAVAUSDT #Crypto #Altcoins #PriceAction #DescendingTriangle #SupportResistance #CryptoAnalysis #BreakoutTrading
Kavausdtanalysis
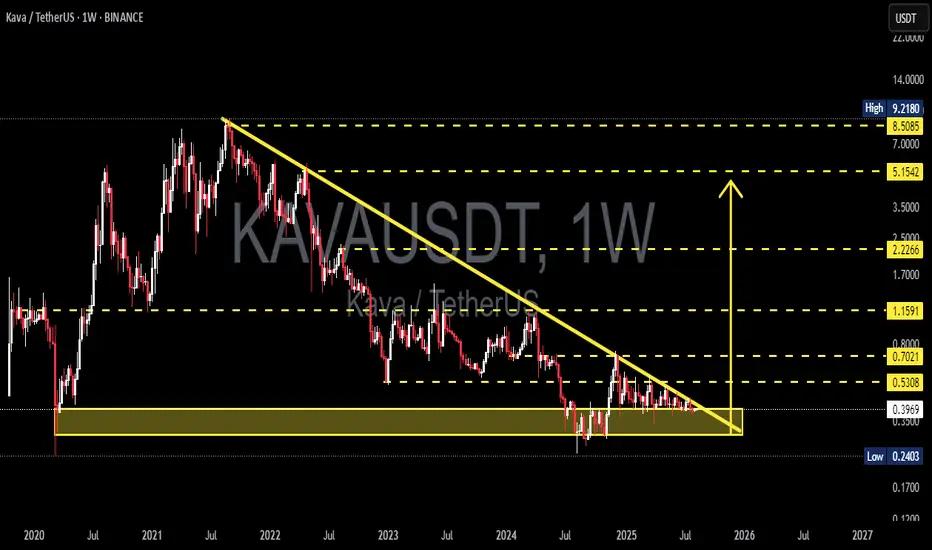
KAVA at Make-or-Break Point — Breakout or Breakdown Ahead?KAVA price is forming a descending triangle on the weekly timeframe, with a long-term downtrend resistance line from the 2021 peak converging toward a horizontal support zone (~0.24–0.40). Price action is compressing near the apex — suggesting that a strong move (either breakout or breakdown) could occur in the coming weeks/months. Weekly timeframe signals carry more weight, so confirmation on a weekly close is highly recommended.
Key Levels (from chart)
Resistance / upside targets: 0.5308 → 0.7021 → 1.1591 → 2.2266 → 5.1542 → 8.5085 → 9.2180
Current price (chart): ~0.3972
Key support zone (yellow box): ~0.24 (Low 0.2403) to ~0.40
Pattern & Technical Interpretation
Pattern: Descending triangle — series of lower highs (downward sloping trendline) + horizontal support.
Implication: In a long-term downtrend, descending triangles often act as bearish continuation patterns. However, a confirmed breakout above the trendline can also signal a bullish reversal.
Compression & timing: Price is nearing the apex → expect volatility to spike once a breakout/breakdown occurs.
Bullish Scenario (confirmation needed)
1. Trigger: Weekly close above the descending trendline (break & hold), ideally followed by a successful retest as support.
2. Extra confirmation: Weekly close above 0.5308 would strengthen the bullish case.
3. Targets: 0.53 → 0.70 → 1.16 (next major resistance zones). If momentum remains strong, higher targets like 2.22 and beyond come into play.
4. Entry strategy: Post-breakout entry after weekly close confirmation, or aggressive scaling in at support with a tight stop-loss.
Bearish Scenario (confirmation needed)
1. Trigger: Weekly close below the support zone (~0.24–0.40), especially with a large breakdown candle.
2. Implication: Breakdown from a descending triangle often accelerates selling pressure — potential retest of historical lows (around or below 0.2403).
3. Entry strategy: Short positions only after confirmed breakdown; conservative longs should avoid entries until reversal signs appear.
Trading Plan & Risk Management (principles)
Always wait for weekly confirmation to avoid false breakouts.
Stop-loss for aggressive longs: just below the support zone (e.g., under 0.24). For breakout longs: below the retested trendline support.
Position sizing: manage exposure due to weekly timeframe + high crypto volatility.
Take profit progressively at major horizontal resistance levels (0.53, 0.70, 1.16…).
Beware of fakeouts — watch for candle closes and retests.
Additional Notes
Weekly timeframe setups tend to be stronger but slower to play out.
Monitor KAVA fundamentals and overall crypto market sentiment (especially BTC trend) — these can speed up or reverse a breakout.
If posting to TradingView, include these levels and clearly state your breakout/breakdown confirmation criteria.
#KAVA #KAVAUSDT #Crypto #TechnicalAnalysis #SupportResistance #DescendingTriangle #Breakout #CryptoTrading
Is KAVA/USDT About to Explode? Major Breakout Incoming!Technical Analysis (Timeframe: 1W - Weekly)
1. Descending Triangle Breakout Setup
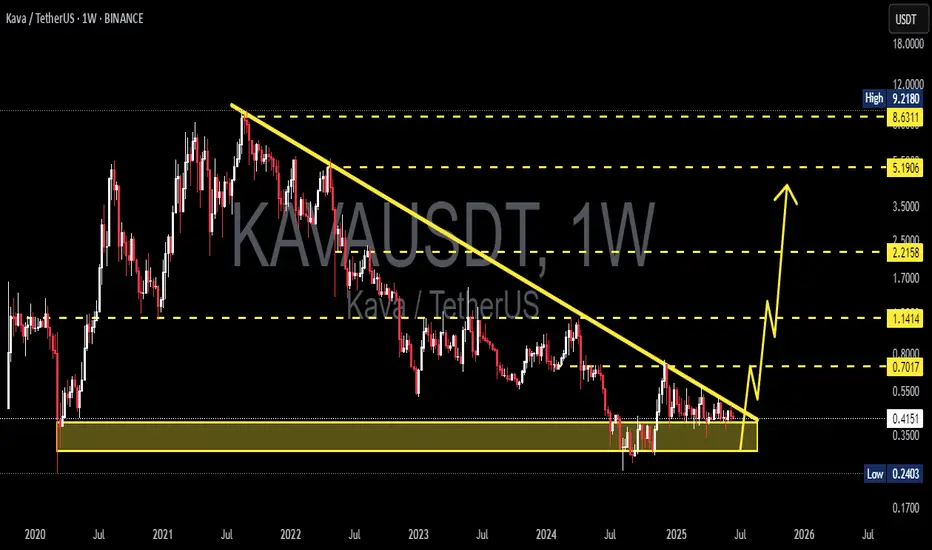
KAVA has been in a prolonged downtrend since 2021, forming a large descending triangle pattern. Currently, the price is nearing the apex of this formation, signaling a potential breakout in the near term.
2. Strong Accumulation Zone
A strong support base has formed between $0.24 – $0.40, which has held for over a year. This suggests significant accumulation by long-term investors at these levels.
3. Breakout Confirmation Imminent
If KAVA successfully breaks above the long-term descending trendline (yellow line), a major shift in market structure could occur, triggering a bullish rally.
4. Key Upside Targets
The following resistance levels may act as profit-taking zones if the breakout confirms:
$0.5308 – Initial minor resistance.
$0.7021 – Psychological resistance zone.
$1.1591 – Previous structural resistance.
$2.2266 – Medium-term upside target.
$5.1542 – $8.5085 – Long-term bull cycle potential targets.
5. Ideal Trading Scenario
Entry Strategy: Buy on breakout confirmation above the trendline or buy on successful retest.
Risk Management: Consider a stop-loss if price falls back below the accumulation zone (~$0.40).
🟢 Conclusion:
KAVA is approaching a critical turning point after a prolonged consolidation phase. A confirmed breakout from this pattern could initiate a strong upward trend, making it a compelling setup for swing traders and long-term investors.
📌 Note: Always apply proper risk management and wait for volume confirmation or supporting indicators before entering any trade.
#KAVA #KAVAUSDT #CryptoBreakout #AltcoinSeason #TechnicalAnalysis #CryptoChart #TradingSignals #BreakoutAlert #CryptoTrading #AltcoinAnalysis #BullishSetup #AccumulationZone

KAVAUSDT 1W AnalysisKAVA ~ 1W Analysis
#KAVA This is the lowest support block for now. Buy from here if you still have faith in this coin with a short term target of at least 15%++
Breaking: $KAVA Surged 10% Today Amidst A Falling Wedge KAVA the Layer-1 blockchain that combines the speed and interoperability of Cosmos with the developer power of Ethereum's native token SEED_DONKEYDAN_MARKET_CAP:KAVA urged 10% today amidst a bullish pennant.
From the first week of December, 2024 SEED_DONKEYDAN_MARKET_CAP:KAVA underwent a falling wedge pattern losing almost 50% of market value. Consequent to the bullish pennant formed, SEED_DONKEYDAN_MARKET_CAP:KAVA coin surged 10% hinting at a 36% surge to the recent high of December 4, 2024.
Kava Price Live Data
The live Kava price today is $0.539085 USD with a 24-hour trading volume of $25,133,445 USD. Kava is up 8.88% in the last 24 hours, with a live market cap of $583,750,357 USD. It has a circulating supply of 1,082,853,482 KAVA coins and the max. supply is not available.

KAVAUSDT 1WKAVA ~ 1W Analysis
#KAVA This is the lowest support for now. Buy gradually from here with a short -term target of at least 20%+.

KAVAUSDT 1WKAVA Update ~ 1W
#KAVA So far it still maintains its bullish structure. If you still have Conviction on this coin,. Buy here, Target 20%++

KAVAUSDT Long-Term Accumulation/Distribution StrategyKAVAUSDT is presenting a compelling opportunity for long-term accumulation and distribution. With an entry price range between $0.65 to $0.4 and a target price of $5, this strategy aims for substantial returns over time.
Weekly charts reveal a significant increase in volume over time, indicating strong accumulation. This accumulation phase suggests underlying strength in the asset, making it an attractive opportunity for investors seeking long-term growth.
Risk Management:
To mitigate risk, consider allocating 1-5% of your portfolio at higher price levels, increasing to 5-10% and 10-20% as prices decline. By diversifying your investments and managing risk levels accordingly, you can navigate market fluctuations effectively.
Note: split your major money like if you have 1000$, split it into 10 parts so each trade has 100$ allocation, now use that 100$ to buy in 1-5%, 5-10% & 10-20% respectively.
With a strategic long-term approach and diligent risk management, KAVAUSDT offers the potential for substantial returns. Remember to think long-term to build sustainable wealth and capitalize on the opportunities presented by this asset.

KAVAUSDTKAVA ~ 1W
#KAVA Back to retesting this support block,. If you still have Conviction on this coin,. This support block would be a good buying spot for now.

KAVAUSDTKAVA ~ 1W ✅
#KAVA This is the final support for this Coin. if you have Conviction on this coin,. This should be a very good price for you to make a purchase. at least for 20%++

KAVAUSD 1WKAVA ~ 1W
#KAVA This is a very good support block to start accumulating again.
Make purchases gradually from here, with a minimum target of 20%+

"KAVA" Extended wave next...Hello, friends. Nice to meet you
After breaking the RISING WEDGE down,
It shows a very strong extended wave.
If the upper line of this extended wave is broken upward, it is likely to rise to the recent high.

KAVAUSDT 5DKAVA ~ 5D 📈
#KAVA Make purchases gradually from here, with a minimum target of 20%++. This Resistance Line will soon be broken. 🚀

KAVAUSDT Elliott Waves AnalysisHello friends.
Please support my work by clicking the LIKE button👍(If you liked). Also i will appreciate for ur activity. Thank you!
Everything on the chart.
Entry: Find your entry point yourself (im in pos from 0.184)
Targets: 1.3 - 1.6 - 1.9 - 2.4
after first target reached move ur stop to breakeven
Stop: 0.67 (depending of ur risk). ALWAYS follow ur RM .
RR: 1 to 10
risk is justified
Good luck everyone!
Follow me on TRADINGView, if you don't want to miss my next analysis or signals.
It's not financial advice.
DYOR!

KAVAUSDT Elliott Waves AnalysisHello friends.
Please support my work by clicking the LIKE button👍(If you liked). Also i will appreciate for ur activity. Thank you!
Everything on the chart.
Targets: 0.92 and 0.98
after first target reached move ur stop to breakeven
Stop: (depending of ur risk). ALWAYS follow ur RM .
risk is justified
Good luck everyone!
Follow me on TRADINGView, if you don't want to miss my next analysis or signals.
It's not financial advice.
Dont Forget, always make your own research before to trade my ideas!
Open to any questions and suggestions

KAVAUSDT Elliott Waves AnalysisHello friends.
Please support my work by clicking the LIKE button👍(If you liked). Also i will appreciate for ur activity. Thank you!
Everything on the chart.
Entry: Market and lower(im on pos from 0.73)
Targets: 0.92 and ~0.98
after first target reached move ur stop to breakeven
Stop: ~0.7 (depending of ur risk). ALWAYS follow ur RM .
risk is justified
Good luck everyone!
Follow me on TRADINGView, if you don't want to miss my next analysis or signals.
It's not financial advice.
Dont Forget, always make your own research before to trade my ideas!
Open to any questions and suggestions

KAVA target 1.54h time frame
-
KAVA is creating a potential long-term double bottom structure. Currently making a cup and handles pattern in lower time frame, this CH provide us a reasonable setting for SL. Also, if KAVA maintain the pumping momentum, there are three targets as below. Risk to reward is great, even only reach the first target.
-
TP: 1~1.05 / 1.17 / 1.5
SL: 0.725

KAVA/USDT 1 Day long position setupBINANCE:KAVAUSDT - 1-day long position setup
KAVA Failing Wedge showing good Reversal at this point .6100 to .6300 Level.
Bullish divergence is suggesting that upward movement is likely in the coming days
Overall, this is a bullish setup for KAVA/USDT, and a long position could be considered.
Please note that this is not financial advice, and you should always do your own research before making any investment decisions.

KAVA price where are you going?Today, KAVA will update its network. And almost at the same time, the announcement of the "fresh" US CPI.
If the two news turn out to be positive, this could be a c-c-combo push for the KAVAUSDT price to move up.
The critical level is $1.20. From this level, the price may begin to rise:
rapid growth along the $1.50-2.30 route
and a correction to $0.80
_____________________
Did you like our analysis? Leave a comment, like, and follow to get more

KAVA Road Map🗺️!!!Hi everyone👋( Reading time less than 2 minutes⏰ ).
If you want to invest in Kava(KAVA) , I suggest you read this post.
🌐 What Is Kava (KAVA) ❗️❓
Kava is a Layer-1 blockchain that combines the speed and interoperability of Cosmos with the developer power of Ethereum.
Kava was built from the ground up to optimize its resources for protocol growth, strengthened by its Cosmos EVM technology that enables maximum scalability, speed, security, and developer support.
Builders on Kava earn a share of Kava Rise's $750M developer incentive fund via the program's blockchain-based distribution method, designed to reward the top protocols every month based on usage.
-----------------------------------------------------------------------------------
Kava started to fall after completing the Diagonal pattern and breaking the lower line of this pattern.
The structure of Kava fall waves is in the form of five impulse waves .
Kava now seems to have completed the main wave 4 on the downtrend line .
🔔I expect the main wave 5 to end in the 🟡 Price Reversal Zone($0.525-$0.359) 🟡 and it will be a suitable area for mid-term investment.
Kava Analyze ( KAVAUSDT ), Weekly time frame ⏰.
Do not forget to put Stop loss for your positions (For every position you want to open).
Please follow your strategy, this is just my Idea, and I will be glad to see your ideas in this post.
Please do not forget the ✅' like '✅ button 🙏😊 & Share it with your friends; thanks, and Trade safe.

Kava Another breakout loading Kavausdt
Formed falling wedge pattern daily timeframe in case of breakout expecting 60-80% bullish move incoming days
Do your own research and always manage risk

Kavasdt Inverted Flag patternInverted Flag pattern in daily time frame
Target mention in chart
I hope my analysis will help you
Please like share
Thanks

KAVAUSDT - The triangle ContinuedYou can find information on the Internet on how to work this triangle.
I will wait for the confirmation of the signal.
The main entry point is a breakout of a trend line or level.
An alternative option if crypto will not be drained
prnt.sc
Last idea
