#KDA/USDT bullish structure formed at the chart#KDA
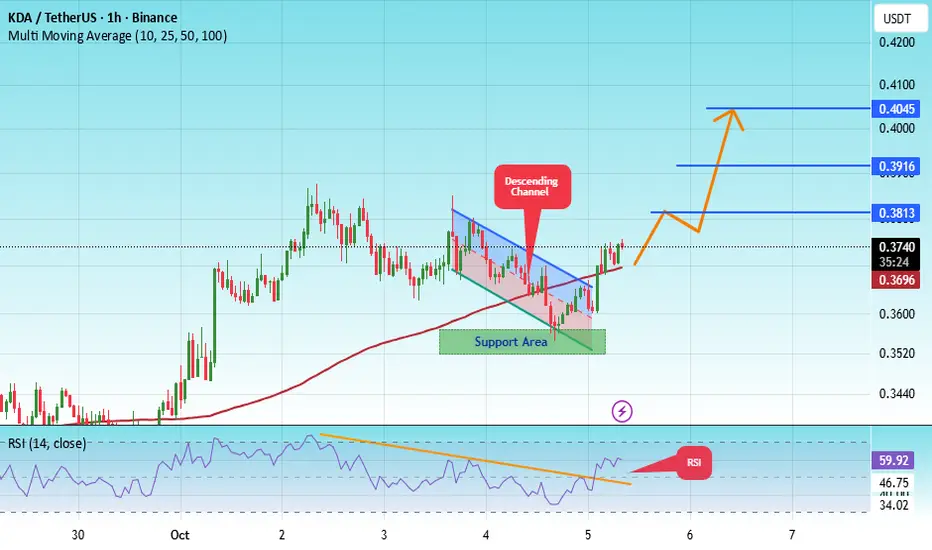
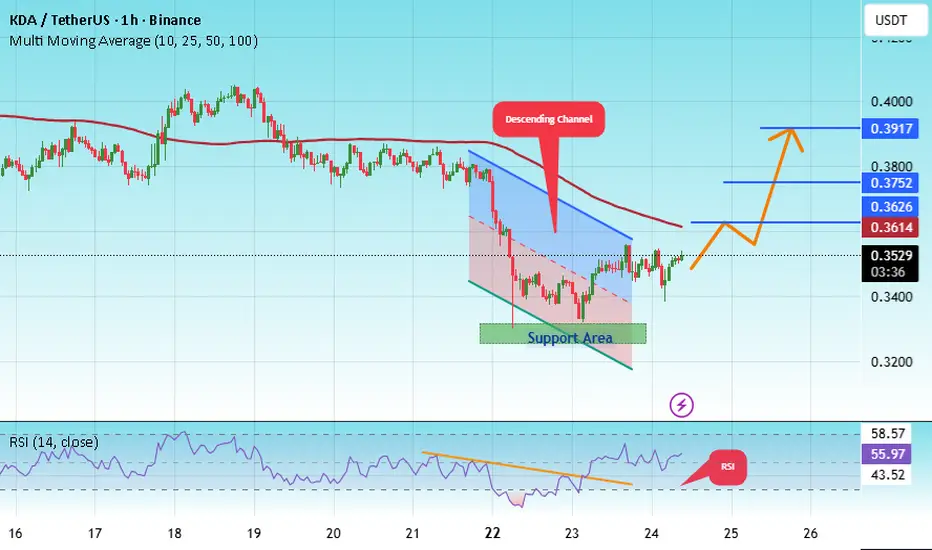
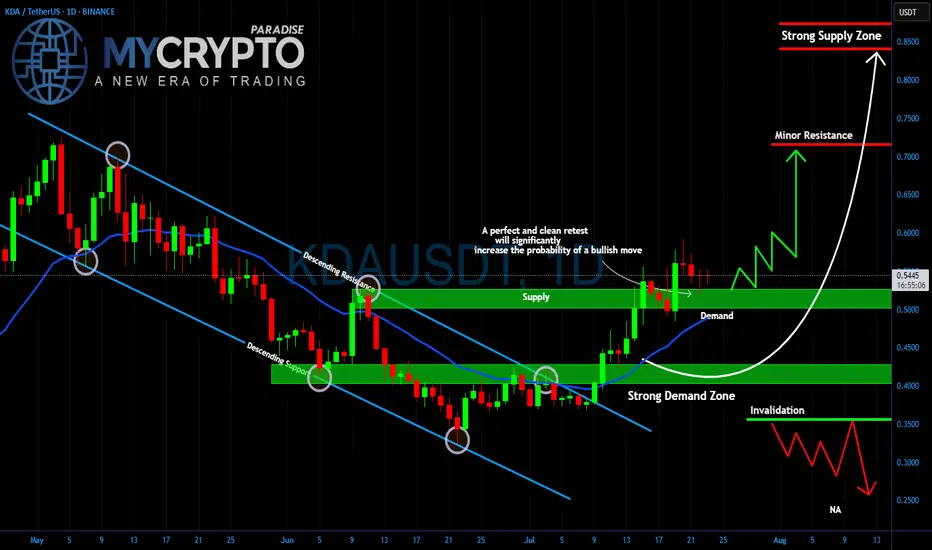
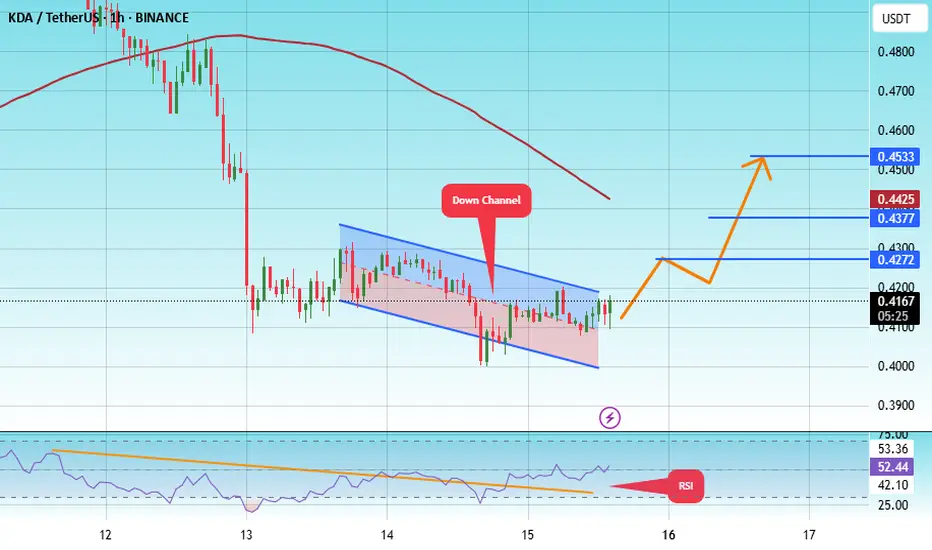
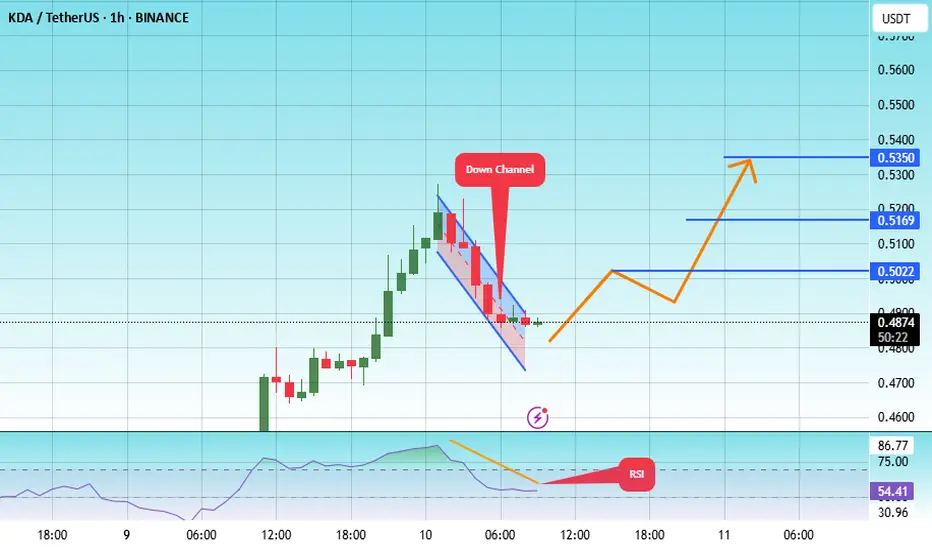
The price is moving within a descending channel on the 1-hour frame, adhering well to it, and is heading for a strong breakout and retest.
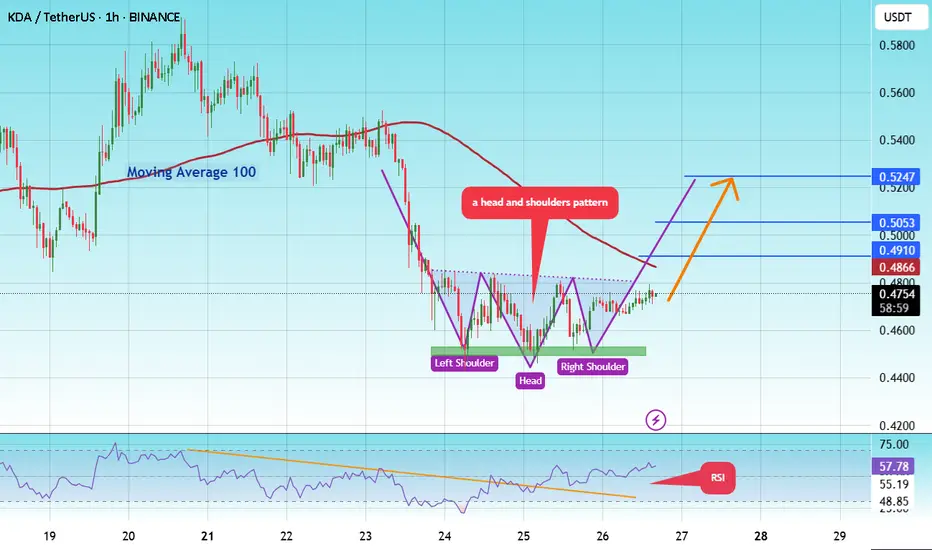
We have a bearish trend on the RSI indicator that is about to be broken and retested, which supports the upward breakout.
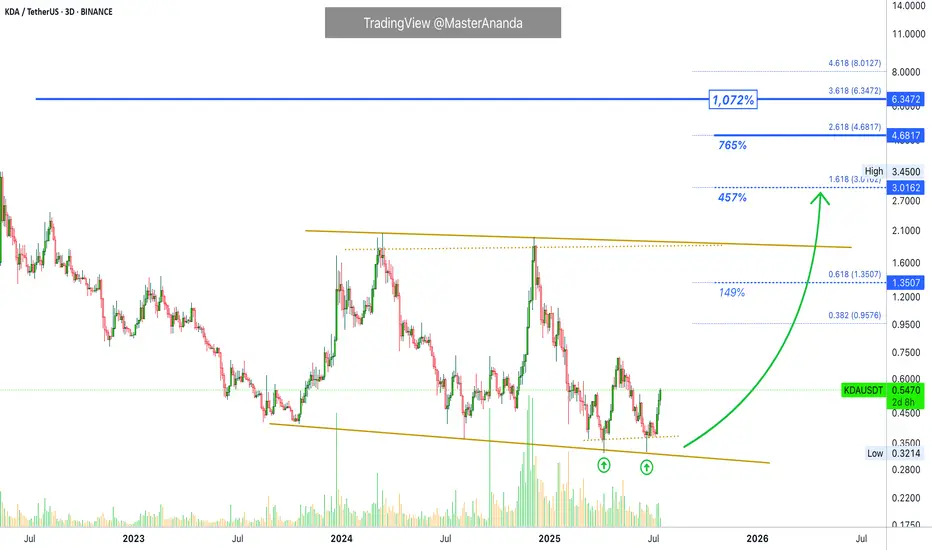
There is a major support area in green at 0.0800, representing a strong support point.
We are heading for consolidation above the 100 moving average.
Entry price: 0.0876
First target: 0.1016
Second target: 0.1160
Third target: 0.1321
Don't forget a simple matter: capital management.
When you reach the first target, save some money and then change your stop-loss order to an entry order.
For inquiries, please leave a comment.
Thank you.
KLong