#KDA/USDT bullish structure formed at the chart#KDA
The price is moving within a descending channel on the 1-hour frame, adhering well to it, and is heading for a strong breakout and retest.
We have a bearish trend on the RSI indicator that is about to be broken and retested, which supports the upward breakout.
There is a major support area in green at 0.0800, representing a strong support point.
We are heading for consolidation above the 100 moving average.
Entry price: 0.0876
First target: 0.1016
Second target: 0.1160
Third target: 0.1321
Don't forget a simple matter: capital management.
When you reach the first target, save some money and then change your stop-loss order to an entry order.
For inquiries, please leave a comment.
Thank you.
KDAUSDT

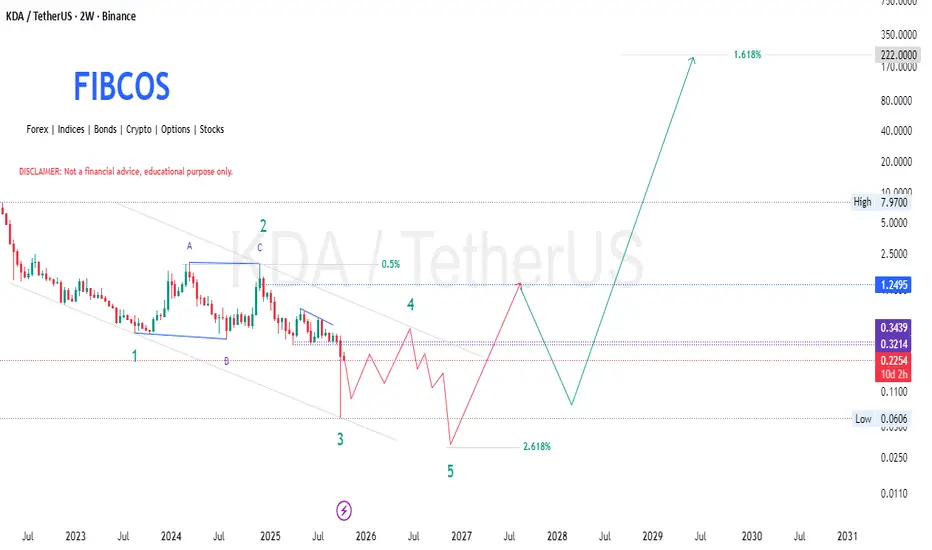
KDA Macro Bottom Forming? Wave 3 Ending, Reversal Setup Brewing🚨 KDA/USDT - Approaching the End of Macro Wave 3 – Reversal Imminent?
After nearly 2 years of consistent decline, Kadena (KDA) appears to be in the final stages of its macro corrective structure. Using a blend of Elliott Wave Theory , Smart Money Concepts (SMC) , Fibonacci tools , and Price Action analysis , there is compelling evidence that we may be forming a generational bottom .
The chart outlines a clean 5-wave Elliott impulse to the downside. With Wave 3 nearing completion in a historically strong demand zone ($0.06–$0.03), the probability of a long-term trend reversal is increasing.
This zone also aligns with:
A full 2.618 Fibonacci extension,
Prior accumulation levels,
A potential liquidity sweep below Wave 3,
Oversold market conditions likely visible on higher timeframes (RSI/MACD divergence).
On the fundamentals side, Kadena continues to innovate with its high-throughput PoW Chainweb architecture , human-readable smart contracts via Pact , and growing DeFi infrastructure. It remains one of the most undervalued layer-1s in the market with zero major security exploits since launch.
🔮 If the reversal confirms , long-term targets lie at:
$1.25 (0.5 Fib Retracement)
$7.97 (prior high)
$222 (1.618 macro extension, multi-year projection)
This setup may not play out overnight, but it's the type of structure that smart money patiently builds positions into , while retail fears the bottom.
📊 1. Elliott Wave Theory Confluence
Looking at the macro Elliott Wave structure:
🔹 A clear 5-wave impulsive decline appears to be forming:
Wave 1 & 2 have already played out.
Wave 3, being the most aggressive, is complete or near completion.
Wave 4 retracement was shallow and corrective (possibly a bear flag/pennant).
Wave 5 is projected to complete with a final leg lower— potential bottom expected before a strong reversal.
🔹 Post wave 5, an ABC corrective wave or a larger impulsive reversal is projected (labeled on chart), suggesting a macro trend shift .
🧠 2. Smart Money Concepts (SMC)
💰 Accumulation Zones:
Price is hovering in a demand zone (between $0.06 - $0.25).
This area has high probability of institutional accumulation as retail sells into fear.
📉 Liquidity Sweeps:
Recent price action shows a sharp move down, likely a liquidity grab below previous swing lows (a classic SMC manipulation before reversal).
The anticipated "spring" move from this zone aligns with Wyckoff accumulation patterns.
🔄 Break of Structure (BoS):
A break above the corrective structure post-wave 5 would confirm a bullish market structure shift .
🌀 3. Fibonacci Retracement & Extension
🔹 Fibonacci Extension:
Wave 3 extension seems to have reached the 2.618% level , which is a textbook Elliott wave projection level.
This provides high confluence that Wave 5 bottom may be close.
🔹 Fibonacci Retracement Targets:
Retracement to 0.5 - 0.618 Fibonacci zone (~$1.25 - $7.97) expected in post-wave rally.
The ultimate 1.618 extension target (~$222) could play out if a macro bull cycle aligns , possibly by 2029.
🕵️♂️ 4. Price Action Analysis
📉 Bearish Channel Breakdown :
Price has followed a descending channel and is nearing the lower boundary.
False breakdowns often result in violent reversals .
📈 Bullish Divergence (likely on RSI) :
If RSI or other momentum indicators show divergence, this adds confirmation for a reversal setup .
📌 Key Levels to Watch :
Resistance : $0.3439, $1.25, $7.97
Support : $0.13, $0.06, $0.03
A break and hold above $1.25 could signal the start of a macro uptrend .
🔮 Final Thoughts
🔁 We're likely nearing the end of a macro bearish cycle (Wave 3) .
💼 With institutional accumulation signs , Fibonacci confluence , and solid fundamentals **, KDA presents a strong asymmetric opportunity .
🧨 If Wave 5 completes near $0.06 - $0.03, the upside potential toward $7.97 (first macro target) and possibly $222 (1.618 extension) offers high R/R (risk/reward) for long-term investors.
⚠️ DISCLAIMER: This analysis is educational and not financial advice. Always DYOR (Do Your Own Research).
#KDA #KDAUSDT #Kadena #CryptoAnalysis #ElliottWave #SmartMoney #Wyckoff #TechnicalAnalysis #CryptoReversal #AltcoinAnalysis #PriceAction #Fibonacci #Layer1 #CryptoFundamentals #TradingSetup #LongTermHold #Accumulation #CryptoMacro #TradingEducation #WaveTheory #Cryptocurrency
#KDA/USDT bullish structure formed at the chart#KDA
The price is moving within a descending channel on the 1-hour frame, adhering well to it, and is heading for a strong breakout and retest.
We have a bearish trend on the RSI indicator that is about to be broken and retested, which supports the upward breakout.
There is a major support area in green at 0.2170, representing a strong support point.
We are heading for consolidation above the 100 moving average.
Entry price: 0.2184
First target: 0.2245
Second target: 0.2294
Third target: 0.2364
Don't forget a simple matter: capital management.
When you reach the first target, save some money and then change your stop-loss order to an entry order.
For inquiries, please leave a comment.
Thank you.

#KDA/USDT bullish structure formed at the chart#KDA
The price is moving within a descending channel on the 1-hour frame, adhering well to it, and is heading for a strong breakout and retest.
We have a bearish trend on the RSI indicator that is about to be broken and retested, which supports the upward breakout.
There is a major support area in green at 0.2400, which represents a strong support point.
We are heading for consolidation above the 100 moving average.
Entry price: 0.2534
First target: 0.2607
Second target: 0.2694
Third target: 0.2780
Don't forget a simple matter: capital management.
When you reach the first target, save some money and then change your stop-loss order to an entry order.
For inquiries, please leave a comment.
Thank you.

KDA/USDT – 10x Setup Loading 🔍 1. Elliott Wave Theory – Wave Confluence
From the chart:
We can clearly observe a complex corrective pattern forming a WXYXZ or triple three structure.
The wave labels (A, B, C in red/blue) suggest that the market may have completed a macro correction.
The current price action is showing a potential start of an impulsive wave, marking the beginning of Wave 1 of a new bullish cycle 📈.
🧩 Key Confluences:
Final leg (C wave) seems to have ended with a falling wedge pattern, a classic reversal signal.
Bullish divergence likely present on momentum indicators (not shown but inferred), supporting wave completion.
💹 2. Price Action Analysis
Price action is forming a base structure around $0.32 - $0.34 with:
Multiple retests of the demand zone (highlighted around $0.3214 and $0.3439).
A strong bullish engulfing candle near the low, suggesting institutional accumulation.
Current price ($0.3704) has already broken out of a descending wedge pattern (D wave to E), which often precedes explosive moves.
📌 Short-Term Structure:
Breakout above minor resistance at $0.41 would confirm a bullish reversal pattern.
Targets based on historical PA zones are set at $1.14, $1.24, $2.48, and $3.51 📍.
📐 3. Fibonacci Retracement & Extension
Let’s bring in some Fibonacci magic ✨:
If we take the high of Wave (B) and the low of Wave (C), potential retracement levels align with:
0.618 Fib at ~$1.14 ✅
1.0 Fib at ~$2.48 ✅
1.618 Fib at ~$3.51✅
These Fibonacci levels align beautifully with price structure resistance zones, showing confluence between fibs and market structure.
📊 Fibonacci Extension Target:
A minimum 5x-10x move is projected from current price, which takes us close to $3.50+, aligning with the major 1.618 extension.
🧠 4. Smart Money Concept (SMC)
Let’s talk about what the "big money" might be doing 🧠💰:
✅ Accumulation Phase Identified:
Price is ranging after a prolonged markdown.
Liquidity sweeps below previous lows suggest smart money engineered a bear trap to fill orders.
Break of structure (BoS) pending above $0.41, which would confirm smart money shift from accumulation to mark-up phase.
🎯 Ideal Smart Money Entry: Sub-$0.40 range.
📈 Next Liquidity Target: $1.24 (equal highs formed during mid-2024).
🌐 5. Fundamentals of Kadena (KDA)
Kadena is a layer-1 blockchain featuring a hybrid PoW (proof-of-work) model with scalability via Chainweb.
📌 Bullish Fundamentals:
Scalability: Can process 480k+ TPS across multiple chains.
Security: PoW-based, making it more secure than many PoS chains.
Smart Contracts: Uses Pact, a readable and secure smart contract language.
Ecosystem Expansion: Increasing DeFi, NFT, and DAO involvement.
Recent Funding: If there's been recent VC or foundation investment (check latest news), it would support a bull case.
🚀 Catalysts to Watch:
New partnerships or major DApps launching.
Exchange listings or ecosystem grants.
Rising sentiment in broader altcoin market.
📈 Final Thoughts & Outlook
🔥 Technical + SMC + Fundamentals are aligning for a potential major move.
🧭 Strategic Outlook:
🎯 Buy Zone: $0.32 - $0.38 (Accumulation Range)
🚨 Breakout Confirmation: Above $0.41
🚀 Targets:
$1.14 ✅ (0.618 Fib + structure)
$2.48 ✅ (1.0 Fib + structure)
$3.51 ✅ (1.618 Fib + macro resistance)
"The bigger the base, the higher the space" — and Kadena seems to be building a strong one 👷♂️🧱
⚠️ DISCLAIMER: This is for educational purposes only. Not financial advice. Always do your own research (DYOR) and manage risk appropriately. Crypto is volatile 🔥.
#KDA #KDAUSDT #Kadena #Altcoins #CryptoAnalysis #ElliottWave #WaveTheory #PriceAction #SmartMoneyConcepts #SMC #Fibonacci #TechnicalAnalysis #CryptoTrading #CryptoCharts #BullishSetup #AccumulationPhase #BreakoutTrade #10xPotential #CryptoFundamentals #LongTermInvesting #SwingTrading #TradingViewCommunity

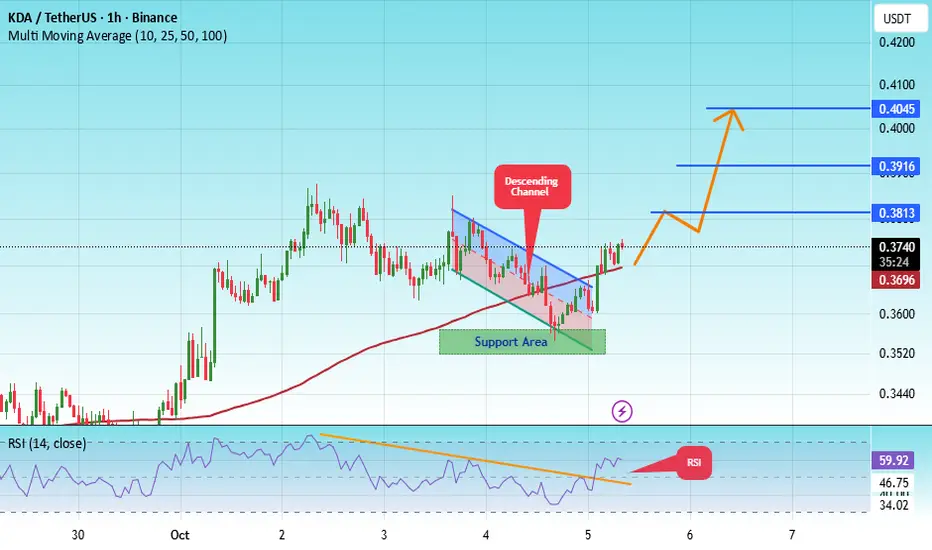
#KDA/USDT bullish structure formed at the chart#KDA
The price is moving within a descending channel on the 1-hour frame, adhering well to it, and heading for a strong breakout and retest.
We have a bearish trend on the RSI indicator that is about to be broken and retested, which supports the upward breakout.
There is a major support area in green at 0.3540, which represents a strong support point.
We are heading for consolidation above the 100 moving average.
Entry price: 0.3735
First target: 0.3813
Second target: 0.3916
Third target: 0.4045
Don't forget a simple matter: capital management.
When you reach the first target, save some money and then change your stop-loss order to an entry order.
For inquiries, please leave a comment.
Thank you.
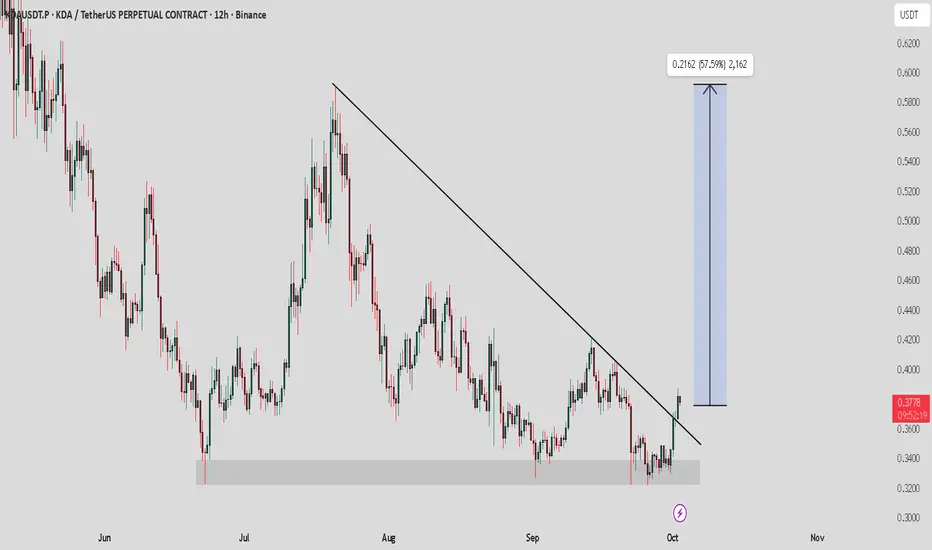
KDA/USDT – Critical Support: Major Rebound or Final Breakdown?🔍 Market Overview
Kadena (KDAUSDT) is currently testing a major historical support zone between 0.31 and 0.37, a demand area that has repeatedly absorbed heavy selling since 2021.
This yellow region on the chart represents a long-term accumulation zone — a critical area where sellers usually exhaust and buyers begin to regain control.
Since peaking in late 2021, KDA has been in a macro downtrend, printing consistent lower highs and lower lows.
However, recent price action shows a flattening structure — suggesting a potential base formation phase, often the prelude to a new macro uptrend if confirmed.
---
🧭 Key Technical Levels (Weekly)
Main Support Zone (highlighted): 0.31 – 0.37 → the final line of defense for long-term buyers.
Major Resistances:
R1 = 0.6277
R2 = 0.8354
R3 = 1.3567
R4 = 1.7615
R5 = 5.5285
R6 = 7.6381
R7 = 15.3227
These resistance zones represent potential retracement targets if a new bullish cycle begins from the current base.
---
📉 Pattern & Structural Context
Macro structure: long-term downtrend but transitioning into possible sideways accumulation.
Likely pattern: accumulation range / double bottom forming near historical demand.
Candle behavior: multiple long lower wicks signaling strong buying pressure and rejection from the lower boundary.
If the range continues to hold, a macro reversal base could be forming — a structure typical before the start of a sustained bullish trend.
---
🟩 Bullish Scenario
1. A strong rejection from 0.31–0.37 with a bullish engulfing or marubozu candle on the weekly timeframe would mark the beginning of a rebound.
2. Initial confirmation: weekly close above 0.6277 (R1) opens the path toward 0.8354 (R2).
3. If price forms higher lows and higher highs above R2, bullish momentum could extend toward 1.3567 – 1.7615, the next key supply area.
4. In a macro bullish cycle, long-term upside targets remain around 5.5 – 7.6, but such levels depend on the broader crypto market recovery (BTC & ETH performance).
Technical confirmations:
Weekly RSI escaping oversold territory → potential early signal of momentum reversal.
Increasing volume on dips → suggests institutional accumulation behavior.
---
🟥 Bearish Scenario
1. A weekly close below 0.31 would confirm a breakdown, exposing price to a decline toward 0.20–0.22, and potentially 0.10–0.12 in extreme conditions.
2. Failure to reclaim the 0.31–0.37 zone quickly after a breakdown would confirm a continuation of the macro bearish trend.
3. Rising sell volume during breakdown phases would indicate strong distribution and exit from long-term holders.
---
⚖️ Strategic Outlook
Aggressive swing approach:
Buy entries between 0.34–0.37, stop below 0.29–0.30, targets 0.63–0.83 (R1–R2).
→ Risk/Reward ratio exceeds 3:1 if support holds.
Conservative confirmation approach:
Wait for a weekly close above 0.63, then buy on retest, targeting 1.35–1.76 (R3–R4).
Short opportunity:
If 0.31 breaks down with strong volume, short rallies toward 0.35–0.40 with stops above 0.45, aiming for 0.20.
> This area is the “make-or-break” zone for Kadena — either it becomes the foundation for a macro reversal, or the start of a deeper bearish continuation.
---
📊 Conclusion
KDAUSDT is now at its most critical support since 2022.
The 0.31–0.37 zone acts as the “last stand” for buyers.
If this level holds, it could mark the beginning of a long-term accumulation phase that precedes a new bullish cycle.
However, a weekly close below 0.31 would likely confirm further macro downside, pushing KDA into deeper territory.
Broader crypto sentiment and BTC’s trend will play a key role in validating whichever direction KDA takes next.
---
#KDAUSDT #Kadena #CryptoAnalysis #TechnicalAnalysis #PriceAction #SupportResistance #WeeklyChart #CryptoTrading

KDA / USDT : Momentum building after a successful breakoutKDA / USDT has confirmed its breakout with strong potential. If momentum sustains, we can expect a bullish rally towards $0.50 – $0.60.
Always manage risk wisely and avoid entering without proper confirmation.
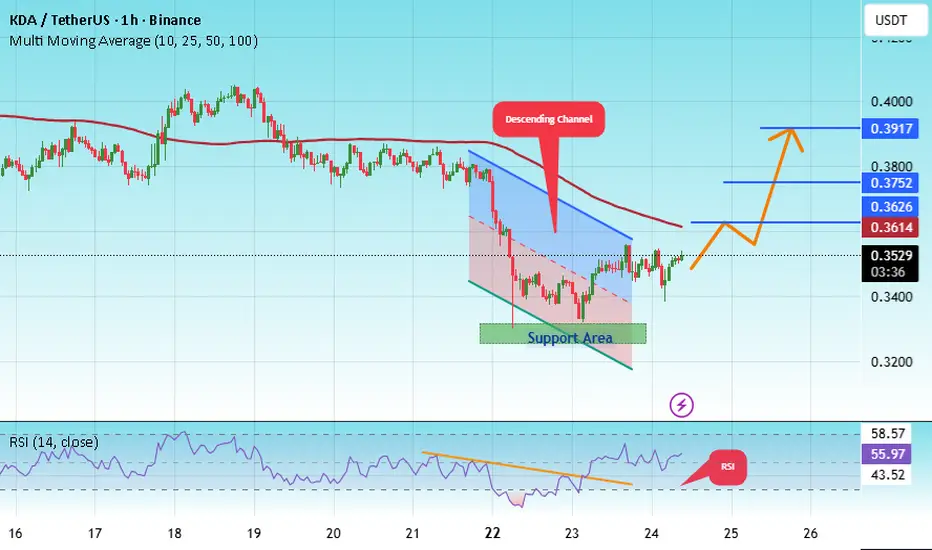
#KDA/USDT bullish structure formed at the chart#KDA
The price is moving within a descending channel on the 1-hour frame, adhering well to it, and is heading for a strong breakout and retest.
We have a bearish trend on the RSI indicator that is about to be broken and retested, which supports the upward breakout.
There is a major support area in green at 0.3284, which represents a strong support point.
We are heading for consolidation above the 100 moving average.
Entry price: 0.3518
First target: 0.3626
Second target: 0.3752
Third target: 0.3917
Don't forget a simple matter: capital management.
When you reach the first target, save some money and then change your stop-loss order to an entry order.
For inquiries, please leave a comment.
Thank you.
#KDA/USDT bullish structure formed at the chart#KDA
The price is moving within a descending channel on the 1-hour frame, adhering well to it, and heading for a strong breakout and retest.
We have a bearish trend on the RSI indicator that is about to be broken and retested, which supports the upward breakout.
There is a major support area in green at 0.3772, representing a strong support point.
We are heading for consolidation above the 100 moving average.
Entry price: 0.3800
First target: 0.3875
Second target: 0.3937
Third target: 0.4020
Don't forget a simple matter: capital management.
When you reach the first target, save some money and then change your stop-loss order to an entry order.
For inquiries, please leave a comment.
Thank you.

#KDA/USDT Stay Adaptive ?#KDA
The price is moving within a descending channel on the 1-hour frame and is expected to break and continue upward.
We have a trend to stabilize above the 100 moving average once again.
We have a downtrend on the RSI indicator that supports the upward move with a breakout.
We have a support area at the lower boundary of the channel at 0.3517, acting as strong support from which the price can rebound.
We have a major support area in green that pushed the price upward at 0.3480.
Entry price: 0.3610.
First target: 0.3687.
Second target: 0.3768.
Third target: 0.3866.
To manage risk, don't forget stop loss and capital management.
When you reach the first target, save some profits and then change the stop order to an entry order.
For inquiries, please comment.
Thank you.

KadenaKda usdt daily analysis
Time frame daily
Risk rewards ratio >4.2 👈👌
Target 0.58$
I have a short time long position for kadena with same Risk rewards ratio
Entrance = 0.36$
Target = 0.45$
LS =0.34$

KDA/USDT — Accumulation or Annihilation? Key Decision Zone!🧩 Big Picture
Kadena (KDA) is still trapped in a long-term consolidation phase after its sharp decline from the 2021 peak. Currently, price is holding at the 0.31–0.42 USDT support zone, which has acted as a “last fortress” for buyers for over 3 years.
The structure is intriguing: despite the dominant macro downtrend (a series of lower highs), this yellow zone has consistently rejected breakdowns. This suggests silent accumulation from long-term market participants.
---
🔍 Pattern & Price Structure
Key support: 0.31–0.42 (yellow box) → tested multiple times since 2022.
Extended sideways: market in a narrow range, signaling a phase of capitulation → distribution → accumulation.
Supply zones (resistance): 0.6277 → 0.8354 → 1.3567.
Momentum: though weak, repeated wicks near 0.31 show buyers still defending the level.
In short, KDA now sits at a psychological pivot between survival and collapse.
---
🚀 Bullish Scenario
If demand remains strong, a mid-term reversal could emerge:
1. Initial rebound: weekly close above 0.42 → potential rally toward 0.6277 → 0.8354.
2. Reversal confirmation: weekly close above 0.8354 with rising volume → targets 1.3567 → 1.7615.
3. Extended targets: if broader crypto sentiment improves, a recovery toward 5.5285 → 7.6381 is possible.
👉 Bullish Key: KDA must reclaim and hold above 0.6277 to “come back to life.”
---
🩸 Bearish Scenario
If buyers fail to hold 0.31, the consequences are severe:
1. Strong breakdown: weekly close below 0.31 → opens the door toward 0.20 or even 0.10 (no strong historical support).
2. Retest as resistance: once broken, 0.31–0.42 flips into distribution zone → sellers gain control.
3. Market psychology: losing this support could trigger panic selling, as it’s been the foundation since 2022.
👉 Bearish Key: Safe as long as 0.31 holds. If it breaks, expect continuation of the bearish trend.
---
📌 Key Levels
Major support: 0.31 – 0.42
Near resistances: 0.6277 → 0.8354 → 1.3567 → 1.7615
Bullish targets: 5.5285 → 7.6381 → 15.3227 → 21.9739
Breakdown zone: 0.20 → 0.10
---
🎯 Extra Insight
The yellow zone = “the battleground of long-term investors.”
Current pattern resembles an extended bottoming phase → could be a golden accumulation opportunity, or a trap if support collapses.
Best described as: “accumulation or annihilation.”
Waiting for a weekly confirmation is crucial to avoid false breakouts or breakdowns.
---
📢 Conclusion
KDA/USDT is at a critical balance point.
Bullish case: breakout above 0.6277 opens the path to 0.8354–1.3567.
Bearish case: breakdown below 0.31 risks further decline to 0.20–0.10.
📌 For investors: this zone may offer high-risk accumulation with high potential reward.
📌 For traders: watch 0.31 support and 0.6277 resistance for entry/exit signals.
#KDA #KDAUSDT #Kadena #CryptoAnalysis #PriceAction #SupportResistance #Altcoins #CryptoSignals #TechnicalAnalysis

#KDA/USDT Stay Adaptive ?#KDA
The price is moving within an ascending channel on the 1-hour frame, adhering well to it, and is on its way to breaking strongly upwards and retesting it.
We have support from the lower boundary of the ascending channel, at 0.3848.
We have a downtrend on the RSI indicator that is about to break and retest, supporting the upside.
There is a major support area (in green) at 0.3820, which represents a strong basis for the upside.
Don't forget a simple thing: ease and capital.
When you reach the first target, save some money and then change your stop-loss order to an entry order.
For inquiries, please leave a comment.
We have a trend to hold above the 100 Moving Average.
Entry price: 0.3888.
First target: 0.4020.
Second target: 0.4182.
Third target: 0.4370.
Don't forget a simple thing: ease and capital.
When you reach the first target, save some money and then change your stop-loss order to an entry order.
For inquiries, please leave a comment.
Thank you.

#KDA/USDT Stay Adaptive ?#KDA
The price is moving within an ascending channel on the 1-hour frame, adhering well to it, and is on track to break it strongly upwards and retest it.
We have support from the lower boundary of the ascending channel, at 0.4300.
We have a downtrend on the RSI indicator that is about to break and retest, supporting the upside.
There is a major support area in green at 0.4280, which represents a strong basis for the upside.
Don't forget a simple thing: ease and capital.
When you reach the first target, save some money and then change your stop-loss order to an entry order.
For inquiries, please leave a comment.
We have a trend to hold above the 100 Moving Average.
Entry price: 0.4690.
First target: 0.4474.
Second target: 0.4570.
Third target: 0.4690.
Don't forget a simple thing: ease and capital.
When you reach the first target, save some money and then change your stop-loss order to an entry order.
For inquiries, please leave a comment.
Thank you.

#KDA/USDT Stay Adaptive ?#KDA
The price is moving within a descending channel on the 1-hour frame, adhering well to it, and is on its way to breaking it strongly upwards and retesting it.
We have a bounce from the lower boundary of the descending channel. This support is at 0.4260.
We have a downtrend on the RSI indicator that is about to be broken and retested, supporting the upside.
There is a major support area in green at 0.4186, which represents a strong basis for the upside.
Don't forget a simple thing: ease and capital.
When you reach the first target, save some money and then change your stop-loss order to an entry order.
For inquiries, please leave a comment.
We have a trend to hold above the 100 Moving Average.
Entry price: 0.4530
First target: 0.4625
Second target: 0.4754
Third target: 0.4932
Don't forget a simple thing: ease and capital.
When you reach the first target, save some money and then change your stop-loss order to an entry order.
For inquiries, please leave a comment.
Thank you.

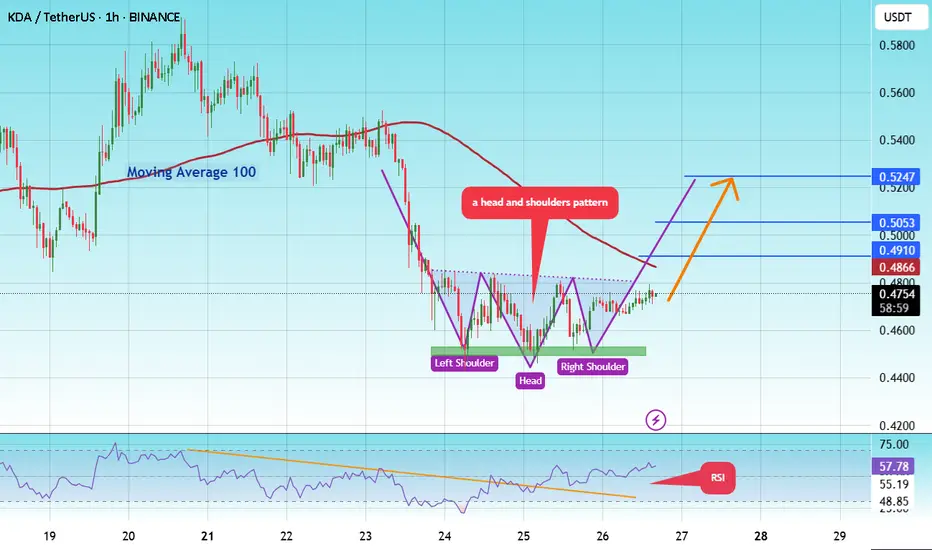
#KDA/USDT Stay Adaptive ! #KDA
The price is moving in a head and shoulders pattern on the 1-hour frame and is expected to break and continue higher.
We have a trend to stabilize above the 100 moving average once again.
We have a bearish trend on the RSI indicator, supporting the upward move with a break above it.
We have a support area at the lower boundary of the head and shoulders at 0.4545, acting as strong support from which the price can rebound.
We have a major support area in green that pushed the price higher at 0.4490.
Entry price: 0.4747
First target: 0.4910
Second target: 0.5053
Third target: 0.5247
To manage risk, don't forget stop loss and capital management.
When you reach the first target, save some profits and then change your stop order to an entry order.
For inquiries, please comment.
Thank you.
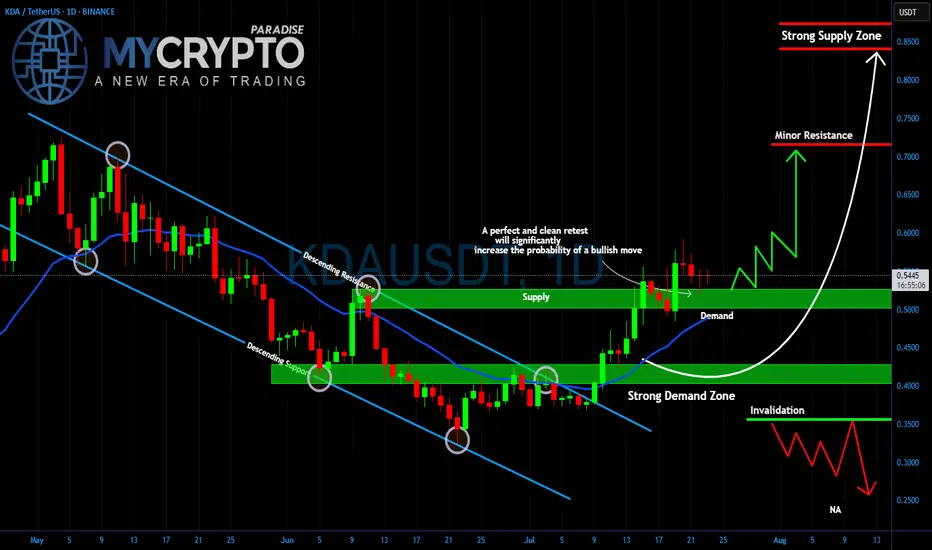
KDA Breakout or Fakeout? Critical Retest AheadYello Paradisers, is #KDA setting up for a major bullish move, or are we looking at another trap designed to wipe out impatient traders? The price has broken out of the descending channel that has been controlling the market for weeks, and now all eyes are on the retest.
💎The strong demand zone around $0.40–0.45 has been the key accumulation area for weeks, holding firmly every time the price dipped. Right now, #KDAUSDT is trading above the $0.50–0.55 demand level, which is acting as a critical support. A clean and confirmed retest of this zone would dramatically increase the probability of a bullish continuation.
💎If buyers step in aggressively, the first target will be the minor resistance at $0.70. Breaking above that could open the way for a push toward the strong supply zone at $0.85, where heavy selling pressure is expected. But if the demand fails and price drops below $0.35, this bullish scenario is invalidated, and a deeper move towards $0.25 becomes likely.
Trade smart, Paradisers. This game rewards patience and discipline, not reckless entries. Stick to your strategy, and you will stay ahead of the herd.
MyCryptoParadise
iFeel the success🌴
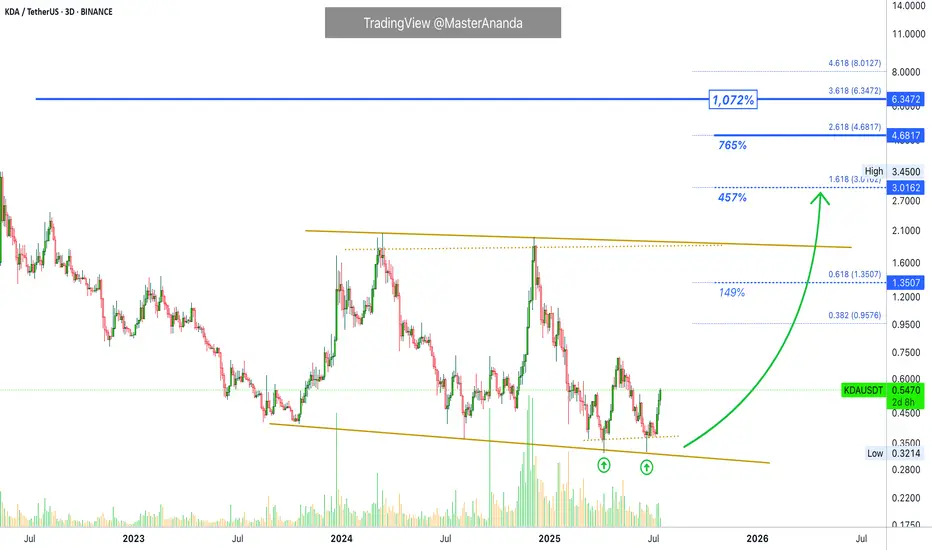
Kadena · 457% First Followed by Additional GrowthWhat should we be calling the first impulse? It is already here.
Good afternoon my fellow Cryptocurrency trader, the altcoins bull market is now.
It is already here. We are now seeing marketwide bullish action. There is only one variant present, one possible outcome only; increased bullish momentum. From now on, you will see daily bullish momentum grow.
Kadena is ready to move higher. The current move will produce a minimum of 450%, and this won't be all this project has to offer, this will signal the end of the first portion of the bullish wave. There will be additional growth after a stop after this first target is hit.
Since 9-July we have only full green candles. There will be more, more and more. Trust and you will be rewarded. Hold now, buy (yesterday), sell in several weeks or in a matter of months. You can sell—when prices are high—just to buy back lower when the correction comes. You can sell and move to a new trading pair because there will be hundreds of options blowing up.
This is just a friendly reminder. The time is now. 100% certainty.
We are moving ahead. Profits are yours to make.
Namaste.
#KDA/USDT UPDATE .#KDA
The price is moving within a descending channel on the 1-hour frame, adhering well to it, and is on its way to breaking it strongly upwards and retesting it.
We have a bounce from the lower boundary of the descending channel. This support is at 0.3665.
We have a downtrend on the RSI indicator that is about to be broken and retested, supporting the upside.
There is a major support area in green at 0.3663, which represents a strong basis for the upside.
Don't forget a simple thing: ease and capital.
When you reach the first target, save some money and then change your stop-loss order to an entry order.
For inquiries, please leave a comment.
We have a trend to hold above the 100 Moving Average.
Entry price: 0.3824
First target: 0.3909
Second target: 0.4041
Third target: 0.4195
Don't forget a simple thing: ease and capital.
When you reach the first target, save some money and then change your stop-loss order to an entry order.
For inquiries, please leave a comment.
Thank you.

KDA/USDT – Major Reversal Brewing from Multi-Year Demand Zone?🔍 Technical Breakdown – Weekly Timeframe
Kadena (KDA) is currently trading at a make-or-break level after months of persistent downtrend. The price is revisiting a historical multi-year demand zone between $0.31 - $0.45, an area that previously acted as a launchpad for major rallies.
This range has consistently attracted buyers, forming a strong base of accumulation, as observed in mid-2021 and mid-2022. Now, once again, KDA is testing this critical zone — and all eyes are on whether it will spark the next impulsive leg up.
🧠 Pattern Structure:
Price has formed a potential Triple Bottom / Rounded Accumulation pattern on the weekly chart.
Strong bullish divergence is visible (if confirmed by RSI or MACD).
Long-term sideways consolidation hints at phase of accumulation, common before breakout rallies.
A clean break above local resistance zones may trigger a multi-level Fibonacci extension rally.
🟢 Bullish Scenario:
If price holds and confirms a rebound from this yellow demand box, watch for a bullish breakout with the following key resistance targets:
1. 🔹 $0.6277 – Minor local resistance
2. 🔹 $0.8354 – Former swing high (early 2024)
3. 🔹 $1.1000 – Psychological & structural level
4. 🔹 $1.3567 – Weekly resistance
5. 🔹 $1.7615 – Medium-term target zone
💥 Extension Targets for Macro Bulls:
$5.5285 – Previous major high
$7.6381 – Major resistance from 2022
$15.3227 and $21.9739 – Long-term fib levels from all-time high retracement
✅ Bullish confirmation requires a weekly close above $1.10 with rising volume and higher highs.
🔴 Bearish Scenario:
If price closes below $0.31 with strong bearish momentum:
Expect continuation of macro downtrend.
No strong support structure below; risk of falling into uncharted territory or sub-$0.20 levels.
Breakdown could lead to capitulation and extended bear phase.
⚠️ Manage risk accordingly. Invalidating the current demand zone could shift the entire structure to a distribution model.
📊 Market Psychology & Volume Profile Insight
Extended sideways action and low volatility can signal the end of bearish momentum.
A breakout from this long-term base often leads to explosive upside as weak hands are flushed out.
Volume spikes near the bottom zones indicate smart money accumulation.
🧭 Strategic Note for Traders:
This setup offers a high reward-to-risk ratio, especially for swing and position traders. Early entry within the accumulation zone with tight stop-loss (below $0.30) could provide a golden opportunity — but only if confirmed with volume and price strength.
#KDAUSDT #Kadena #CryptoBreakout #AltcoinAnalysis #TechnicalAnalysis #SupportAndResistance #TripleBottom #BullishSetup #CryptoSignals #AccumulationPhase

#KDA/USDT#KDA
The price is moving within a descending channel on the 1-hour frame, adhering well to it, and is heading for a strong breakout and retest.
We are seeing a rebound from the lower boundary of the descending channel, which is support at 3370.
We have a downtrend on the RSI indicator that is about to be broken and retested, supporting the upward trend.
We are looking for stability above the 100 moving average.
Entry price: 0.3420
First target: 0.3526
Second target: 0.3646
Third target: 0.3800

KDAUSDT 1W Analysis KDA ~ 1W Analysis
#KDA This is the lowest support for now. Buy if you still have confidence in this coin with a short term target of at least 15%+ from this support.
