KERNEL/USDT – Symmetrical Triangle Nearing a Major Breakout?📝 Overview
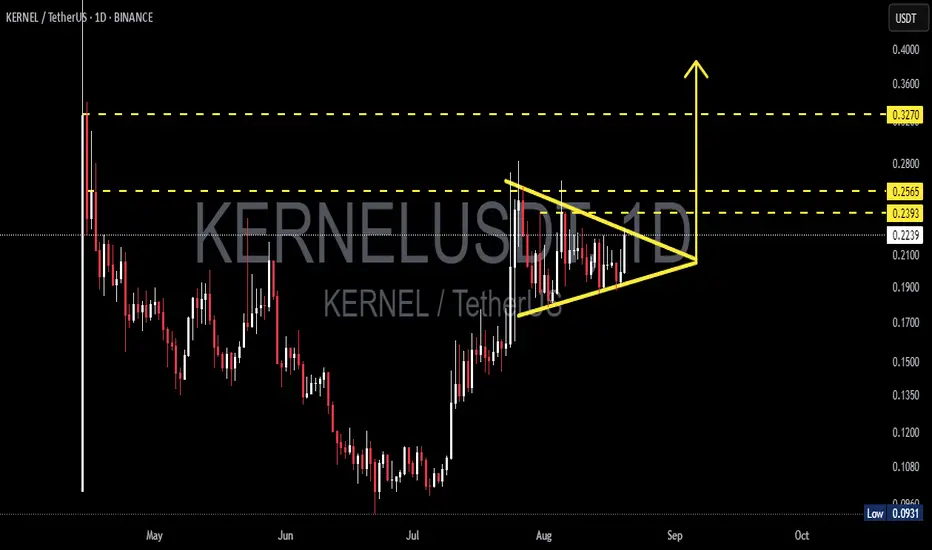
KERNEL price is currently trading around $0.2228, consolidating inside a symmetrical triangle on the daily timeframe. This pattern indicates a period of equilibrium between buyers and sellers, where volatility contracts before a decisive move. While symmetrical triangles often act as continuation patterns, they can also trigger reversals if confirmed by strong volume.
📐 Pattern & Chart Structure
After dropping to a low of $0.0931, KERNEL staged a strong rebound.
Since July–August, the price has been compressing into a series of higher lows and lower highs, forming a classic symmetrical triangle.
Key levels to watch:
🔹 Minor resistance: $0.2393
🔹 Key resistance: $0.2565
🔹 Major resistance: $0.3270
🔹 Dynamic support: $0.210 – $0.218 (triangle bottom)
🔹 Further supports: $0.190 – $0.170
---
🚀 Bullish Scenario (Upside Breakout Potential)
1. A break and daily close above $0.234–$0.236 would be the first confirmation of bullish continuation.
2. With strong volume, upside targets are:
🎯 TP1: $0.2393
🎯 TP2: $0.2565
🎯 TP3: $0.290 – $0.300 (triangle measured move, approx. $0.06)
🎯 Extended target: $0.3270 (major resistance zone)
3. Ideal confirmation: successful retest of the breakout zone ($0.230–$0.235).
4. Bullish invalidation: price closes back inside the triangle after a breakout.
---
🐻 Bearish Scenario (Downside Breakdown Risk)
1. A daily close below $0.216–$0.218 would signal bearish momentum.
2. Downside targets if breakdown occurs:
⚠️ Support 1: $0.210
⚠️ Support 2: $0.190
⚠️ Support 3: $0.170
⚠️ Extreme case: retest of $0.0931 low
3. Bearish invalidation: quick rebound back above $0.224–$0.226 after breakdown.
---
📌 Key Notes
The triangle is getting tighter, meaning a major breakout is imminent.
Direction depends heavily on volume confirmation.
Traders should wait for a daily close outside the triangle before entering.
Always apply risk management since false breakouts are common in this pattern.
---
✨ Conclusion
KERNEL/USDT is at a critical point inside a symmetrical triangle. A breakout above $0.236 could open the path to $0.2565 and potentially $0.3270. On the other hand, a breakdown below $0.217 may trigger further downside toward $0.190–$0.170.
👉 The market is at a decision point — watch closely for the next big move.
#KERNELUSDT #KERNEL #CryptoAnalysis #SymmetricalTriangle #Breakout #PriceAction #Altcoins #TechnicalAnalysis #DailyChart #SupportResistance #CryptoTA #DYOR
Kerneldao
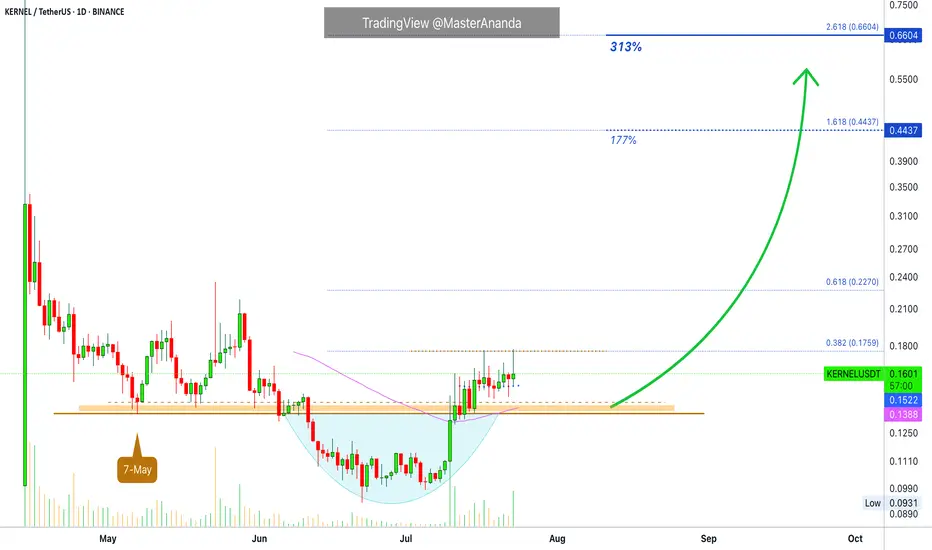
KernelDAO Short-Term Trade Setup · 300% Profits PotentialThis is another strong chart setup. I am looking at the short-term because that is the request I am getting from many of my followers. People are interested now in growing their capital so this can be used to accumulate strong reputable projects later on. Something like double-up, triple-up then grow some more. When enough cash is available; sit back, relax and hold.
The main low here is 7-May. The break below support is the liquidity-hunt event.
After the action recovers above support, bullish confirmed.
Notice KERNELUSDT trading above EMA55 and EMA89 daily.
Trading volume also favors the bullish side. Notice how red days have very low volume. On green days we have the higher numbers of volume spikes. High volume when buying, low volume when selling.
The first target is good and strong for 177%. The second target goes to 300%. This can be achieved easily within 1 month (short-term), or it can extend to two months but not much longer. The trick is to be ready to wait.
If you expect the market to move within hours or days, you might be disappointed. Yes, sometimes it moves fast but this is the exception and not the norm. Better to be prepared to wait a long time and if it moves faster, that's a bonus but we have to be realistic to produce consistent wins. If you want to be in the action, diversification is a good strategy. If you just want to win, patience is key.
Namaste.