KERNEL/USDT — at the of the Wedge: Breakout or Sideways?🔎 Overview
KERNEL/USDT is currently trading inside a descending wedge pattern — a narrowing channel that often signals a potential bullish breakout. Price is consolidating around 0.2186 USDT, just below the key resistance zone at 0.239 – 0.2565 USDT.
This is a make-or-break area:
A successful breakout above could trigger a strong upward move.
A rejection may push price back to lower wedge supports.
---
🟢 Bullish Scenario
1. A daily close above 0.239 – 0.2565 with strong volume would validate a bullish breakout.
2. If confirmed, upside targets are:
0.3270 USDT (major resistance / wedge target).
Potential extension towards 0.35 – 0.40 USDT if momentum accelerates.
3. Safer approach → wait for a breakout and retest above 0.2565.
4. Potential gains:
From 0.2186 to 0.3270 ≈ +49.6%.
Risk can be limited with a stop loss below 0.238 (around -7% from breakout entry).
---
🔴 Bearish Scenario
1. Failure to break above 0.239 – 0.2565 and a bearish rejection could invite selling pressure.
2. A daily close below 0.18 would confirm bearish continuation.
3. Downside targets:
0.17 USDT (wedge support).
0.0931 USDT (historical low, worst-case scenario).
4. Bearish risk increases if candles close consistently below 0.18 USDT.
---
📌 Pattern & Sentiment
Descending wedge: often leads to a bullish reversal but requires confirmation.
Declining volume: indicates market participants are waiting for a strong catalyst.
Broader crypto market sentiment will also play a major role in determining breakout direction.
---
⚖️ Conclusion
Bullish Key Zone: Breakout above 0.239–0.2565 → target 0.3270.
Bearish Key Zone: Breakdown below 0.18 → downside to 0.17 or even 0.0931.
Neutral Bias: Price remains in consolidation until a decisive breakout occurs.
The best trading approach is to wait for confirmation — either a bullish breakout or a bearish breakdown — before committing to a larger position. This is a clear decision zone for KERNEL.
---
#KERNEL #KERNELUSDT #CryptoAnalysis #AltcoinUpdate #ChartPattern #TechnicalAnalysis #CryptoSignals #WedgePattern #SupportResistance
Kernels

KERNEL/USDT – Symmetrical Triangle Nearing a Major Breakout?📝 Overview
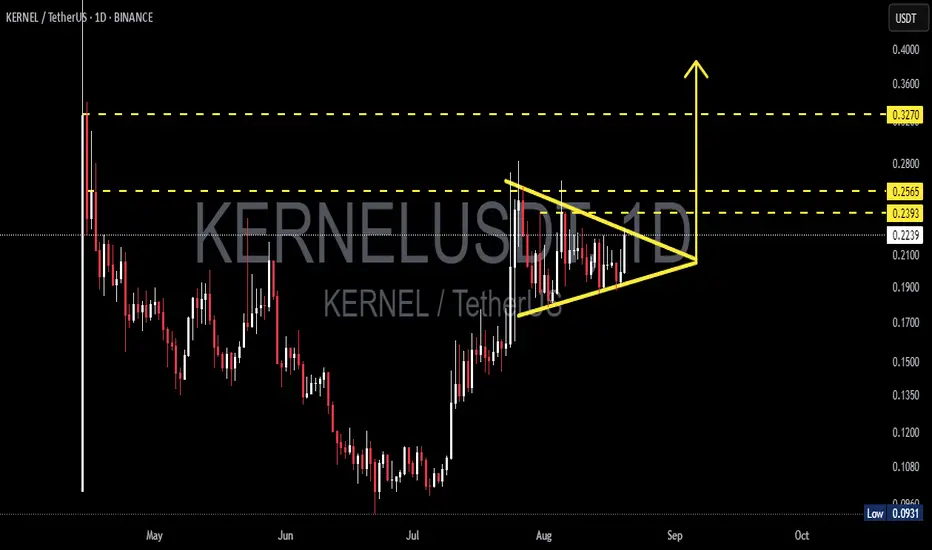
KERNEL price is currently trading around $0.2228, consolidating inside a symmetrical triangle on the daily timeframe. This pattern indicates a period of equilibrium between buyers and sellers, where volatility contracts before a decisive move. While symmetrical triangles often act as continuation patterns, they can also trigger reversals if confirmed by strong volume.
📐 Pattern & Chart Structure
After dropping to a low of $0.0931, KERNEL staged a strong rebound.
Since July–August, the price has been compressing into a series of higher lows and lower highs, forming a classic symmetrical triangle.
Key levels to watch:
🔹 Minor resistance: $0.2393
🔹 Key resistance: $0.2565
🔹 Major resistance: $0.3270
🔹 Dynamic support: $0.210 – $0.218 (triangle bottom)
🔹 Further supports: $0.190 – $0.170
---
🚀 Bullish Scenario (Upside Breakout Potential)
1. A break and daily close above $0.234–$0.236 would be the first confirmation of bullish continuation.
2. With strong volume, upside targets are:
🎯 TP1: $0.2393
🎯 TP2: $0.2565
🎯 TP3: $0.290 – $0.300 (triangle measured move, approx. $0.06)
🎯 Extended target: $0.3270 (major resistance zone)
3. Ideal confirmation: successful retest of the breakout zone ($0.230–$0.235).
4. Bullish invalidation: price closes back inside the triangle after a breakout.
---
🐻 Bearish Scenario (Downside Breakdown Risk)
1. A daily close below $0.216–$0.218 would signal bearish momentum.
2. Downside targets if breakdown occurs:
⚠️ Support 1: $0.210
⚠️ Support 2: $0.190
⚠️ Support 3: $0.170
⚠️ Extreme case: retest of $0.0931 low
3. Bearish invalidation: quick rebound back above $0.224–$0.226 after breakdown.
---
📌 Key Notes
The triangle is getting tighter, meaning a major breakout is imminent.
Direction depends heavily on volume confirmation.
Traders should wait for a daily close outside the triangle before entering.
Always apply risk management since false breakouts are common in this pattern.
---
✨ Conclusion
KERNEL/USDT is at a critical point inside a symmetrical triangle. A breakout above $0.236 could open the path to $0.2565 and potentially $0.3270. On the other hand, a breakdown below $0.217 may trigger further downside toward $0.190–$0.170.
👉 The market is at a decision point — watch closely for the next big move.
#KERNELUSDT #KERNEL #CryptoAnalysis #SymmetricalTriangle #Breakout #PriceAction #Altcoins #TechnicalAnalysis #DailyChart #SupportResistance #CryptoTA #DYOR