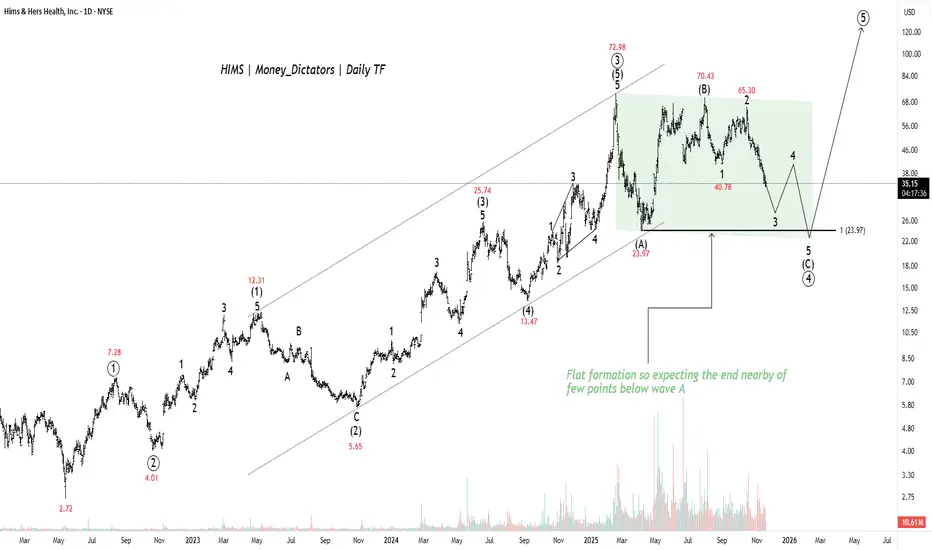
HIMS - Bulls Finding Demand to climb 120+ LevelsHIMS strongly suggests the stock is currently in the final phase of a large decline before initiating a major upward move. According to Elliott Wave principles, the stock is completing a correction labeled as wave (4), which has formed a "Flat" pattern.
The final downward leg of this pattern, wave (C), is projected to conclude around the prior wave (A) low of $23.97 , or potentially slightly below this level. Once the price reaches and holds support near the $24 area, the analysis anticipates the start of a new, highly significant bullish impulse wave (5), which is expected to drive the price to 57, 95, and 120+ levels.
Stay Tuned!
@Money_Dictators
Keshavr
CHFJPY Is Escaping from Bulls, but...CHFJPY is currently completing a corrective pattern, labeled as wave (4).The price is expected to retest and potentially find support around the 193.56 level, or the 1.618 Fibonacci extension near 193.486 .Once this correction is complete, the pair is projected to start the final impulse wave (5).The primary target for the final move (5) is 196.026 (T3).

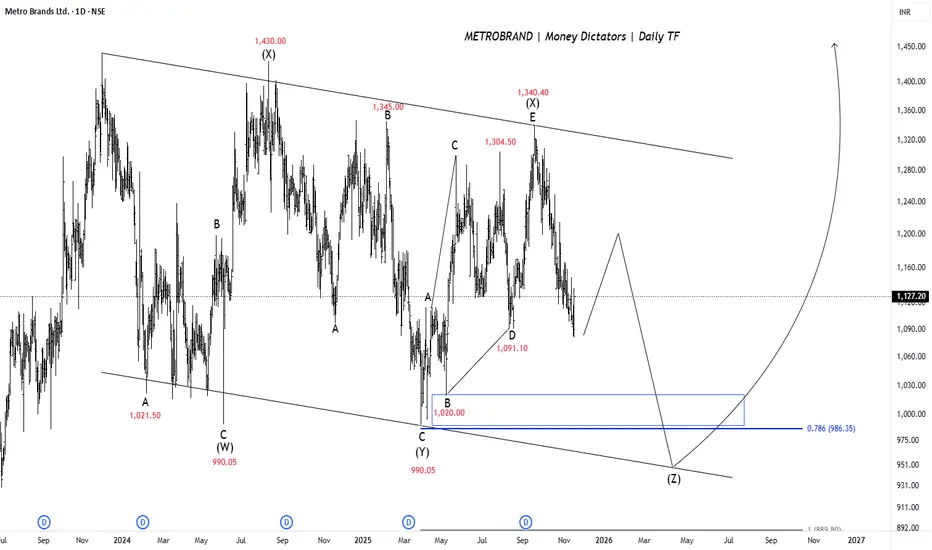
METROBRAND - An Important Case of Final Correction & ImpulseMetrobrand has been trading inside a broad downward-sloping channel for a long time, repeatedly getting rejected from the upper trendline. Each corrective structure appears as part of a complex W-X-Y-X-Z pattern, and currently, the price seems to be completing the final leg (Z). The earlier lows around 990 were tested twice, showing strong support, and now price is recovering from that zone. The recent rise indicates that sellers are losing strength and buyers are slowly stepping in again.
The ideal accumulation range lies between 1,020 and 986 (0.786 retracement), and as long as the stock holds above this zone, the downside risk remains limited. A minor dip or consolidation is still possible in the coming weeks before a stronger uptrend kicks in. Once the price stabilizes and confirms reversal with higher highs and higher lows, we may see momentum building toward the upper resistance.
If the stock sustains above 1,125 and later breaks out of the channel resistance, it has the potential to travel toward 1,245 initially. A successful breakout with volume can trigger a major upside move, extending toward 1,460 or even higher levels. Overall, the risk–reward now tilts in favor of long-term buyers, provided the stock respects the lower support zone near 986.
Stay Tuned!
@Money_Dictators
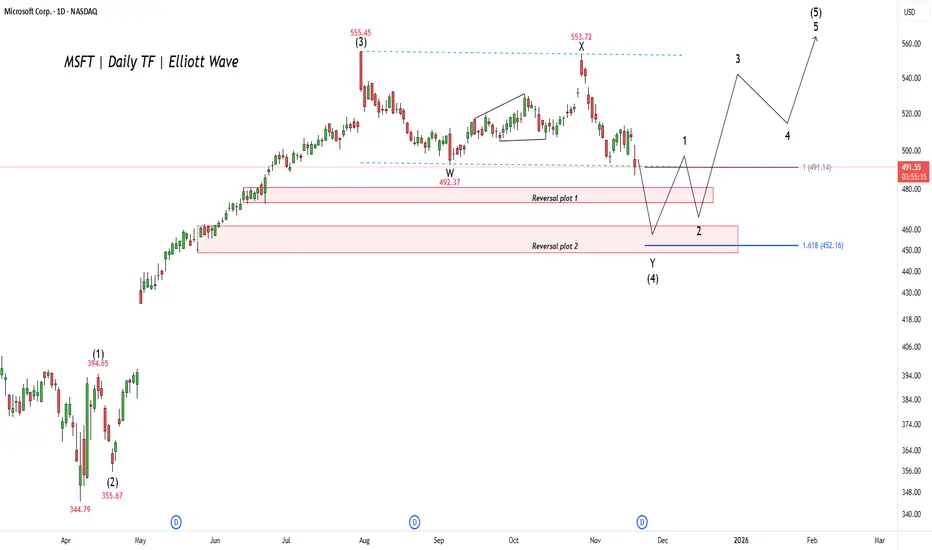
MSFT: Final Dip Before the Next LeapPrevious Idea:
Microsoft (MSFT) shows the stock is enduring a significant correction, which is the final pullback before a massive rally. This phase, labeled wave (4), is expected to find its bottom within a key support area. Traders are looking for this downswing to complete anywhere between the $452 and $492 zones. Hitting this target range would conclude the current multi-month drop and clear the path for the next major advance.
Once the correction successfully bottoms out in that crucial support range, the market expects a powerful final bullish surge, known as wave (5), to begin. This next wave is projected to drive the stock significantly higher, easily surpassing the previous all-time high of $555.45 . This bullish scenario will remain valid as long as the stock respects the identified support zone and begins its ascent from that area.