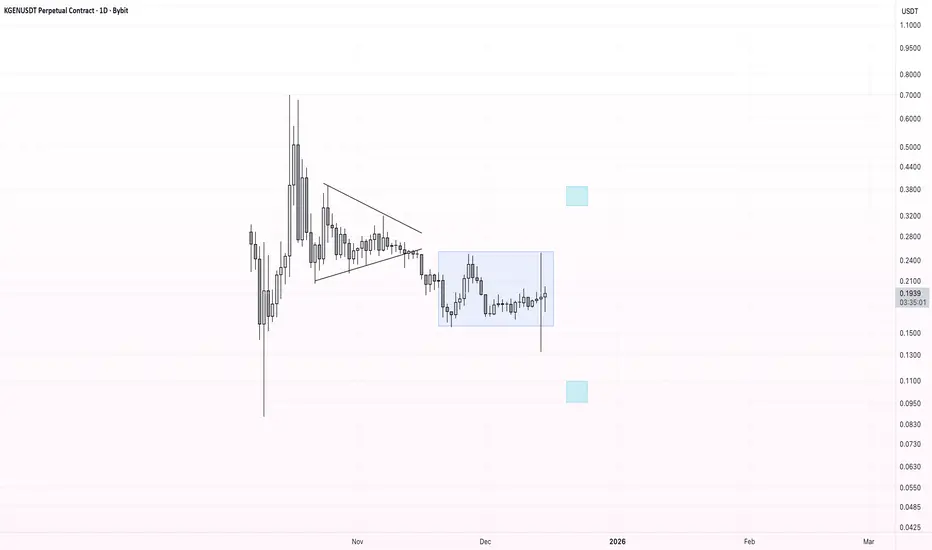
Classic Rectangle Formation — Breakout Defines DirectionPrice action is forming a classic rectangle (range), representing a consolidation phase after increased volatility. The market is compressing, building energy for the next impulsive move.
A key rule for this structure: the direction of the breakout defines the direction of the move.
Scenarios:
🔼 Bullish breakout:
– Break and acceptance above the upper range boundary
– Upside target: 🎯 $0.34
🔽 Bearish breakout:
– Break and acceptance below the lower range boundary
– Downside target: 🎯 $0.11
While price remains inside the rectangle, the market stays neutral. A confirmed breakout with volume is expected to trigger a strong directional move.
KGEN
KGEN Buy/Long Setup (2H)Given the liquidity sweep at the bottom, the shift to a bullish market structure, and the formation of three iBOS signals, we can look for buy/long positions in the support zones.
Note that within the entry area, we have two points of interest, which we have marked.
The targets are also indicated on the chart.
If the stop at 0.16915 is touched, this signal will be stopped out.
Do not enter the position without capital management and stop setting
Comment if you have any questions
thank you

KGEN - PERFECT SETUP. SET:KGEN - update:
perfect; Almost -30% down from resistance zone given! 🔥
If the 0.2550 - 0.2600$ support zone hold, then bull could push price higher. Volatility is huge, and price remain stuck under big levels. Not a safe bet to me.
#dyor #trading

KGEN - LEVEL BY LEVEL - UDPATE:SET:KGEN - update:
Big resistance hit ⚠️ - 0.3580 - 0.3600$.
Possible scenario i'm watching:
Pull back toward 0.2850 - 0.2900$; then leg up toward 0.420$+ 📈
Momentum might remain strong above trend + possible (curve line).
Remember:
70% up from previous call, so don't be greedy!✅💰
Level by level team! 🐸

KGEN - BULLISHAs mentionned, #KGEN bottom was in! +30%up from the yellow zone shared. ✅
Bullish correction still ongoing, I expect to see further bull move📈
Upper big resistances:
🎯0.2980
🎯0.3230
🎯0.3650
🎯0.420
🎯0.450
Big resistance: 0.280 - 0.2950$ if bulls break above, buy volume could increase quickly.
Big supports:
0.2650 *- 0.2520 - 0.2350 - 0.2240 - 0.2100


KGEN - BULL FLAG - HUGE MOVE INCOMING???I shilled SET:KGEN early on today, this one is traded among the top gainers pair today 💥
Judging by the price structure, it's likely just the begining!
Solid uptrend & constant buy pressure adding with a bullish pattern HTF! 📈
That's all you need before to see another explosif move!
ATH resistance: 0.70 - 0.720==> 50% higher.
Not a financial advice froggy team 🐸

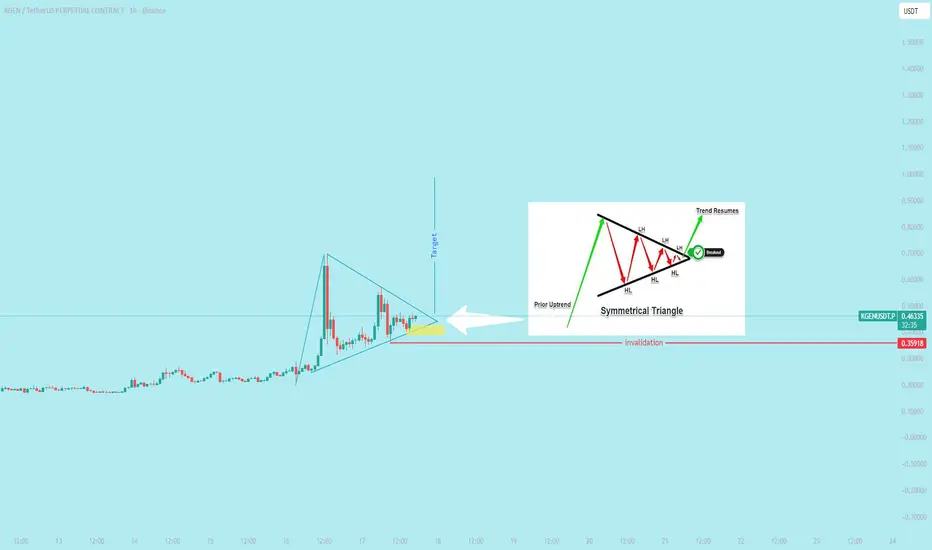
$KGEN Performing a symmetrical triangleA bullish symmetrical triangle is a continuation pattern that signals a potential resumption of an uptrend. The pattern forms during a period of market indecision, where the price consolidates between a descending upper trendline and an ascending lower trendline. A confirmed breakout above the upper trendline suggests that buyers have regained control and the upward momentum is likely to continue.
KGEN Analysis (1H)It is currently fluctuating within a range, and the range node has not yet been engulfed | it has rejected the price.
We labeled the range node as Supply, marked in red.
A liquidity pool is also shown on the chart, and unless the price stabilizes above this liquidity pool level, we expect a drop toward the TP line
Use low volume and leverage, as this is a new coin with high volatility
For risk management, please don't forget stop loss and capital management
When we reach the first target, save some profit and then change the stop to entry
Comment if you have any questions
Thank You
