KNC/BTCKyber Network strongly attacks resistance.
It is about the time when he will confirm his attack and will continue in the uptrend, given the overall situation in the cryptocurrencies.
Kncusd

Kyber Network At Attractive LevelsHello Crypto traders, today we will talk about Kyber Network cryptocurrency with ticker KNCUSD, where we see nice and clean bullish setup formation from Elliott wave perspective.
KNCUSD sold-off in the second part of 2022, but in three legs A-B-C only, which means that correction can be coming to an end if we consider an impulsive five-wave rally from the lows since 2019 till 2022. Ideal support we see here around 0.60 – 0.40 area and from where we should be aware of a bullish continuation in 2023. First bullish evidence would be above trendline connected from the highs and above 1.0 level, while bullish confirmation is only above 2.0 region.
Keep also in mind that we remain bullish as long as the price is above 0.11 invalidation level.
Happy trading and investing!
If you like what we do, then please like and share our idea!
Disclosure: Please be informed that information we provide is NOT a trading recommendation or investment advice. All of our work is for educational purposes only.

KNC CAN DROP MOREI hope you are fine
It fluctuated in a neutral range. By counting the waves, I think we are in wave d of a falling triangle. For wave d, I expect to move further down and look for short positions inside the red box

The ALT trader: Kyber Bullish#CryptoWhale100Billion Alt Coin Analysis: KNC
My Analysis shows that KNC can increase to around will come back to .75 and return to resistance in the next few weeks. KNC showing slow sales after the meltdown. Buyers are holding the .50-60cent. Possible of another down before running to .75 and back to resistant .95cent.
RSI showing a good bullish move. Strong buy after breaking down the target point at .50cent. Small sales showing on the MACD. I'm more bullish for KNC going back .95cent
Shoot me a message with your Technical Analysis to see your thoughts and trading strategies.
#CryptoWhale100Billion
Press The Thumbs Up and shoot me a message below what your idea on KNC will hit.
Thank You for the support!
Below are some Previous charts links I've written in the pass for Reference.

Buy when the candle breaks the trendlineI personally like kyber that is why I'm closely watching this pair. Please trade with caution. Not a financial advice.

KNC Divergence by ADZ indicatorBINANCE:KNCPERP
KNC can see one more capitulation but we have a good news
✅Before we start to discuss, I would be glad if you share your opinion on this post's comment section and hit the like button if you enjoyed it.
Thank you.
Possible Targets and explanation idea
➡️Global FIB. Came to investments area -0.18 Level.
➡️Now we can test on weekend 0.54 D1 timeframe global downtrend line
➡️Target for middle term correction for next bull run if you are investor 0.618 marked
➡️Capitulation on Black Swan 0.16 cents (more than possible for KNC
➡️We need volume for continuation. We trade under fundamental price
➡️Good sign by ADZ indicator big players accumulate KNC and price going lower. We can see one more dump for confirmation
Hope you enjoyed the content I created, You can support with your likes and comments this idea so more people can watch!
✅Disclaimer: Please be aware of the risks involved in trading. This idea was made for educational purposes only not for financial Investment Purposes.
* Look at my ideas about interesting altcoins in the related section down below ↓
* For more ideas please hit "Like" and "Follow"!

Trading opportunity for KNCUSDTBased on technical factors there is a Long position in :
📊 KNCUSDT
🔵 Long Now 0.941
🧯 Stop loss 0.840
🏹 Target 1 1.020
🏹 Target 2 1.130
🏹 Target 3 1.420
💸RISK : 1%
We hope it is profitable for you ❤️
Please support our activity with your likes👍 and comments📝

KNC Check the Key LevelsPlease check my analysis, you can comment if you have ideas too. More profits to all of us.

KNC - Oversold and daily divergenceIf you have seen how Klay is working. I continue to look for 1 potential altcoin in this bull run to share with everyone.
And in the day frame, I saw KNC.
The coin is currently oversold on the daily chart.
At the same time, its price line is breaking the price triangle and the price is above the support line of the weekly frame.
So technically this is clearly a potential next coin to invest in.
I expect 2 levels of RR: 4.88 and 11.18.
Hope this analysis will help you.
Buy in good price zone and always put SL.

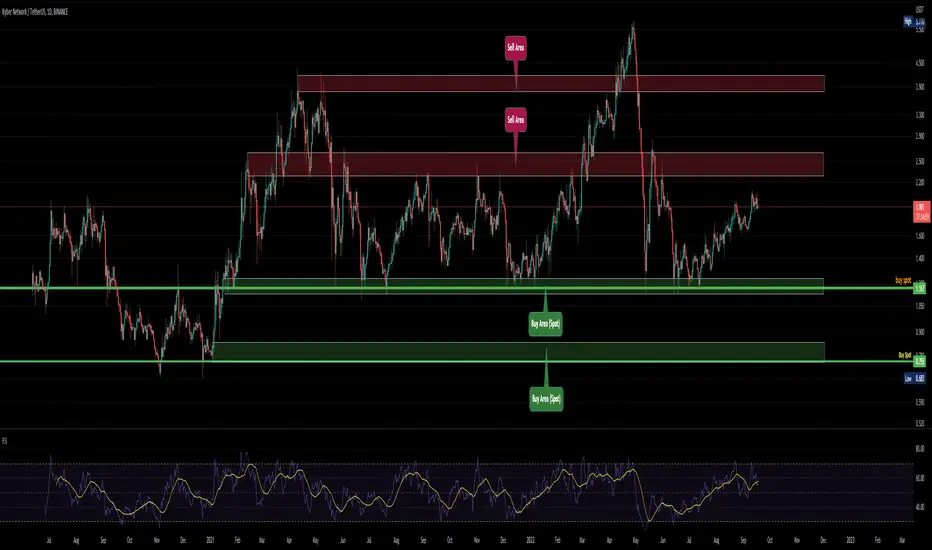
KNC Full Support and Resistance in Daily and weeklyhi everyone,
as you can see knc has supported from our support areas again and again,
the scenario is simple you can buy in support and sell in resistance,
just draw your chart like I drew and simply buy and sell in areas.

Kyber Network Crystal v2 KNC bearish sentimentSeptember has major catalysts for the crypto market as well as for the stock market.
The Ethereum merge on September 6th, that will end on Sept 20, the inflation report on September 13 and the next FOMC meeting afterwards with the new interest rates hike.
That is reflected in the crypto space in general as a bearish outlook.
Kyber Network Crystal v2 KNC has a negative overall sentiment recently.
I have the following price targets:
KNC/USDT short
Entry Range: $1.63 - 1.99
Price Target 1: $1.45
Price Target 2: $1.30
Price Target 3: $1.17
Stop Loss: $2.21

KNC -KNCUSDT-Scalping 🎧 #KNC - Scalping Excellent short selling area - #KNCUSDT - quick trade - Gartley Pattern

$KNC 4H CHART Head & Shoulders patternBINANCEUS:KNCUSD Price seems to have formed a Head and Shoulder pattern on the 4H chart. The price target of the H&S pattern is shown on the red rectangle. A close above $1.50 will invalidate the pattern.

KNC long ideaHeres a nice KNC long idea, obviously mindful of whatever bitcoin decides to do.
Stops just below the ichimoku cloud.
Three targets sit overhead.

KNC long ideaHeres a nice KNC long idea, obviously mindful of whatever bitcoin decides to do.
Stops just below the ichimoku cloud.
Three targets sit overhead.

KNC long optionsHeres some options for longs on KNC.
There uptrend that we have seen here in the diagonal, is getting some pressure and may soon break down. As result would be looking for good areas to take longs.
The 0.618 line here looks very good, but i accept that price action could well carry on down towards the bottom of the range. Will have to see how prices respond to these levels.

Trading signal for KNCUSDKNC is facing resistance by a cluster of trendlines and on a breakout, I expect price to reach the black zone.

KNC LONG IDEAKNC had a nice rally after breaking through its overhead macro resistance (diagonal).
We have see it rally into resistance (horizontal) and now id expect its to cool off a bit.
Clear price action support/resistance flip down below could serve as a nice point to buy and go long, with stops just below. Id expect some consolidation below this overhead resistance before finally breaking through. Taking the long lower down means we reduce our risk and also, have the opportunity to take profit if the price makes it back to resistance.
(as an alternative option, you could wait for the break of this resistance and then long the retest)
(will also post the chart of KNC/BTC down below; is always a good idea to see if the bcc pairing is as equally bullish).

Kyber Network (KNC) formed bullish Gartley for upto 132% moveHi dear friends, hope you are well and welcome to the new trade setup of Kyber Network (KNC).
Previously we had a nice trade of KNC:
Now on a daily time frame, KNC has formed a big bullish Gartley pattern.
Note: Above idea is for educational purpose only. It is advised to diversify and strictly follow the stop loss, and don't get stuck with trade

KNC long (patience possibly)This one might need some patience as bitcoin is looking wobbly. But there is a clear opportunity here for a breakout.

KNCUSD ❕ upper boundary of the channelThe KNC chart is similar to most charts right now, but with the exception that it has formed a Head and Shoulders pattern and reached the upper boundary of the downtrend channel.
Price is now testing the 100MA on the 1H Timeframe.
With the correction, trading volumes have decreased.
The Fed meeting is expected today and the rate may be increased by more than 0.5%.
I expect that the price may retest the upper boundary of the descending channel before it continues falling, but after fixing under it, it will continue to fall.

Kyber NetworkKNC/USDT and this coin is now on triangle Pattern and im taking LONG position into my TP 1 after we take TP 1 you move SL to entry
