KNC/USDT — Multi-Year Decision Zone: Accumulation or Breakdown?🔎 Overview
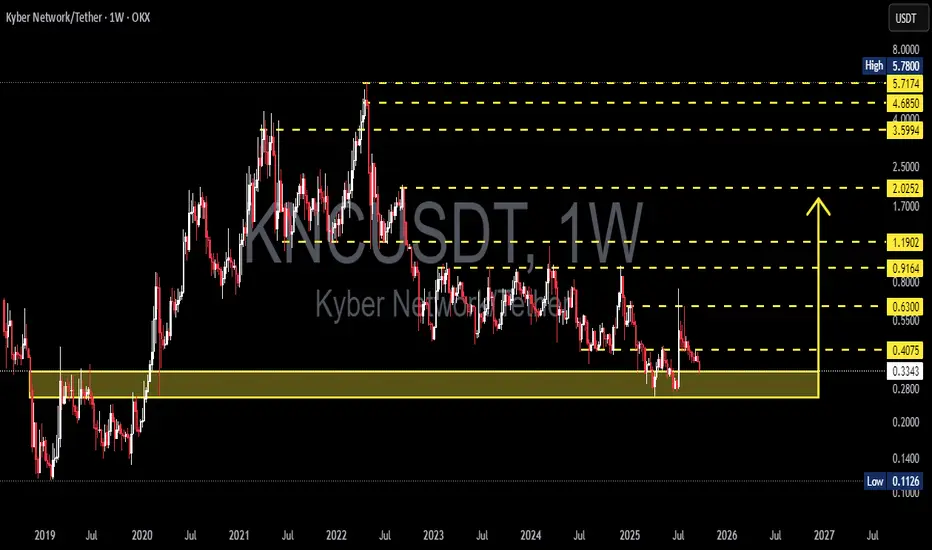
Kyber Network (KNC) is standing at one of its most critical levels since 2019. After peaking in 2021, the price has consistently formed lower highs and is now retesting the legendary support zone at 0.28–0.34 USD.
This area isn’t just a random floor — it’s a multi-year accumulation base that has shaped KNC’s price cycle for over 5 years. As price enters this zone again, the market faces a decisive moment:
➡️ Will this be the start of a major rebound?
➡️ Or the beginning of a deeper breakdown into new lows?
---
🟢 Bullish Scenario (Reversal Potential)
1. Key trigger: A weekly close above 0.41 USD signals the first breakout.
2. Upside targets:
Target 1: 0.63 USD (classic resistance)
Target 2: 0.92 – 1.19 USD (major supply zone)
Target 3: 2.02 USD (long-term validation of reversal)
Extended bull cycle: 3.6 – 5.7 USD (historical highs)
3. Bullish confirmations: Rising volume, strong-bodied weekly candles, and successful retests of breakout levels.
📌 Translation: If the broader crypto market enters a new bull run, KNC could multiply several times from current levels.
---
🔴 Bearish Scenario (Historical Breakdown)
1. Key trigger: A weekly close below 0.28 USD validates the breakdown.
2. Implications: Failure of the multi-year accumulation base.
3. Downside targets:
Support zone: 0.20 – 0.14 USD
Historical low: 0.1126 USD
4. Consequences: A breakdown here could trigger panic selling and push KNC into downside price discovery.
📌 In short, if this support fails, KNC risks losing its long-term technical foundation.
---
📐 Structure & Pattern
Primary trend: Bearish since 2021 (consistent lower highs).
Current pattern: Range accumulation between 0.28–0.34 USD, with potential double/triple bottom formation.
Momentum: Price compression near major support → often precedes a strong breakout or breakdown.
---
🎯 Conclusion & Strategy
Long-term investors: The 0.28–0.34 USD zone could be a golden accumulation opportunity if it holds.
Conservative traders: Wait for a weekly close > 0.41 USD before entering to avoid false bounces.
Aggressive traders: Scale into longs near support with tight stops below 0.28 USD.
Risk management: Keep exposure low, risk max 1–3% per trade.
💡 Right now, KNC stands at a multi-year crossroads. Holding this base could trigger a trend reversal, while losing it could reopen the path to historical lows.
---
#KNCUSDT #KyberNetwork #CryptoAnalysis #Altcoin #SupportResistance
KNCUSDC
KNCUSDT — Critical Zone: Major Accumulation or Start of Breakdow🔎 Key Analysis
KNC is currently trading around 0.4034 USDT, sitting right inside the 0.32–0.40 demand zone (yellow box), a level that has acted as a key support-resistance flip for months. This area is crucial because:
1. It has previously served as the launchpad for strong rallies.
2. It has been tested multiple times, confirming its importance to both bulls and bears.
3. Each visit to this zone has triggered major reactions.
Above, we can see several resistance levels that may serve as bullish targets. Below, the chart leaves room for a retest of the major low. This puts price action in a “make or break” decision point.
---
📈 Bullish Scenario
Confirmation: Price must hold above 0.40 and close decisively above 0.4945 (2D timeframe).
Momentum: A strong breakout with volume could push KNC toward 0.5733 and 0.6393.
Extended Target: A larger move could revisit 0.79 – 0.93, the broader distribution zone.
Opportunity: From current levels, the upside potential (+58% to R3) outweighs the risk if breakout confirms.
---
📉 Bearish Scenario
Confirmation: Price fails to hold 0.32–0.40 and closes below the yellow zone.
Implication: This would flip demand into supply, opening the door for deeper sell-offs.
Target: First target near 0.30, then a retest of the 0.2577 major low.
Risk: Breakdown toward 0.2577 represents a ~36% downside from current levels.
---
📊 Current Structure
1. Extended Range: Multi-month sideways price action suggests accumulation or distribution.
2. Liquidity Sweeps: Long wicks show repeated stop-hunting and liquidity grabs.
3. Accumulation/Distribution Zone: The 0.32–0.40 area is the current battle zone.
4. Lower Highs Dominance: On higher timeframe, the trend still favors bears until a clear structure shift (higher high + higher low) occurs.
---
🎯 Conclusion
KNC is at a critical inflection point.
A breakout above 0.4945 could trigger bullish continuation toward 0.57 – 0.64.
A breakdown below 0.40 risks a return to 0.2577.
Best strategy: Wait for breakout or breakdown confirmation. Current levels may attract accumulation, but risk management is crucial as volatility could expand in either direction.
---
#KNC #KNCUSDT #KyberNetwork #CryptoAnalysis #Altcoin #TechnicalAnalysis #Breakout #SupportResistance #CryptoMarket

KNC Check the Key LevelsPlease check my analysis, you can comment if you have ideas too. More profits to all of us.

KNC LONG IF CANDLE CLOSED OUTSIDE TRIANGLETake a look of this pattern. If the candle breaks the triangle and closes outside the triangle then we will have an upward trend until to its resistance. Share your thoughts in the comments.
