KNC/USDT — Multi-Year Decision Zone: Accumulation or Breakdown?🔎 Overview
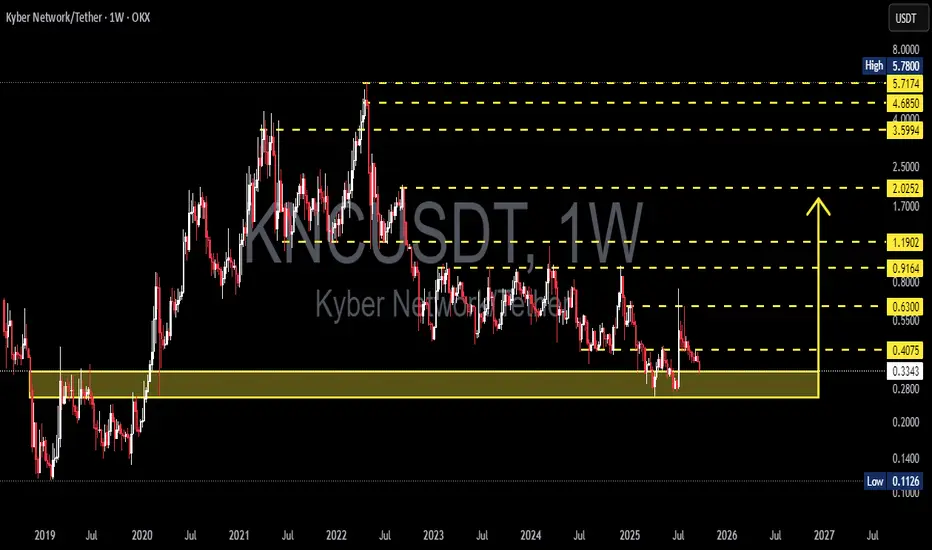
Kyber Network (KNC) is standing at one of its most critical levels since 2019. After peaking in 2021, the price has consistently formed lower highs and is now retesting the legendary support zone at 0.28–0.34 USD.
This area isn’t just a random floor — it’s a multi-year accumulation base that has shaped KNC’s price cycle for over 5 years. As price enters this zone again, the market faces a decisive moment:
➡️ Will this be the start of a major rebound?
➡️ Or the beginning of a deeper breakdown into new lows?
---
🟢 Bullish Scenario (Reversal Potential)
1. Key trigger: A weekly close above 0.41 USD signals the first breakout.
2. Upside targets:
Target 1: 0.63 USD (classic resistance)
Target 2: 0.92 – 1.19 USD (major supply zone)
Target 3: 2.02 USD (long-term validation of reversal)
Extended bull cycle: 3.6 – 5.7 USD (historical highs)
3. Bullish confirmations: Rising volume, strong-bodied weekly candles, and successful retests of breakout levels.
📌 Translation: If the broader crypto market enters a new bull run, KNC could multiply several times from current levels.
---
🔴 Bearish Scenario (Historical Breakdown)
1. Key trigger: A weekly close below 0.28 USD validates the breakdown.
2. Implications: Failure of the multi-year accumulation base.
3. Downside targets:
Support zone: 0.20 – 0.14 USD
Historical low: 0.1126 USD
4. Consequences: A breakdown here could trigger panic selling and push KNC into downside price discovery.
📌 In short, if this support fails, KNC risks losing its long-term technical foundation.
---
📐 Structure & Pattern
Primary trend: Bearish since 2021 (consistent lower highs).
Current pattern: Range accumulation between 0.28–0.34 USD, with potential double/triple bottom formation.
Momentum: Price compression near major support → often precedes a strong breakout or breakdown.
---
🎯 Conclusion & Strategy
Long-term investors: The 0.28–0.34 USD zone could be a golden accumulation opportunity if it holds.
Conservative traders: Wait for a weekly close > 0.41 USD before entering to avoid false bounces.
Aggressive traders: Scale into longs near support with tight stops below 0.28 USD.
Risk management: Keep exposure low, risk max 1–3% per trade.
💡 Right now, KNC stands at a multi-year crossroads. Holding this base could trigger a trend reversal, while losing it could reopen the path to historical lows.
---
#KNCUSDT #KyberNetwork #CryptoAnalysis #Altcoin #SupportResistance
Kncusdtidea
KNCUSDT — Critical Zone: Major Accumulation or Start of Breakdow🔎 Key Analysis
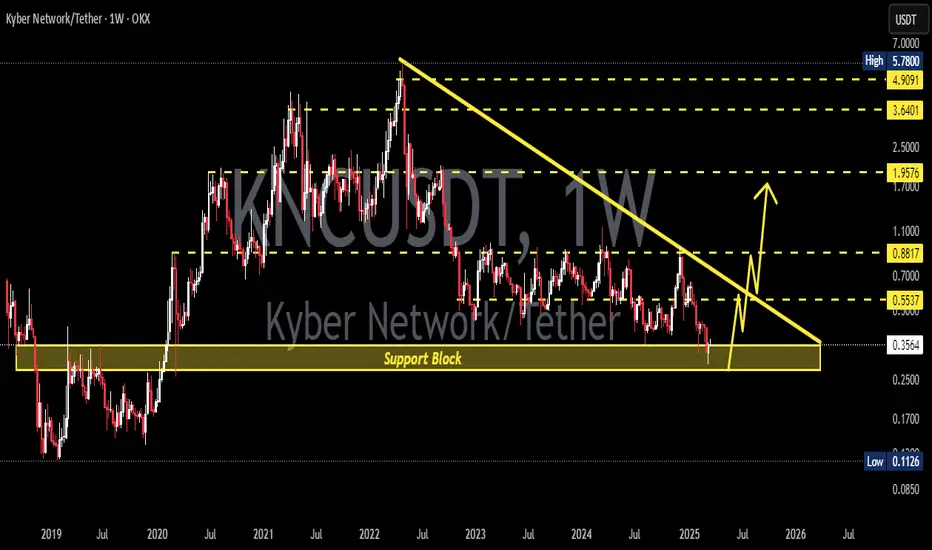
KNC is currently trading around 0.4034 USDT, sitting right inside the 0.32–0.40 demand zone (yellow box), a level that has acted as a key support-resistance flip for months. This area is crucial because:
1. It has previously served as the launchpad for strong rallies.
2. It has been tested multiple times, confirming its importance to both bulls and bears.
3. Each visit to this zone has triggered major reactions.
Above, we can see several resistance levels that may serve as bullish targets. Below, the chart leaves room for a retest of the major low. This puts price action in a “make or break” decision point.
---
📈 Bullish Scenario
Confirmation: Price must hold above 0.40 and close decisively above 0.4945 (2D timeframe).
Momentum: A strong breakout with volume could push KNC toward 0.5733 and 0.6393.
Extended Target: A larger move could revisit 0.79 – 0.93, the broader distribution zone.
Opportunity: From current levels, the upside potential (+58% to R3) outweighs the risk if breakout confirms.
---
📉 Bearish Scenario
Confirmation: Price fails to hold 0.32–0.40 and closes below the yellow zone.
Implication: This would flip demand into supply, opening the door for deeper sell-offs.
Target: First target near 0.30, then a retest of the 0.2577 major low.
Risk: Breakdown toward 0.2577 represents a ~36% downside from current levels.
---
📊 Current Structure
1. Extended Range: Multi-month sideways price action suggests accumulation or distribution.
2. Liquidity Sweeps: Long wicks show repeated stop-hunting and liquidity grabs.
3. Accumulation/Distribution Zone: The 0.32–0.40 area is the current battle zone.
4. Lower Highs Dominance: On higher timeframe, the trend still favors bears until a clear structure shift (higher high + higher low) occurs.
---
🎯 Conclusion
KNC is at a critical inflection point.
A breakout above 0.4945 could trigger bullish continuation toward 0.57 – 0.64.
A breakdown below 0.40 risks a return to 0.2577.
Best strategy: Wait for breakout or breakdown confirmation. Current levels may attract accumulation, but risk management is crucial as volatility could expand in either direction.
---
#KNC #KNCUSDT #KyberNetwork #CryptoAnalysis #Altcoin #TechnicalAnalysis #Breakout #SupportResistance #CryptoMarket

KNCUSDT 1W Analysis KNC ~ 1W Analysis
#KNC This trade is very high risk
Buy if you still have confidence in this coin with a short term target of at least 20%+ from here.

KNCUSDT 1WKNC ~ 1W Analysis
#KNC High risk trading. Buy gradually from here with a short -term target of at least 20%+.
KNC/USDT Break out the key level area, Indicating Bullish Moment💎 KNC has indeed made a significant impact in the cryptocurrency market. Currently, KNC has successfully broken out of the key supply zone area.
💎 The potential next step for the price is a retesting phase at the demand level. This breakout is indicative of bullish momentum, suggesting a continuation of the upward movement. There's a probability that KNC will reach our target area.
💎 However, if KNC fails to maintain its position above the demand area and instead breaks down below it, this would indicate a failed breakout scenario.
💎 Such a development could be a negative sign, suggesting a reversal to the downward movement. In this case, the price may revisit the key support area.

KNCUSD 1WKNC ~ 1W 📈
#KNC Make purchases gradually from here. We estimate that this resistance will be broken in the near future. minimum target 20%++

KNC/USDT It required Breakout the pattern if want continue UP!💎 The recent market performance of KNC has been garnering attention. KNC has successfully reclaimed its position above a critical support area, creating a bearish trap.
💎 Currently, it is navigating an upward trajectory toward the resistance trendline of a descending channel. For sustained upward momentum, KNC needs to effectively break out of this pattern. A successful breakout from the descending channel could propel KNC significantly upward, potentially leading it to our established strong resistance area.
💎 However, if KNC struggles and fails to break out of this pattern, there's a possibility it may revert to the support area to gather strength for another breakout attempt. In such a scenario, KNC must demonstrate a strong rebound from the support area, maintaining the bullish momentum needed for a successful pattern breakout.
💎 Should KNC exhibit a lackluster response at the support level, characterized by sideway movements and low trading volume, it could indicate a loss of support. Under such circumstances, the probability increases that KNC may descend further, potentially moving toward lower price levels.

Long trade setup for KNCUSDTFor the BINANCE:KNCUSDT.P Long Trade Setup, the following values are suitable for our interval trade:
Entry: 0.7427
Target: 0.8082
Stop: 0.6948
Cost Reduction: 0.7213
The profit is reasonable relative to the risk.
*This is not investment advice; you can lose money. Crypto AI Signals is not responsible for any trades. 🚫💰

Long trade setup for KNCUSDTFor the BINANCE:KNCUSDT.P Long Trade Setup, the following values are suitable for our interval trade:
Entry: 0.7213
Target: 0.7696
Stop: 0.6955
Cost Reduction: -
The profit is reasonable relative to the risk.
*This is not investment advice; you can lose money. Crypto AI Signals is not responsible for any trades. 🚫💰

KNCUSDTBINANCE:KNCUSDT long idea
⛔"Daily crypto market analyses I provide are personal opinions & not financial advice. Trading carries risks, so do your own research & seek advisor's help.#DYOR"
Don't forget to like and comment

🟢 KNCUSDT - 1D (30.09.2022)🟢 KNCUSDT
TF: 1D
Side: Long
SL: $1.0889
TP 1: $1.3249
TP 2: $1.4710
TP 3: $1.5890
MACD and RSI look ready.

KNC -KNCUSDT-Scalping 🎧 #KNC - Scalping Excellent short selling area - #KNCUSDT - quick trade - Gartley Pattern

#KNC/USDT UPADTE Hi guys, This is CryptoMojo, One of the most active trading view authors and fastest-growing communities.
Do consider following me for the latest updates and Long /Short calls on almost every exchange.
I post short mid and long-term trade setups too.
Let’s get to the chart!
I have tried my best to bring the best possible outcome in this chart, Do not consider it as financial advice.
Welcome to this JASMT/USDT TRADE setup. JASMY looks promising here.
KNC TRADE SETUP
Entry range:- CMP AN ADD MORE UP TO $2.470
Target:- 40%
SL:- CLOSE IF AN HOURLY CANDLE CLOSES BELOW THIA LOWER SUPPORT LEVE
You can buy it on spot or use low leverage (2x-4x)
This chart is likely to help you make better trade decisions if it does consider upvoting it.
I would also love to know your charts and views in the comment section.
Thank you

KNCUSDTtried to break ATH, but failed, need good retracement to the nearest structure before Making New ATH.
Cheers. Good luck

KNCUSDT AnalysisHello friends.
Please support my work by clicking the LIKE button(If you liked).Thank you!
Everything on the chart.
open pos: market and lower
target: 2 - 2.4 - 3
after first target reached move ur stop to breakeven
stop: under 1.3 (depending of ur risk). ALWAYS follow ur RM .
risk/reward 1 to 3
risk is justified
Good luck everyone!
Follow me on TRADINGView, if you don't want to miss my next analysis or signals.
It's not financial advice.
Dont Forget, always make your own research before to trade my ideas!
Open to your questions or suggestions.

KNCUSDT AnalysisHello friends.
Please support my work by clicking the LIKE button(If you liked).Thank you!
Everything on the chart.
open pos: market and lower
target: 1.95 - 2.2 - 2.6
after first target reached move ur stop to breakeven
stop: ~1.4 (depending of ur risk). ALWAYS follow ur RM .
risk/reward 1 to 4
risk is justified
Good luck everyone!
Follow me on TRADINGView, if you don't want to miss my next analysis or signals.
It's not financial advice.
Dont Forget, always make your own research before to trade my ideas!
Will be very APPRECIATE FOR UR DONAT/coins :)
Open to your questions or suggestions(Looking for investors!).
