KNC/USDT — Multi-Year Decision Zone: Accumulation or Breakdown?🔎 Overview
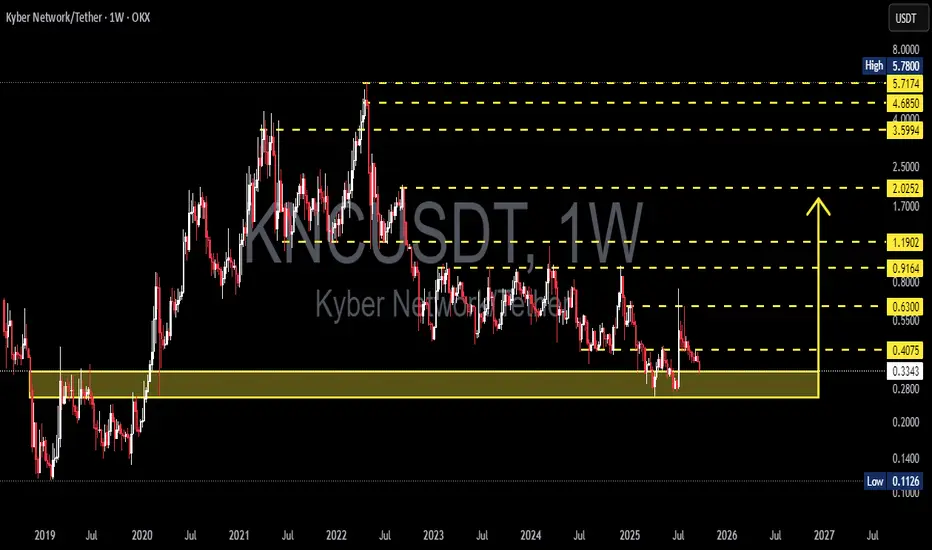
Kyber Network (KNC) is standing at one of its most critical levels since 2019. After peaking in 2021, the price has consistently formed lower highs and is now retesting the legendary support zone at 0.28–0.34 USD.
This area isn’t just a random floor — it’s a multi-year accumulation base that has shaped KNC’s price cycle for over 5 years. As price enters this zone again, the market faces a decisive moment:
➡️ Will this be the start of a major rebound?
➡️ Or the beginning of a deeper breakdown into new lows?
---
🟢 Bullish Scenario (Reversal Potential)
1. Key trigger: A weekly close above 0.41 USD signals the first breakout.
2. Upside targets:
Target 1: 0.63 USD (classic resistance)
Target 2: 0.92 – 1.19 USD (major supply zone)
Target 3: 2.02 USD (long-term validation of reversal)
Extended bull cycle: 3.6 – 5.7 USD (historical highs)
3. Bullish confirmations: Rising volume, strong-bodied weekly candles, and successful retests of breakout levels.
📌 Translation: If the broader crypto market enters a new bull run, KNC could multiply several times from current levels.
---
🔴 Bearish Scenario (Historical Breakdown)
1. Key trigger: A weekly close below 0.28 USD validates the breakdown.
2. Implications: Failure of the multi-year accumulation base.
3. Downside targets:
Support zone: 0.20 – 0.14 USD
Historical low: 0.1126 USD
4. Consequences: A breakdown here could trigger panic selling and push KNC into downside price discovery.
📌 In short, if this support fails, KNC risks losing its long-term technical foundation.
---
📐 Structure & Pattern
Primary trend: Bearish since 2021 (consistent lower highs).
Current pattern: Range accumulation between 0.28–0.34 USD, with potential double/triple bottom formation.
Momentum: Price compression near major support → often precedes a strong breakout or breakdown.
---
🎯 Conclusion & Strategy
Long-term investors: The 0.28–0.34 USD zone could be a golden accumulation opportunity if it holds.
Conservative traders: Wait for a weekly close > 0.41 USD before entering to avoid false bounces.
Aggressive traders: Scale into longs near support with tight stops below 0.28 USD.
Risk management: Keep exposure low, risk max 1–3% per trade.
💡 Right now, KNC stands at a multi-year crossroads. Holding this base could trigger a trend reversal, while losing it could reopen the path to historical lows.
---
#KNCUSDT #KyberNetwork #CryptoAnalysis #Altcoin #SupportResistance
Kncusdtlong
KNCUSDT — Critical Zone: Major Accumulation or Start of Breakdow🔎 Key Analysis
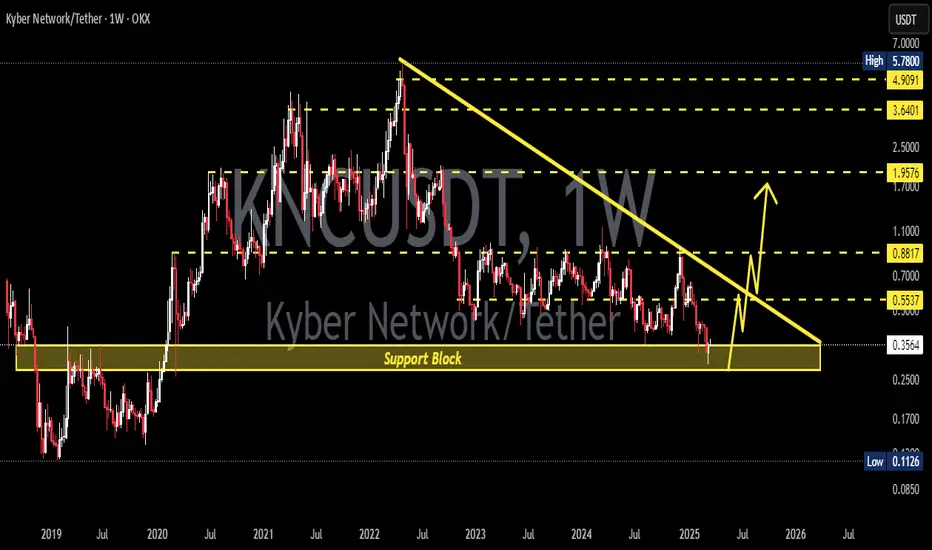
KNC is currently trading around 0.4034 USDT, sitting right inside the 0.32–0.40 demand zone (yellow box), a level that has acted as a key support-resistance flip for months. This area is crucial because:
1. It has previously served as the launchpad for strong rallies.
2. It has been tested multiple times, confirming its importance to both bulls and bears.
3. Each visit to this zone has triggered major reactions.
Above, we can see several resistance levels that may serve as bullish targets. Below, the chart leaves room for a retest of the major low. This puts price action in a “make or break” decision point.
---
📈 Bullish Scenario
Confirmation: Price must hold above 0.40 and close decisively above 0.4945 (2D timeframe).
Momentum: A strong breakout with volume could push KNC toward 0.5733 and 0.6393.
Extended Target: A larger move could revisit 0.79 – 0.93, the broader distribution zone.
Opportunity: From current levels, the upside potential (+58% to R3) outweighs the risk if breakout confirms.
---
📉 Bearish Scenario
Confirmation: Price fails to hold 0.32–0.40 and closes below the yellow zone.
Implication: This would flip demand into supply, opening the door for deeper sell-offs.
Target: First target near 0.30, then a retest of the 0.2577 major low.
Risk: Breakdown toward 0.2577 represents a ~36% downside from current levels.
---
📊 Current Structure
1. Extended Range: Multi-month sideways price action suggests accumulation or distribution.
2. Liquidity Sweeps: Long wicks show repeated stop-hunting and liquidity grabs.
3. Accumulation/Distribution Zone: The 0.32–0.40 area is the current battle zone.
4. Lower Highs Dominance: On higher timeframe, the trend still favors bears until a clear structure shift (higher high + higher low) occurs.
---
🎯 Conclusion
KNC is at a critical inflection point.
A breakout above 0.4945 could trigger bullish continuation toward 0.57 – 0.64.
A breakdown below 0.40 risks a return to 0.2577.
Best strategy: Wait for breakout or breakdown confirmation. Current levels may attract accumulation, but risk management is crucial as volatility could expand in either direction.
---
#KNC #KNCUSDT #KyberNetwork #CryptoAnalysis #Altcoin #TechnicalAnalysis #Breakout #SupportResistance #CryptoMarket

KNCUSDT 1W Analysis KNC ~ 1W Analysis
#KNC This trade is very high risk
Buy if you still have confidence in this coin with a short term target of at least 20%+ from here.

KNCUSDT 1WKNC ~ 1W Analysis
#KNC High risk trading. Buy gradually from here with a short -term target of at least 20%+.
Blue Box Demand Zone Ready for Precision Entries!KNCUSDT: Unlocking the Potential – Blue Box Demand Zone Ready for Precision Entries! 🔵📈
KNCUSDT is shaping up with a stunning opportunity for traders, and the blue box is the key demand zone where all the action could unfold. This zone is not just another level – it’s an area carefully selected using advanced techniques to give you the best chances for a precise entry.
Why the Blue Box?
Strategically Picked Demand Zone: The blue box is a result of a detailed analysis with powerful tools such as volume footprint, volume profile, cumulative delta volume (CDV), and liquidity heatmaps . This makes it a high-probability entry zone where buyers are likely to step in.
Comprehensive Confirmation: Before executing a trade, I rely on critical indicators such as CDV, liquidity heatmaps, volume profiles, volume footprints (for strong buyer presence), and upward market structure breaks in lower time frames . This multi-step approach ensures that we are trading with confidence and clarity.
Calculated Risk/Reward Setup: The blue box presents a risk-managed approach while offering significant potential for reward. It’s where your strategy meets real-time market conditions for optimal results.
The Plan:
Waiting for the price to touch this blue box could provide you with the perfect entry point, backed by real buyer interest and technical confirmation. It’s about precision, not guesswork.
Engage & Boost!
If this analysis resonates with you, don’t forget to hit the boost and drop a comment! Your engagement fuels my commitment to sharing these high-value insights with you. Let’s create profitable strategies together!
Learn the Secrets – Completely Free!
Want to learn how to spot demand zones like this? DM me for a full breakdown of how I use CDV, liquidity heatmaps, volume profiles, and volume footprints to identify key trading areas. I’ll guide you through these powerful techniques for free!
If you think this analysis helps you, please don't forget to boost and comment on this. These motivate me to share more insights with you!
I keep my charts clean and simple because I believe clarity leads to better decisions.
My approach is built on years of experience and a solid track record. I don’t claim to know it all, but I’m confident in my ability to spot high-probability setups.
If you would like to learn how to use the heatmap, cumulative volume delta and volume footprint techniques that I use below to determine very accurate demand regions, you can send me a private message. I help anyone who wants it completely free of charge.
My Previous Analysis (the list is long but I think it's kinda good : )
🎯 ZENUSDT.P: Patience & Profitability | %230 Reaction from the Sniper Entry
🐶 DOGEUSDT.P: Next Move
🎨 RENDERUSDT.P: Opportunity of the Month
💎 ETHUSDT.P: Where to Retrace
🟢 BNBUSDT.P: Potential Surge
📊 BTC Dominance: Reaction Zone
🌊 WAVESUSDT.P: Demand Zone Potential
🟣 UNIUSDT.P: Long-Term Trade
🔵 XRPUSDT.P: Entry Zones
🔗 LINKUSDT.P: Follow The River
📈 BTCUSDT.P: Two Key Demand Zones
🟩 POLUSDT: Bullish Momentum
🌟 PENDLEUSDT.P: Where Opportunity Meets Precision
🔥 BTCUSDT.P: Liquidation of Highly Leveraged Longs
🌊 SOLUSDT.P: SOL's Dip - Your Opportunity
🐸 1000PEPEUSDT.P: Prime Bounce Zone Unlocked
🚀 ETHUSDT.P: Set to Explode - Don't Miss This Game Changer
🤖 IQUSDT: Smart Plan
⚡️ PONDUSDT: A Trade Not Taken Is Better Than a Losing One
💼 STMXUSDT: 2 Buying Areas
🐢 TURBOUSDT: Buy Zones and Buyer Presence
🌍 ICPUSDT.P: Massive Upside Potential | Check the Trade Update For Seeing Results
🟠 IDEXUSDT: Spot Buy Area | %26 Profit if You Trade with MSB
📌 USUALUSDT: Buyers Are Active + %70 Profit in Total
🌟 FORTHUSDT: Sniper Entry +%26 Reaction
🐳 QKCUSDT: Sniper Entry +%57 Reaction
📊 BTC.D: Retest of Key Area Highly Likely
I stopped adding to the list because it's kinda tiring to add 5-10 charts in every move but you can check my profile and see that it goes on..

KNCUSD 1WKNC ~ 1W 📈
#KNC Make purchases gradually from here. We estimate that this resistance will be broken in the near future. minimum target 20%++

Long trade setup for KNCUSDTFor the BINANCE:KNCUSDT.P Long Trade Setup, the following values are suitable for our interval trade:
Entry: 0.7427
Target: 0.8082
Stop: 0.6948
Cost Reduction: 0.7213
The profit is reasonable relative to the risk.
*This is not investment advice; you can lose money. Crypto AI Signals is not responsible for any trades. 🚫💰

Long trade setup for KNCUSDTFor the BINANCE:KNCUSDT.P Long Trade Setup, the following values are suitable for our interval trade:
Entry: 0.7213
Target: 0.7696
Stop: 0.6955
Cost Reduction: -
The profit is reasonable relative to the risk.
*This is not investment advice; you can lose money. Crypto AI Signals is not responsible for any trades. 🚫💰

Long trade setup for KNCUSDTFor the BINANCE:KNCUSDT.P Long Trade Setup, the following values are suitable for our interval trade:
Entry: 0.6415
Target: 0.6935
Stop: 0.6048
Cost Reduction: -
The profit is reasonable relative to the risk.

KNCUSDTBINANCE:KNCUSDT long idea
⛔"Daily crypto market analyses I provide are personal opinions & not financial advice. Trading carries risks, so do your own research & seek advisor's help.#DYOR"
Don't forget to like and comment

#KNC aiming 2 USD KNC aiming 2 USD ..Kybernetwork is ready for blast..it'll grab upeer box dollar soon.
Enjoy :)

KNC Divergence by ADZ indicatorBINANCE:KNCPERP
KNC can see one more capitulation but we have a good news
✅Before we start to discuss, I would be glad if you share your opinion on this post's comment section and hit the like button if you enjoyed it.
Thank you.
Possible Targets and explanation idea
➡️Global FIB. Came to investments area -0.18 Level.
➡️Now we can test on weekend 0.54 D1 timeframe global downtrend line
➡️Target for middle term correction for next bull run if you are investor 0.618 marked
➡️Capitulation on Black Swan 0.16 cents (more than possible for KNC
➡️We need volume for continuation. We trade under fundamental price
➡️Good sign by ADZ indicator big players accumulate KNC and price going lower. We can see one more dump for confirmation
Hope you enjoyed the content I created, You can support with your likes and comments this idea so more people can watch!
✅Disclaimer: Please be aware of the risks involved in trading. This idea was made for educational purposes only not for financial Investment Purposes.
* Look at my ideas about interesting altcoins in the related section down below ↓
* For more ideas please hit "Like" and "Follow"!

🟢 KNCUSDT - 1D (30.09.2022)🟢 KNCUSDT
TF: 1D
Side: Long
SL: $1.0889
TP 1: $1.3249
TP 2: $1.4710
TP 3: $1.5890
MACD and RSI look ready.

$KNC bounce incoming....?BINANCE:KNCBUSD has just hit important historical support.
Looking for a reversal here with break above +/- retest for confirmed entry or unconfirmed entry at mid-zone PRZ
Potential 6+ R:R if TP#2 hit
...Interesting

KNCUSDT Long SignalKNCUSDT is one of the major hidden gems, i am currently bullish once it hits my entry setup, the coin is promising and the profits are amazing.
My setup is:
Entry: 1.05 - 1.15
OneTime: 1.12
Short Term Profits: 1.25, 1.28, 1.34, 1.39
Mid/High Profits: 1.75, 2.15, 2.40, 2.90
Please be careful with your money.
Good Luck.

KNC long ideaHeres a nice KNC long idea, obviously mindful of whatever bitcoin decides to do.
Stops just below the ichimoku cloud.
Three targets sit overhead.

KNC long ideaHeres a nice KNC long idea, obviously mindful of whatever bitcoin decides to do.
Stops just below the ichimoku cloud.
Three targets sit overhead.

KNC long optionsHeres some options for longs on KNC.
There uptrend that we have seen here in the diagonal, is getting some pressure and may soon break down. As result would be looking for good areas to take longs.
The 0.618 line here looks very good, but i accept that price action could well carry on down towards the bottom of the range. Will have to see how prices respond to these levels.

KNC LONG IDEAKNC had a nice rally after breaking through its overhead macro resistance (diagonal).
We have see it rally into resistance (horizontal) and now id expect its to cool off a bit.
Clear price action support/resistance flip down below could serve as a nice point to buy and go long, with stops just below. Id expect some consolidation below this overhead resistance before finally breaking through. Taking the long lower down means we reduce our risk and also, have the opportunity to take profit if the price makes it back to resistance.
(as an alternative option, you could wait for the break of this resistance and then long the retest)
(will also post the chart of KNC/BTC down below; is always a good idea to see if the bcc pairing is as equally bullish).

KNC long (patience possibly)This one might need some patience as bitcoin is looking wobbly. But there is a clear opportunity here for a breakout.

KNC LongIm not 100% on my stop loss position on this one. Open to criticism. I'd like to be at the stage of the price action sitting above the cloud, but it isn't quite there yet, tbh, this might be the first up more of an a nice rally.
It seems to be shaping up well here. KNC/BTC looking the same setup.

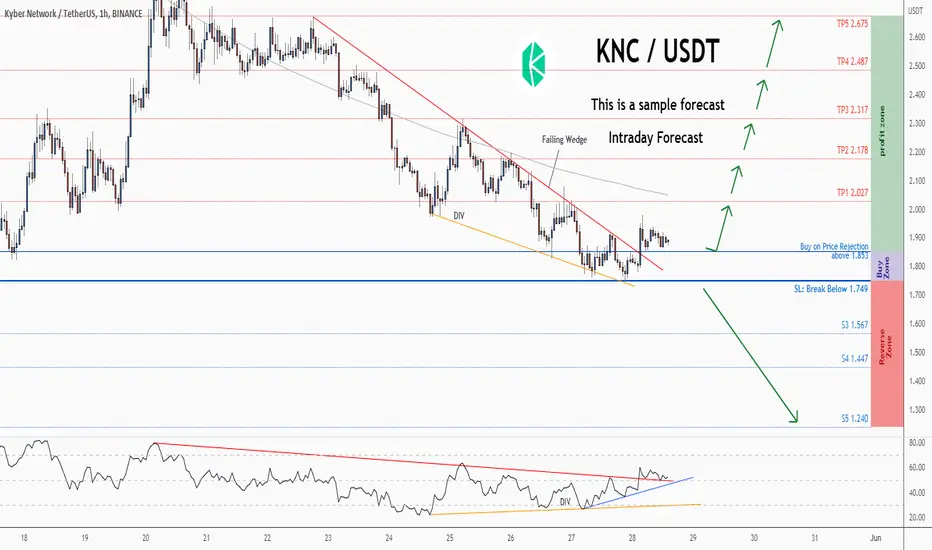
💡Don't miss the great buy opportunity in KNCUSD @KyberNetworkTrading suggestion:
". There is a possibility of temporary retracement to the suggested support line (1.853).
. if so, traders can set orders based on Price Action and expect to reach short-term targets."
Technical analysis:
. KNCUSDT is in a range bound, and the beginning of an uptrend is expected.
. The price is below the 21-Day WEMA, which acts as a dynamic resistance.
. The RSI is at 52.
Take Profits:
TP1= @ 2.027
TP2= @ 2.178
TP3= @ 2.317
TP4= @ 2.487
TP5= @ 2.675
SL= Break below S2
❤️ If you find this helpful and want more FREE forecasts in TradingView
. . . . . Please show your support back,
. . . . . . . . Hit the 👍 LIKE button,
. . . . . . . . . . Drop some feedback below in the comment!
❤️ Your support is very much 🙏 appreciated!❤️
💎 Want us to help you become a better Forex / Crypto trader?
Now, It's your turn!
Be sure to leave a comment; let us know how you see this opportunity and forecast.
Trade well, ❤️
ForecastCity English Support Team ❤️
💡Don't miss the great buy opportunity in KNCUSD @KyberNetworkTrading suggestion:
". There is a possibility of temporary retracement to the suggested support line (1.853).
. if so, traders can set orders based on Price Action and expect to reach short-term targets."
Technical analysis:
. KNCUSDT is in a range bound, and the beginning of an uptrend is expected.
. The price is below the 21-Day WEMA, which acts as a dynamic resistance.
. The RSI is at 51.
Take Profits:
TP1= @ 2.027
TP2= @ 2.178
TP3= @ 2.317
TP4= @ 2.487
TP5= @ 2.675
SL= Break below S2
❤️ If you find this helpful and want more FREE forecasts in TradingView
. . . . . Please show your support back,
. . . . . . . . Hit the 👍 LIKE button,
. . . . . . . . . . Drop some feedback below in the comment!
❤️ Your support is very much 🙏 appreciated! ❤️
💎 Want us to help you become a better Forex / Crypto trader ?
Now, It's your turn !
Be sure to leave a comment; let us know how you see this opportunity and forecast.
Trade well, ❤️
ForecastCity English Support Team ❤️
