PRL – Technical Breakout Trade SetupPRL has successfully completed an Ascending Triangle formation and delivered a strong breakout today. The price has breached the horizontal resistance while maintaining higher lows, indicating a bullish continuation setup.
🔹 Trend: Bullish
🔹 Pattern: Ascending Triangle (Breakout Confirmed)
🔹 Volume: Improving, supporting the breakout
🔹 RSI: Holding in the positive zone, confirming strength
🟢 Buy Levels
✅ Primary Buy: CMP 38.71
✅ Secondary Buy (Pullback): 37.25
🔴 Stop Loss
❌ Stop Loss: 35.50 (Strict)
🎯 Target 1: 41.80
🎯 Target 2: 43.00
🎯 Target 3: 45.80
✔️ Favorable risk-to-reward ratio
✔️ Partial profit booking recommended at each target
✔️ Trail stop loss after Target 1 is achieved
⚠️ Disclaimer:
Markets are volatile. Follow proper risk management and trade only with capital you can afford to risk.
📌 This analysis is based purely on technicals and is not financial advice.
Kse100

#CNERGY (D) | Descending Trendline Breakout | Technical View
#CNERGY has shown a constructive technical improvement after spending several weeks in a controlled downtrend.
The stock has broken above a descending trendline, indicating a possible shift from consolidation to an emerging bullish phase. Price is currently trading around the 7.70–7.75 zone, which now acts as a critical pivot area.
Momentum indicators are gradually turning positive, with MACD showing early #bullish crossover signals, while volume behavior supports the breakout attempt.
As long as CNERGY holds above the 7.30–7.10 support band, the structure remains favorable for #upside continuation toward 8.20, followed by 8.80–9.40 over the near term. A sustained move below 7.10 would weaken the bullish setup and signal caution.
Disclaimer: This stock is not being followed closely and is shared on special request of
@zaidiviews Sir; it is not a recommendation and is for educational purposes only.

LCI - SWING IDEA 📊 LCI | Swing Call
LCI has completed a healthy correction within its long-term uptrend and is currently trading near a multi-tested support zone.
Price is holding above the 295 – 286 demand zone along with the rising trendline support, making this area a high-probability buying zone. Previously, strong bullish reactions have been observed from this level.
The RSI is showing recovery, and the recent bounce, accompanied by improving volume confirms growing buyer interest. As long as the price does not close below 286 on a daily basis, the overall bias remains bullish.
🟢 Buying Zone
CMP: 297
🔴 Stop Loss
286 (Daily close basis)
🎯 Targets
320
335
355
375
396
⚠️ Risk management is compulsory.

PPL - Technical OutlookPPL is moving firmly within its ascending channel on the 1D timeframe and is now approaching the major breakout level at 216. A confirmed break above this zone can open the next leg higher, with the first short-term target near 230, which aligns with the channel’s upper resistance. Beyond that, the 240 level stands as an external structural resistance outside the channel. Bullish structure remains intact as long as price holds within the rising channel.

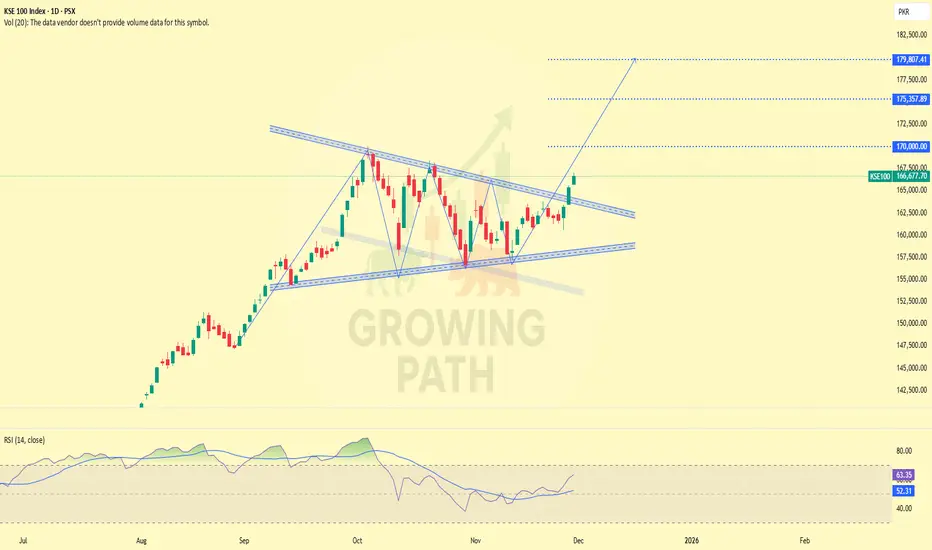
KSE100 — Daily | Breakout Confirmation + Upside TargetsThe index has confirmed a clean breakout from the falling channel and is now holding firmly above the trendline structure. Price has shifted into a stronger bullish posture compared to previous sessions.
The RSI has moved above 60, indicating momentum is entering bullish territory. Multiple higher-timeframe closes (weekly & monthly) also support continuation to the upside.
As long as price remains above the breakout zone, the upward targets remain active:
Targets:
• 170,000
• 175,350
• 179,800
Minor resistance lies near 168,200 and 170,000, but the broader structure favors continuation as long as the breakout holds.
Bias: Bullish
Invalidation: Breakdown below the channel support or failure to hold above the breakout level.
GCIL – Technical outlookThe long-term uptrend channel is intact. Within this rising channel, the price has formed a horizontal parallel consolidation, which signals a strong continuation pattern.
RSI is stable and indicates readiness for an upside move.
Trade Plan:
Buy: CMP 35.22
Stop Loss: 33.50
Target: 40.00
After consolidation within the channel, an upside move is expected.
Always follow proper risk management.

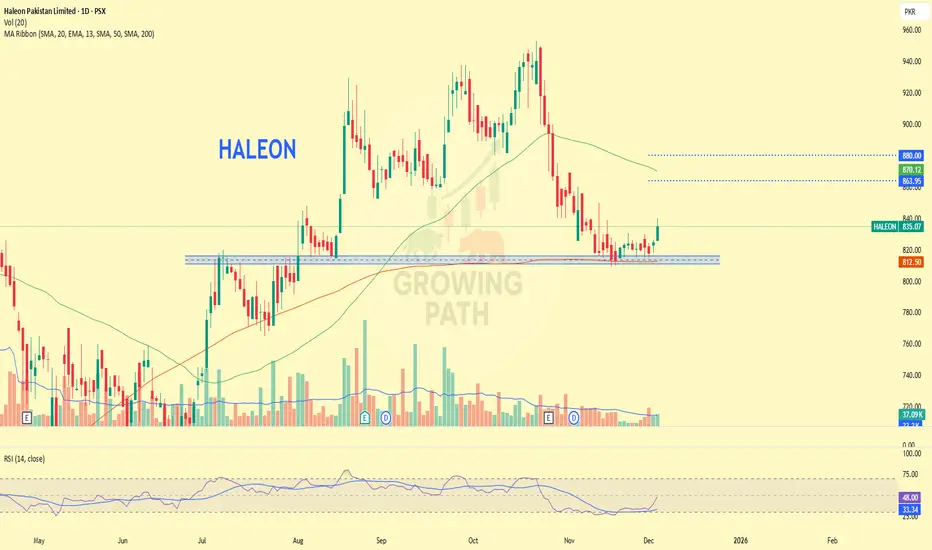
HALEON – Double Bottom ConfirmationHALEON Price has formed a clear double bottom, and the major support zone has now been tested for the third time, strengthening the bullish reversal setup. With today’s breakout candle and improving momentum, the stock shows strong potential for a continued move upward toward the 863 → 880 resistance band.
📈 Trade Plan
Buy between: 827 – 836 area
Stop-Loss: 809
Targets: 863 / 880
Holding above support keeps the bullish structure intact.
KEL - Technical OutlookKEL (PSX) – Daily Chart 📊
KEL has delivered a clear upside breakout from a descending channel, supported by healthy volume. Price has successfully flipped the previous resistance into support, signaling short-term continuation.
Buy Plan:
• First Buy: CMP
• Second Buy: 5.80 – 6.00 (pullback / support zone)
Stop Loss:
• 5.60 on daily closing basis
Targets:
• 6.90 → 7.40 → 7.75 → 8.50
Post-breakout, the structure is forming higher highs and higher lows. Risk is well-defined with a multi-stage reward potential. Partial profit booking is recommended at each resistance level.
Discipline with stop-loss is essential. 📈

GLAXO - Technical outlook GLAXO – SWING CALL 📊
Stock multi-time tested support zone (380–390) se bounce kar raha hai. Is area par pehle bhi strong demand aa chuki hai aur current structure short-term strength show kar raha hai.
Buy Plan:
• First Buy: 393
• Second Buy: 380–385 (support retest)
Stop Loss:
• 377 daily closing below
Targets:
• 415 → 430 → 440
Risk is clearly defined; favorable risk-to-reward setup for swing/positional traders. But patience is key

WAVES Technical Outlook
📊 Technical View – WAVES
Price is at an important horizontal support, showing a rebound attempt. The same zone is also supported by a rising trendline and aligns with the Fibonacci Golden Zone, creating a strong confluence area 🔁✨
🔹 Trade Idea
Entry: CMP 13.37
Stop Loss: 12.60 🛑
🎯 Upside Targets
14.30
14.85
15.38
16.00 (Breakout Zone) 🚀
The trend will maintain a bullish bias as long as the price holds above the support zone 📈.
A volume expansion breakout can accelerate upside momentum.
⚠️ Strict SL discipline is essential.

TREET Technical OutlookTREET has completed a Cup pattern on the daily chart and is now forming a horizontal accumulation zone. Price has moved above the ascending uptrend trendline, indicating a strong rebound and potential continuation move. The structure remains higher-low based, and the overall trend looks bullish as long as price holds above trendline support.
Buying Plan:
• Buy: CMP 31.84
Stop Loss:
• 30.50 (below trendline & range support)
Targets:
• TP1: 34
• TP2: 37
• TP3: 39.50
Technical Notes:
After consolidation, price shows a strong probability of bouncing from trendline support. RSI is in the neutral zone, leaving room for further upside. A breakout above 34 with volume expansion can accelerate bullish momentum. Partial profit booking is recommended at each target. The trend remains bullish unless 30.50 is violated.

ATRL – Swing setupATRL has provided an upside breakout from a symmetrical triangle / compression zone on the daily chart. After multiple sessions of consolidation, price has maintained a higher-low structure and is showing strength supported by volume. The overall trend signals a bullish continuation as long as the price holds above key support levels.
Buying Zone:
• First Buy: 688–690 (CMP zone – already shared during market hours)
• Second Buy (on dip): 672 (trendline & structural support)
Stop Loss:
• 640 (below major structural support)
Targets:
• TP1: 720
• TP2: 740
• TP3: 775 (major breakout level)
Notes:
Price is trading above the ascending trendline and RSI is also indicating strength. Minor pullbacks are buyable as long as the structure remains intact. Partial profit booking is recommended in the 720–740 zone, while 775 remains the medium-term breakout target. The trend will remain bullish unless 640 is breached.
For educational & technical discussion purposes only.

JVDC - Technical Outlook Price has successfully defended both the major ascending trendline and the horizontal support, and is now pressing into the upper boundary of a mini descending channel. A confirmed breakout above 77-78 can open the path toward the following targets:
• TP1: 81
• TP2: 86
• TP3: 90.50
• TP4: 99-100 (if 90 holds)
with SL kept at 70 (closing basis). Traders are advised not to wait for the final 99 target but with (10/20% only)—booking profits earlier around 80–90% of each TP zone is a safer and more disciplined approach if the breakout remains valid.

SLGL Technical Outlook
Price strong uptrend mein hai 📈
Price apni multi-time rising trendline ko defend kar rahi hai.
Agar yahan se volume ke sath move aaya to next leg up expect ki ja sakti hai 🚀
Buy CMP 20.87
Stop Loss: 19.60 (Daily closing basis)
Targets:
TP1: 21.90
TP2: 23.60
TP3: 25.30
TP4: 26.50 (breakout level)
Risk defined, reward attractive.

WAFI | Uptrend Channel Breakout & Retest Setup
Price has successfully broken out of its ascending channel with strong bullish momentum. Currently, price appears to be pulling back for a retest of the breakout area.
📌 Key Levels:
Buying Zone: 215 – 220
Stop Loss: 209
Target: 240 & 248 (recent high)
The 215–220 zone aligns with previous resistance turned support and dynamic trendline confluence. RSI remains in bullish territory, suggesting the pullback is corrective rather than reversal.
📉 A daily close below 209 will invalidate this bullish setup.
📈 Breakout retests often offer high-probability continuation trades.

FATIMA - Technical outlook Price is trading within a well-defined ascending channel and reacting positively from a key horizontal support zone. Overall structure remains bullish with higher highs intact.
📌 Trade Levels:
Entry: CMP
Stop Loss: 142
Targets: 158 / 165–170
⚠️ RSI Bearish Divergence:
RSI has formed a lower high while price printed a higher high, indicating weakening momentum, not an immediate reversal.
As long as price stays above 142 and the channel structure holds, upside continuation toward targets is possible.
Break below 142 on daily close will invalidate the setup.
📊 Trend is your friend until it bends.

MACFL - Technical outlookPrice is showing an early breakout from a falling wedge.
Wick has pierced the upper trendline; body close confirmation is still awaited.
Aggressive buy near CMP with defined risk.
A strong daily close above the wedge will confirm the reversal
Buy: 26.90 – 27.00
Stop Loss: 24.50 (structure invalidation)
Targets:
29.00
30.50
32.70
RSI showing bullish momentum shift.
Breakout confirmation will strengthen the move.
Trade with proper risk management.

CEPB - Daily – Fib Bounce Setup🔹 CEPB ne strong rally ke baad healthy correction di hai aur Fib 50%–61.8% demand zone se bounce kar raha hai.
🔹 Price structure higher low maintain kar raha hai, RSI bullish range mein hold hai — trend continuation setup develop ho raha hai.
🟢 Buy Zone: 31.50 – 32.50
🔴 SL: 31.40
🎯 Targets: 35 – 37
⚠️ Daily close below 31.40 = setup invalid
👉 Risk-managed buy near demand. Patience required.

OBOY | Long-Term Channel BreakoutPrice has broken out of a long-term parallel channel with volume confirmation.
RSI indicates strong bullish momentum.
Multi-timeframe structure (D/W/M) supports upside continuation.
Potential Zones: 13.70 – 15.80
Pullbacks may offer secondary opportunities.

MTL - Technical OutlookMTL | Swing Trade Idea 📊
The price is holding strong above multiple supports and reclaiming the MA50.
RSI at 59 indicates a bullish momentum shift.
Entry: 518
SL: 500
TP: 560 / 595 / 620
Structure-based swing trade — patience is key.

PSO - 1H Cup & Handle FormationPSO – 1H Update 📊
After completing the cup, the handle formation is in progress.
Price is currently at a multi-time support/resistance zone (450–455), which can act as the potential low of the handle. A bounce is expected from this area.
On RSI, bullish divergence is developing and RSI is near oversold levels.
If the divergence plays out, it can confirm a trend reversal.
Fresh buyers may consider entries from this zone, while previous buyers can continue to hold.
Targets (Insha Allah):
🎯 500+ | 510 | 530

PSO - Short Term Round bottom formationPSO is developing a well-defined rounded bottom on the 1H chart, with price now approaching the major neckline at 480. A decisive breakout above this zone would confirm the reversal pattern and open the door for continuation toward higher resistance levels. Bullish structure remains intact while holding above 450–455

KSE-100 Index (PSX) — Bullish Flag Breakout Targeting 200kTimeframe: Daily
KSE-100 remains in a strong uptrend and has formed a Bullish Flag after a sharp impulse move. Price is now breaking out of consolidation, signaling potential continuation toward new highs.
Technical Highlights:
Bullish flag breakout
Higher highs & higher lows intact
Price above key EMAs
RSI holding above 60 → strong momentum
Trendline support respected
Key Levels:
Support: 169k–170k
Major Support: 167.4k
Resistance: 173.5k–175k
Targets: 180k → 190k → 200k
Outlook:
As long as price holds above the flag support and EMAs, dips are likely to be bought. Structure favors continuation toward 190k–200k in coming weeks.
Educational idea only. Not financial advice. Manage risk accordingly.
