GADT - PSX - Technical AnalysisGADT on daily TF has just broken out of its bearish regression channel and at the moment price is at Resistance level. Moreover, price has just moved up from EMA20 as well. RSI is above 70 and KVO is also above zero level which are indications of beginning of a likely bull run. Weekly trend line has also been drawn. Technically correct entry will be on crossing of Weekly trend line which will also act as a resistance.
Trade Values are:-
Buy: 405
SL: 370
TP-1: 450
TP-2: 540
Kvo

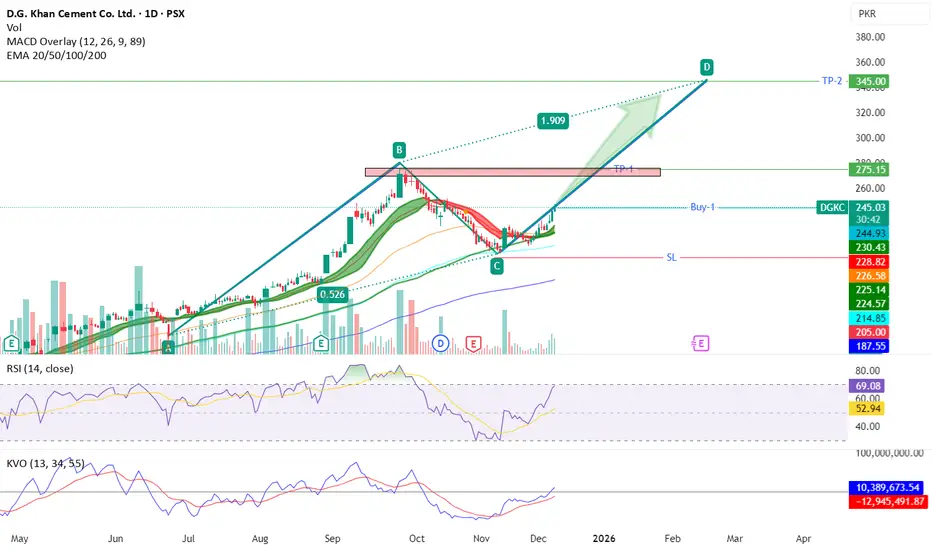
DGKC- PSX - Buy CallOn daily TF, price has just crossed EMA 20 level indicating a bull run. MACD overlay also suggesting start of buying momentum. RSI indicates that buyers are in control means prices are likely to continue the trend. KVO also suggesting that volumes are coming in this SCRIPT as KVO trigger is above Zero now.
AB=CD harmonic pattern has been drawn to arrive to potential TP2.
Trade values:
Buy = 245.50 (CMP)
TP-1: 270~275
TP-2: 345
SL: 205
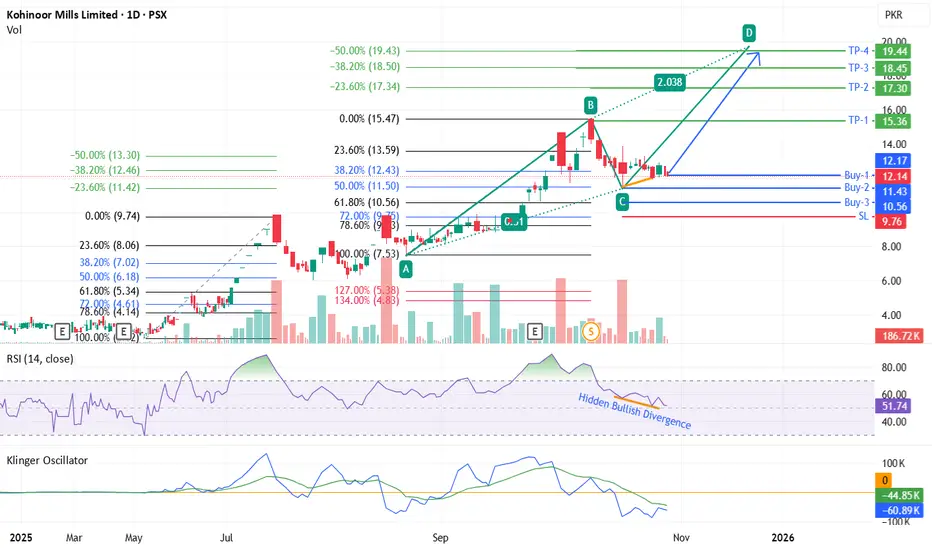
KML - Daily TF, Technical AnalysisKML after the 10/1 split share price dropped from PKR 146.77 to 14.67 and then it continued its price drop due to profit booking. Historically, this SCRIP retraces to 50% Fib level before starting its next run for HH.
At present, the price after retracing to 50% Fib level is almost maintaining 38~42% for the last 2 weeks consolidation. It may take even 1 to 2 weeks for once again going upwards but you never know it may go up even in one day as hidden bullish divergence has been observed on RSI. KVO is below zero level but its signal line (blue) is almost parallel to Klinger oscillator (green), suggesting slow transition but both lines are very close as well, therefore, any good news or bad news will give its immediate results.
For trade consider buying at levels mentioned on the chart.
ABCD harmonic pattern has been plotted to arrive to the TP-4.
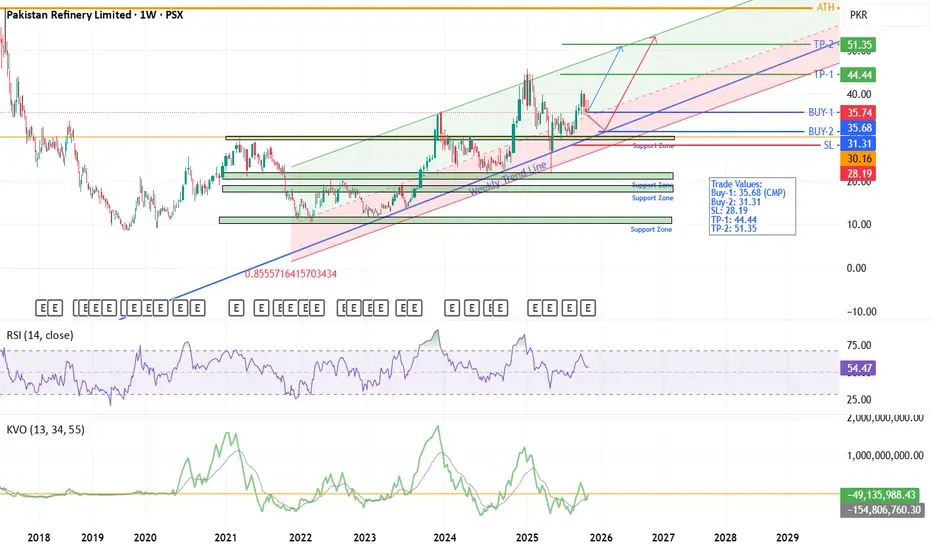
PRL - PSX - Weekly Technical AnalysisOn weekly TF, since Feb 2022 PRL is making HHs and HLs.
Regression Channel (RC) has been drawn with Upper Standard deviation set at 3 and Lower Standard deviation set at 2. In RC, central dashed line is most frequently visited by the price action. In addition, a weekly trend line (blue) has also been drawn. It is observed that price action respects trend line for taking support by it.
Anyway, PRL seems to be continuing its upward movement in the channel. However, its delayed payments by Govt for the last 2 years is major concern. If somehow, this aspect is improved then this SCRIPT can perform much better. In upcoming major military exercises of India may also trigger Risk Off scenario where Oil & Refinery Sector can get a boost as well. KVO suggest that this SCRIPT is about to go up. No divergence on RSI so trend should continue.
Trade Values:
Buy-1: 35.68 (CMP)
Buy-2: 31.31
SL: 28.19
TP-1: 44.44
TP-2: 51.35
AAOI is getting ready for an explosive move upwards- Current descending wedge will be broken as indicated by the linear regression channel
- MACD is green
- Volume is expected to cross above average volume
- We crossed above KVO trigger line and will continue upwards momentum next week
Also, short float is over 70% and not sustainable for a stock such as this.
Currently, I'm long with $60 average and $75 short-term PT. GLTA.
