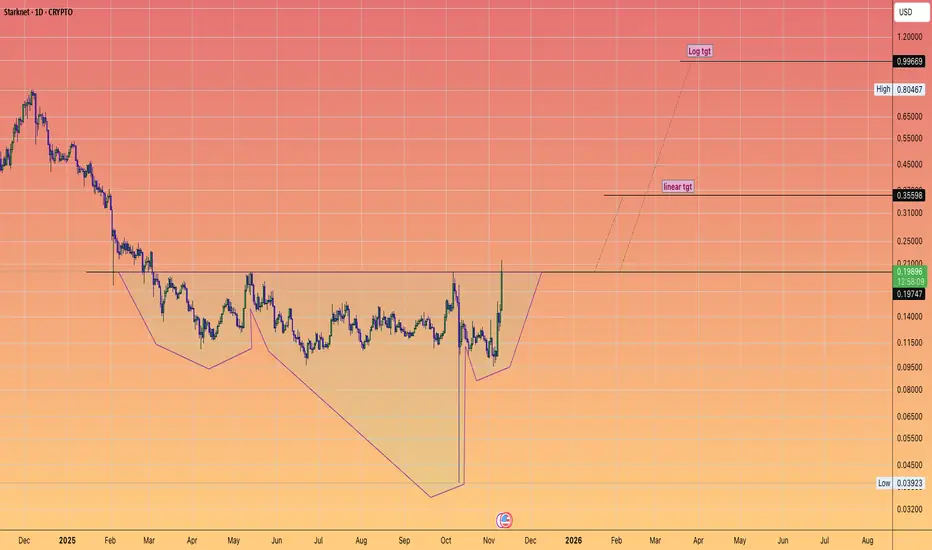
STARKNET went to zero (relatively speaking) But eyes $110/10 Was a Harrowing experience for many altcoin enthusiasts.
Which many are still dealing with the aftermath of psychologically and financially.
Those have been some of the best conditions that bring about the best returns in altcoins going forward.
When they have been beaten down to virtually zero
and when there is no one left to sell and only the strongest of hands remain.
Starknet is a good example of a coin that has reclaimed back all that damaging price action and is on the verge of a breakout.
There are many other #ALTS you could pick that have similar charts #DYOR
Starknet is just an example not saying this will be a fast horse or even remotely closest to being one of the fastest horses.
But the chart piqued my interest.
Share anything that peaks yours in the comments...
And I will be sure to have a look at it for you.
L2
What the HEX?!Where is the HEX price pointing towards.
This is HEX on #Pulsechain btw.
I suspect a zero will be added in the coming year.
Price is action is getting compressed against a key level which has been tested plaenty of times before.
So in effect a floor that is very likely with minimal strength to uphold an exit stampede during a crypto winter.

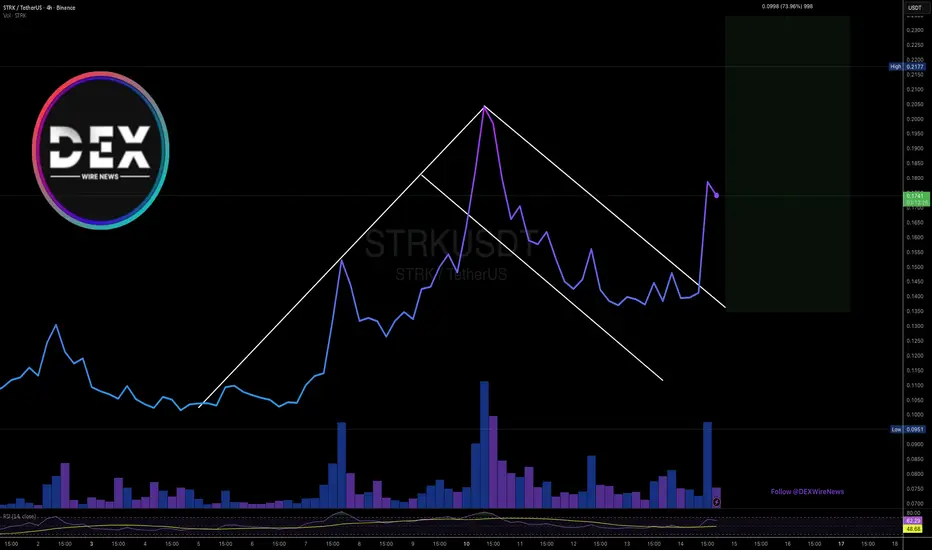
Breaking: Starknet ($STRK) Spike 24% Today Set for 70% Surge The price of the altcoin- Starknet ( NASDAQ:STRK ) saw a noteworthy uptick of 24% today breaking out of a falling wedge albeit the market was bearish with CRYPTOCAP:BTC dipping to the $90k zone.
NASDAQ:STRK has already broken the ceiling of the flag eyeing a move to the $1.5- $2 resistance should more buyers step in.
With the RSI at 61, NASDAQ:STRK is able to pull the 70% move. And its not only the charts. As per data from Defilama, Starknet has a total of $880.91M locked in TVL. This number shows a growing interest in the altchain.
About Starknet
Starknet is a Layer 2 blockchain solution built on Ethereum that aims to make transactions faster and cheaper while maintaining security.
It uses advanced math called STARK proofs to verify transactions efficiently.
Think of it like an express lane built on top of Ethereum's highway, helping more people use blockchain applications without the usual high costs and slow speeds.
Starknet Price Live Data
The Starknet price today is $0.170954 USD with a 24-hour trading volume of $402,680,683 USD. Starknet is up 18.91% in the last 24 hours. The current CoinMarketCap ranking is #78, with a live market cap of $779,552,068 USD. It has a circulating supply of 4,560,020,668 STRK coins and a max. supply of 10,000,000,000 STRK coins.
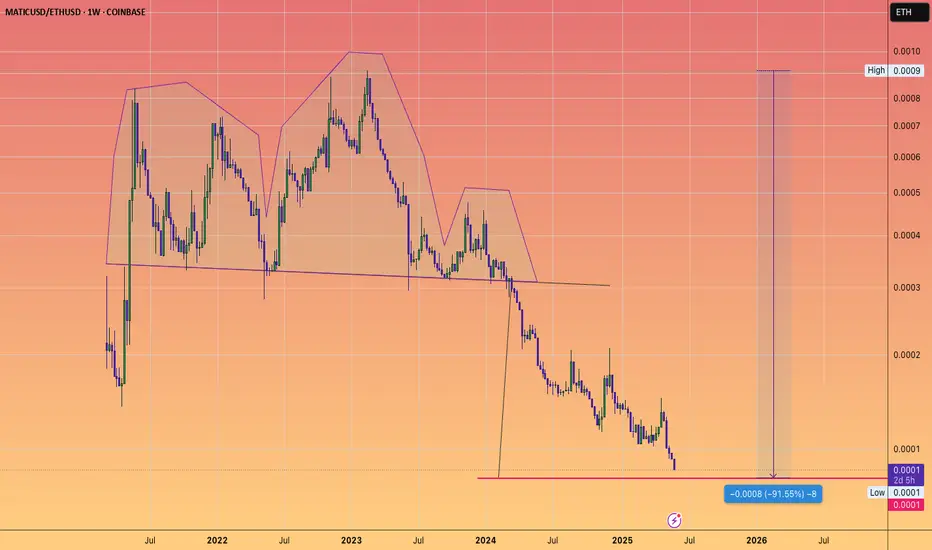
MATIC approaching Head and shoulders target...versus ETH
which would be a -91% loss of value versus the second most important crypto
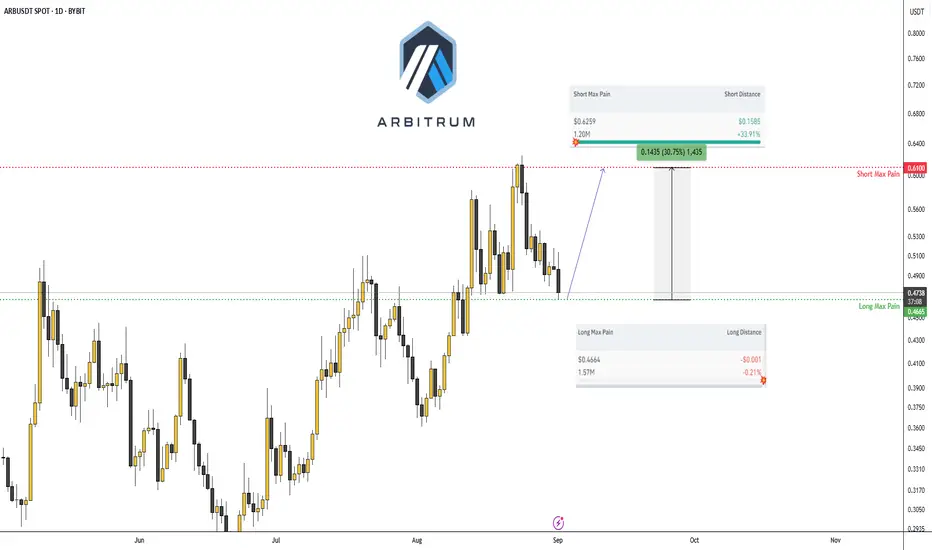
Arbitrum — September 01, 2025.AMEX:ARB #Arbitrum — September 01, 2025.
Everybody's favorite Arbitrum (a top-tier L2 solution for Ethereum) has corrected nicely and hit the max pain level for long traders.
It's formed a solid entry point with a potential for a +30% move.
Entry price: $0.4665 - $0.4750
Take Profit: $0.6100 (+30%)
➖➖➖
Short Max Pain = $0.6100
Long Max Pain = $0.4665
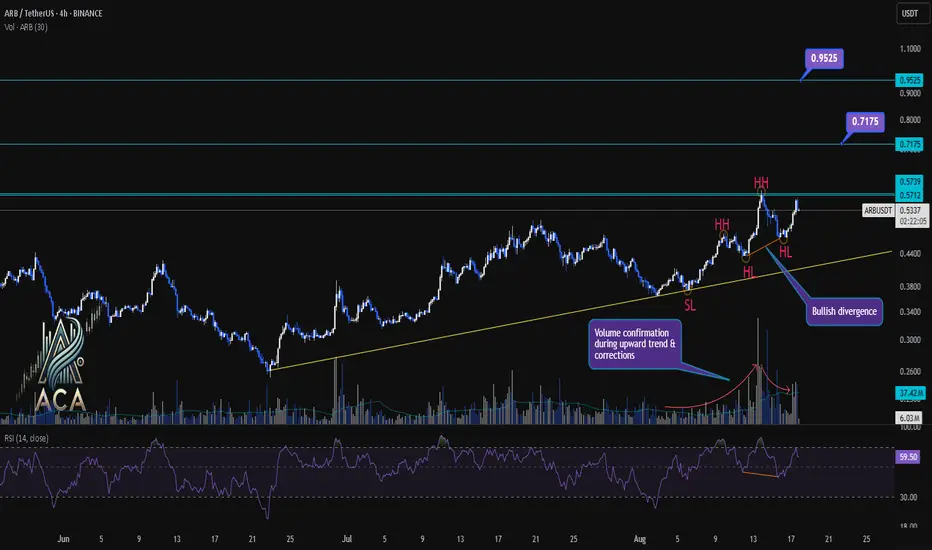
ARBUSDT 4H Chart Analysis | Trendline Integrity & Key TargetsARBUSDT 4H Chart Analysis | Trendline Integrity, Volume, Divergence & Key Targets
🔍 Let’s break down ARBUSDT on the 4-hour chart, spotlighting trend structure, swing plays, volume signatures, and momentum for precise trading setups.
⏳ 4H Overview
The chart shows ARBUSDT maintaining a solid uptrend, respecting its ascending trendline while consistently printing higher highs (HH) and higher lows (HL). This structure underscores ongoing bullish conviction. Price action recently staged a strong bounce off the trendline with marked bullish divergence on RSI, and volume confirmation adds muscle to the move.
🔺 Key Bullish Setup:
- Trendline Continuation: Price respects and bounces off a well-defined yellow trendline, reinforcing the uptrend’s technical foundation and providing a dynamic support reference for traders.
- Swings (HH, HL, SL): The chart highlights multiple Higher Highs (HH) and Higher Lows (HL), validating persistent bullish order flow. A prior same low (SL) remains untouched, further cementing trend integrity.
- Volume Confirmation: Noticeable upticks in volume during upward impulses and corrections confirm genuine momentum and institutional participation. Recent volume surges during corrections point to accumulation.
- RSI & Bullish Divergence: The RSI (14) is currently at 60.51, below typical overbought territory and leaving room for more upside. Significantly, the latest HL forms alongside a bullish RSI divergence—price makes higher lows as RSI also rises—implying underlying buying strength and likely trend continuation.
- New Overbought OB Level: A fresh OB is marked at ~82.40 on the RSI, establishing a clear ceiling should bullish momentum accelerate.
- Resistance & Targets: Key resistance is at 0.5712 — price testing or breaking this level is pivotal. Above, technical targets are projected at 0.7175 and 0.9525, aligning with previous structural pivots and projected breakout extensions.
📊 Supporting Details:
- Trendline & Swings: The consistent pattern of HLs, HHs, and untouched SL demonstrates primary bullish control.
- Volume: Surging volumes during impulse moves and corrections confirm that buyers are driving rallies while also absorbing dips.
- RSI Bullish Divergence: Underlines demand emergence at each corrective phase.
- Order Book Dynamic: Price above 0.5712 faces thinner resistance, offering room for a rapid move toward the upper targets.
🚨 Conclusion:
With trendline support holding, recurring bullish swing patterns, strong volume on breakouts and corrections, and RSI confirming hidden buying pressure, ARBUSDT is positioned for bullish continuation. Watch for confirmed closes above 0.5712; upside expansions to 0.7175 and 0.9525 are highly probable if volume inflow and RSI momentum persist. The defined new RSI OB at 82.40 helps monitor overextension risk.
Stay alert for any trendline or HL breakdowns, but as long as this structure holds with supporting volume and momentum, the bias remains positive. Watch resistance reactions and momentum signals to ride the next wave.
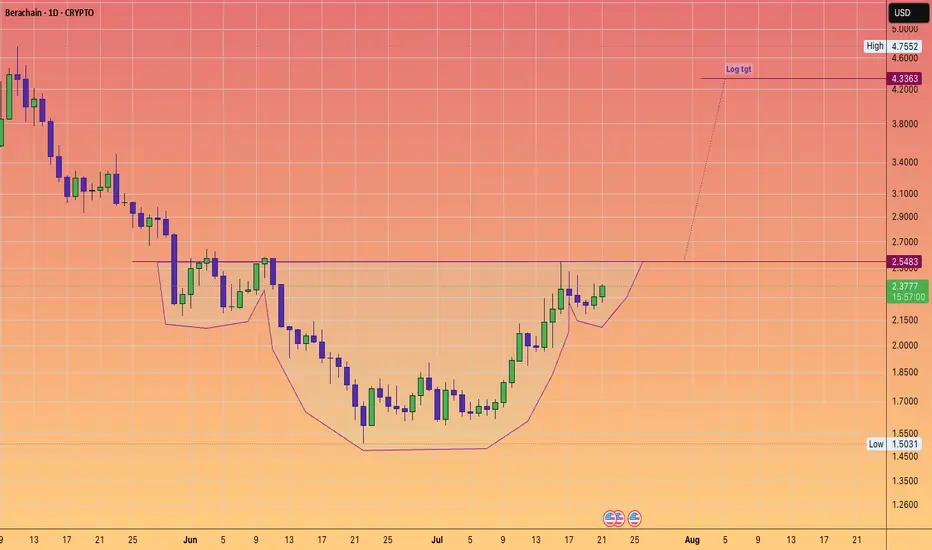
Berachain MOGGING the bears! Back to over $4#InverseHead&Shoulders
clean setup
log tgt provided.
sorry its altseason 100 things going on
no lengthy description needed :)
ZkSync Main Trend. L2 for ETH. $458 million funds 21 02 2025Logarithm. Time frame 3 days.
🟢Reversal zone. At the moment, there is a fractal repetition with the previous reversal zone. The logic and key local levels on which the direction of the secondary trend will depend are shown with arrows.
🔴Also showed the range and future levels of an unlikely extremely negative scenario. That is, a breakthrough of the long stop collection zone of a large squeeze (this happens very rarely, since it is irrational, but since in the news background earlier during the listing - funds of 458 million investments, then why not) and the formation of a capitulation channel under the channel with a full range (hold the chart and pull it down), or only from its median (dotted, more likely if we go this way).
Also, regardless of the implementation of scenario 1 or 2, the maximums of this cycle are shown (hold the chart and pull it up). Or rather, the zone. The percentage itself will be different, the "levels" of the zone, most likely, will not.

OP/USDT Secondary trend. Wedge. Pivot zones. 27 07 2024OP/USDT Secondary trend. Wedge. Pivot zones. 27 07 2024
Logarithm. Time frame 3 days. A descending wedge is forming. The price is near the dynamic Gann support (reaction from it), but still in the range of the descending wedge pattern. The reaction in this resistance zone will determine the trend for the near future.
On the chart, I have specifically shown the minimum percentages of the two key reversal zones for the trend to local resistance levels, for the potential of option A and B.
Major trend.
OP/USDT Major trend. 07 2024 Time frame 1 week.

(JASMY) jasmy "cycle-phase-wave"According to an enhanced MACD indicator that follows three layers of information I found the peak MACD green to line up with the yellow lines on the chart that are assigned with the next alternative colored line to be aligned with the most recent improvement in the otherwise losing price for the last months of time. Although an elliott wave is not seen I figured it would be possible to create a measurement like wave using an indicator to guide where those points should be.

(jasmy) JASMY bar array pattern fading in and out of a low motion pattern indicator. Use examples from the past to understand the meaning. included lines from previous posts unchanged in purple representing key moments of the jasmy chart for reference. The price broke the previous lows.

(TOTAL) total crypto mcap "candles on record [history"worst red candles on record in the past four years and various progresses of positive growth measured from lowest in between points.


Arbitrum back to a DollarA distinct W pattern has emerged, leading to a breakout that has been both triggered and retested at the breakout level.
Here are the target levels for this straightforward technical setup for your enjoyment!

$ZRO distribution zone 10$I don't like L2, but as an asset for ambushing a bunch of stupid traders-investors the perfect category of crypto assets. We have consolidated above 50 EMA, the market maker will play the profit and put a lot of people into this asset. Do not buy long term, as an option to spill over into short term. Monitor the blockchain and you will be happy!
Horban Brothers.

Optimism is determined to conquer the heights! $OPEverything here is beautiful! From technical analysis to blockchain analysis. I can see us moving in a parallel channel, where when combined with fibonacci we come to the 1.618 level right to the upper limits of this price channel. I would expect a value low in the area of $3.5 per coin with the most positive scenario expecting $7.1 per coin. I see the presence of a number of prominent Market Makers in the blockchain, but I don't like the contingent that holds this asset. Perhaps over time people will become disillusioned with the L2 range and sell their coins to a Marketmaker. Thus setting the stage for a hands free flight!
Best wishes, Horban brothers!

BB is getting ready to flyBounceBit has attracted the attention of several prominent investors and venture capital funds, who saw in the project the potential for growth and innovation in cryptocurrency and DeFi.
Binance Labs
Blockchain Capital
OKX Ventures
The guys above are ready to send the BB price into the distribution zone. Be ready!

#Altcoins mega bull pump is almost there!#Alts trends Depin Rwa L2 L1 Memecoin AI gaming Defi and many other topics will be pumped.

World Chain Eyes Ethereum Layer 2 Expansion With New IntegrationWorld Chain, an AI-driven crypto project backed by Sam Altman, is making significant waves in the market with its latest strategic move. The project has officially announced the integration of 'Across' to streamline cross-chain transactions and further its expansion into Ethereum Layer 2, an endeavor that has sparked widespread discussions among crypto enthusiasts. This advancement, alongside the coin’s ongoing price activity, has fueled speculations on whether Worldcoin ( MIL:WLD ) could achieve the ambitious target of $5.
Developments: Integration of 'Across'
On November 1, World Chain revealed its collaboration with Across, an established cross-chain bridge known for facilitating efficient and cost-effective transactions across multiple EVM-compatible blockchains. This strategic integration positions World Chain as a formidable player in the Ethereum Layer 2 space, enabling the project to provide secure and affordable cross-chain transfers right from the start.
With the addition of Across, developers on World Chain can now harness native interoperability to build powerful cross-chain applications. Moreover, users can seamlessly bridge key assets like ETH, wETH, USDC, and wBTC, bolstering World Chain’s ecosystem and attracting a broader user base. The project has also adopted ERC-7683, a cutting-edge swapping standard co-developed by Across and Uniswap, adding a new layer of functionality to its network.
Market Sentiment and Potential Price Movement
Despite these promising advancements, WLD’s market performance has been mixed. At the time of writing, MIL:WLD is trading at $1.93, reflecting a 2.13% intraday decline. The token has experienced volatility, with its 24-hour low and high recorded at $1.85 and $1.99, respectively. Over the past month, however, MIL:WLD has gained 15%, demonstrating resilience and the potential for growth.
Crypto market participants remain cautiously optimistic about WLD’s future, especially in light of the project’s Ethereum Layer 2 expansion. Nevertheless, a $5 price target appears overly ambitious under the current market conditions. Data from Coinglass indicates a 4% drop in WLD’s futures open interest (OI) to $214.60 million, hinting at mixed investor sentiment and uncertain price prospects.
Technical Analysis
From a technical standpoint, MIL:WLD is facing significant hurdles. The coin is trading within a falling trend channel, with no signs of a breakout. The RSI (Relative Strength Index) is hovering at 36, indicating oversold conditions and weak momentum. The lack of positive price action comes amid lingering concerns over Worldcoin’s controversial iris-scanning technology, which has faced regulatory scrutiny in several countries.
Crucially, MIL:WLD is approaching a critical support level at $1.50, aligning with its one-month low. This support level could serve as a key pivot point, potentially triggering a rebound if buying pressure increases. However, for MIL:WLD to sustain a meaningful rally and aim for higher price targets, it must overcome the 200-day exponential moving average (EMA) and break past the resistance level at $3.00.
Path to $5: A Long-Term Vision
While a $5 price target may seem far-fetched in the short term, there are scenarios where MIL:WLD could achieve this milestone. The successful execution of its Ethereum Layer 2 strategy could drive greater adoption, especially if transaction fees and network efficiency improve as promised. Additionally, if World Chain’s AI-meets-crypto model gains traction and the project’s user base expands globally, the token’s valuation could see a significant boost.
Nevertheless, the road to $5 is fraught with challenges. The project must overcome technical resistance levels and mitigate negative sentiment surrounding its biometric technology. Market conditions and broader crypto trends will also play a pivotal role in shaping WLD’s future price trajectory.
Conclusion
World Chain’s integration with Across marks a pivotal step in its quest to become a leading Ethereum Layer 2 player. While the move has bolstered the project’s fundamentals, WLD’s technical outlook remains under pressure. The coin’s journey to $5 will require overcoming substantial hurdles, but with strategic execution and market support, Worldcoin ( MIL:WLD ) could potentially turn the tide. For now, investors are watching closely, waiting for signs of a momentum shift as MIL:WLD continues to navigate its evolving landscape.

SKALE #SKL is positioned nicely versus Ethereumright in accumulation zone
which was a previous launchpad for good gains versus #ETH
can it do it again?
Well odds favour YES
and you have a well defined area/level that if you see skale breakdown on this ratio you can abandon the trade.
But I believe Skale can go on a Run
Gasless Gaming blockchains are very much needed if #Crypto is to succeed in bringing millions of more people into this space.

I'm out of my mind and waiting for ETH at 10k+.....I will briefly explain why I think so... I study wave analysis of charts and usually triangles are formed in the last phase before a bear market (global) on ethereum, this is exactly the figure, add to this that I expect an alt season and a flow of dominance below the 40% minimum. If you look at the BTC/eth chart, there will also be this triangle, which gives me an idea of possible movements

$OP must reclaim above 2 #usd#optimism #OP price declined from the long ascending channel and this' not good for mid term. #opusd must reclaim above 2.10 - 2.20 #usdt zone permanently to avoid greater correction in mid term.

$MATIC may do something like this#polygon #matic price has been declined from the trend line zone and may have bearish retest to confirm the further correction phase. Small bounces are always necessary. Not financial advice.
