LAURUSLAB READY FIRELauruslab pattern looks for blasting
educational levels marked for intraday.
Looks for for positional trade also
LAURUSLABS

LAURUS LAB - BullishLAURUS LAB - Bullish
1. Have strong support at 450, If it breaks 450 very tough to recover.
2. If the market trend reverses the 1st target will be 530.
3. If 530 trend breaks out the next target will be 620.
4. If 620 target breaks and opens and close above the primary trendline... the stock will fly to 900.
Note:
1. I’m not a SEBI Registered advisor, my views are personal and for educational purposes only.
2. Always check with your financial advisor and take the trade as per your risk/reward ratio.
3. Follow me for more patterns and like, and share so that we feel it is helpful to many and share more patterns...

#aplltd #alembic #cipla #lauruslabs #biocon #granules #lupin #it#APLLTD
NSE:APLLTD
NSE:APLLTD
CMP: 725
Target: 815
SL: 700
RR > 3
TF < 3 months
Factors:
BULLISH WEDGE BREAKOUT
Trend Following
Rising Volume with rising Prices.
Flag pattern breakout.
Pennant Pattern Breakout with Bullish Candle.
Retest Successful.
Higher Highs & Higher Lows.
Broken above RESISTANCE levels
Trading at SUPPORT levels
Earnings are strong.
Bullish Wedge Breakout
Risk Return Ratio is healthy.
And
Rising from Double Bottom Pattern to Flag Pattern forming.
If you like my work KINDLY LIKE SHARE & FOLLOW this page for free Stock Recommendations.
With 💚 from Rachit Sethia

Laurus Labs - April'22Laurus Labs
RSI - 62.85
Looking positive - Above its 50 & 200 Day moving Average
Target - 627.55
Support - 544.80
Buy on Dips
Happy Trading
Like & Follow :)

LAURUSLABS LONG Lauras labs re-testing the resistance.
A good trade to enter if it bounces back from this level. Easy 1:3 R:R.
NOTE :- ONLY GOOD TO ENTER IF IT MAKES A BULLISH CANDLE ON MONDAY.
Trade safe. Manage risk. Be profitable.
Please follow us for more simple trading analysis and setups. Also let me know in the comment in case you have any queries.
Disclaimer :- This is just my view. Please analyze charts yourself and then decide to take any trades.

LauruslabsLauruslabs made inverted head n shoulders on daily charts & broke out of neckline with very good volumes.
Could be bought with mentioned stoploss & targets.

LAURUS LABSLauruslab was consolidating near resistance from the past few trading sessions.
Today if moved decisively above previous resistance, now sustaining 530-520 levels, the stock could move towards 630-649 levels in the coming weeks.
Disclaimer: Not a recommendation to trade.

LAURUSLABS A good candidate for mid term swing. Everything has been explained on the chart, Consider as per your risk apatite.

Lauruslabs in bearish trendIf two close below 475(OR one Day Close with volume) then we may see #LAURUSLABS on 375
Now trading below #200DEMA
475->450->375

Laurus LabsSupport level highlighted in Red 475 & if this is Broken the next support is @ 381 Levels
RSI - Daily Charts - 26 - Note Last time Also we saw a bounce back at the similar level
MACD - Downtrend as on today but we should be some positive sign in the next 1 or 2 days

Laurus Lab -Short term / Safe trader & long term Laurus Labs -
Long term & Short term suggestions
Alerts:
RSI - Daily Charts - downtrend 32
MACD - Down trend
Short term / Safe Traders
As i have given Enter only once its cross the GREEN line - 50 Day Moving Average -
Buy only once it goes Above 668 Levels for a stable uptrend.
Long term
can buy on Dips as its in a down trend
But once its cross the RED line 200 Day Moving average dont buy - thats the final support
Like & Follow :)

Laurus labs - HOLDLaurus - HOLD
waiting to see a reversal
As of now MACD & RSI downtrend
Good support level at 587 & expect to see a bounce back.

LAURUS LABS - Next step?LAURUS LABS - One of my Fav. Stocks :)
Has been underperforming for a while
Pros
Currently MACD is strong uptrend
RSI - 56 which is Good
Right time to buy on Dips if available
Cons
Just Below the 50 Day Moving Average - The Green line as shown
Suggestions
Enter once it crosses the 50 Moving Average around 660 - 678 levels
would be the right levels to enter and we would be able to see 750 levels.
The Stock is in my portfolio and suggest to HOLD for a long term for great Returns
Like & Follow :)
Do let me know incase you want me to post about any other stock in particular
Happy trading :)

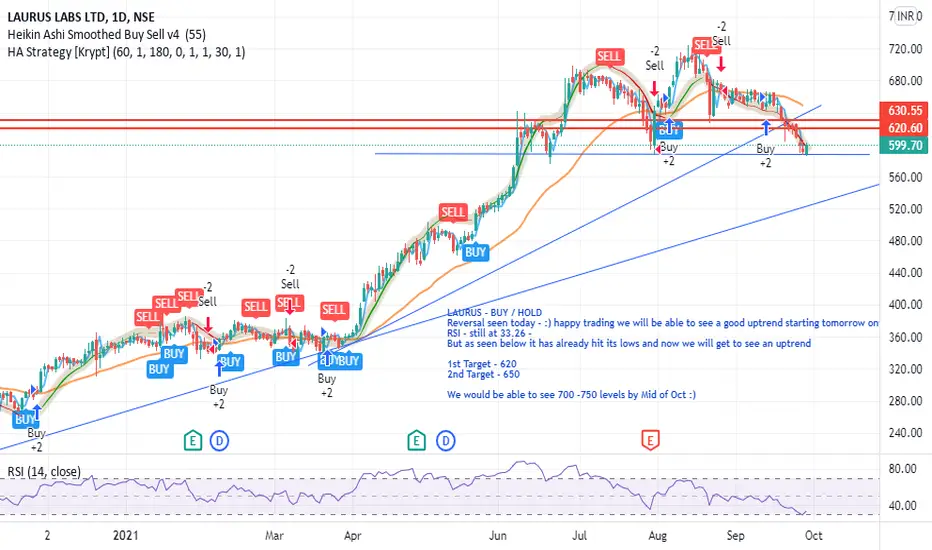
Laurus Labs - BUY / HOLDLAURUS - BUY / HOLD
Reversal seen today - :) happy trading we will be able to see a good uptrend starting tomorrow onwards.
RSI - still at 33.26 -
But as seen below it has already hit its lows and now we will get to see an uptrend
1st Target - 620
2nd Target - 650
We would be able to see 700 -750 levels by Mid of Oct :)
Kindly like and Follow for free tips :)
Laurus Labs - Long term - Don't Miss :)Laurus Labs - Great Buy for Long term will not get it at these levels again :)
You would see great returns in 8 - 12 months
It has just given a Bounce back towards an uptrend now.
Green line - 50 Day MA - its still below that but it would go up in no time :)
Red line is the - 200 day MA
RSI - 41 - Towards an uptrend

Laurus LabsLaurus Labs- HOLD
We will see a downfall
Support @ 632 , Next Level - 622 or 590 Levels
We will see a BOUNCE BACK at any of the above levels
Post which we can see a good uptrend.
Suggest to HOLD and Add on Dips
Currently Weak on MACD - Daily & Weekly Charts
RSI - Weak

laurus lab on bullish if this same trend continues with good market we can expect same big boom
high risk high reward so do your own analysis


Laurus Labs heading to 430, 500 levelsLaurus labs, closed at 374
Looks good on charts and is ready for next Targets of 430 and 500++ soon
ROI 15% & 34%
Have patience, goods things on their way
To manage risk, consult your financial advisor


SELL SELL SELL!!!Every indicator is showing a downward direction. It's time to exit from this stock. Price is struggling to cross the parallel zone. And the MACD is about to cross into -ve. RSI is downwards and for Stochastic RSI, the crossover is happening
let me know your thoughts in the comments section.

