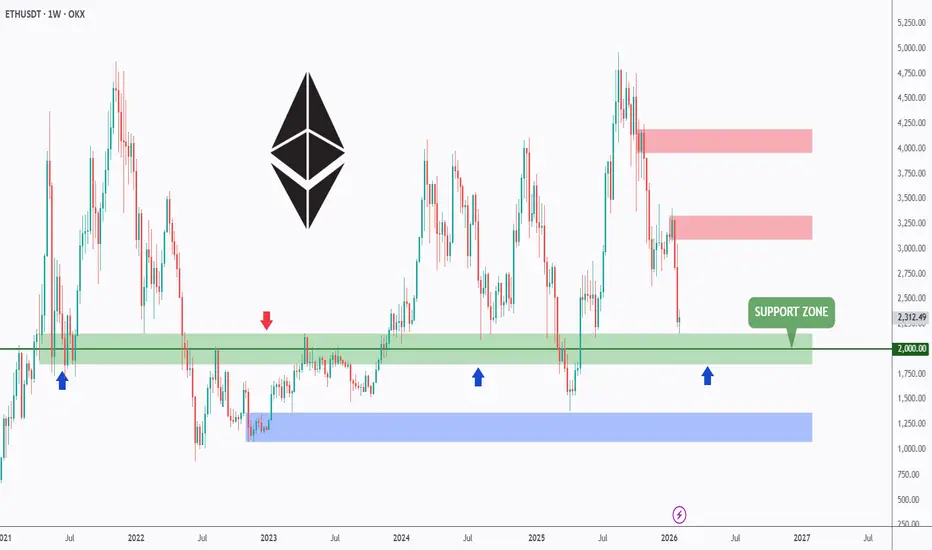
ETH at Big Support: Hold or Break?ETH is now retesting the $2000 support zone, a level that has acted as a major decision point multiple times in the past.
Each time ETH reached this area, the market paused, reacted, and chose its next direction carefully.
From a structure perspective, this is not a random level. It’s a long-term support that previously flipped roles between resistance and support, making it a key battlefield between buyers and sellers.
As long as this support holds, the focus remains on stabilization and potential recovery attempts from this zone.📈
But if this level fails, the door opens for a deeper move toward the lower demand area highlighted below.📉
Will buyers defend it one more time… or is this where the structure finally gives way? 👀
⚠️ Disclaimer: This is not financial advice. Always do your own research and manage risk properly.
📚 Stick to your trading plan regarding entries, risk, and management.
Good luck! 🍀
All Strategies Are Good; If Managed Properly!
~Richard Nasr.
Layer1
SOL - The $100 Level That MattersSOL is now retesting the $100 round number, a level that has acted as strong support for months. Every time SOL reached this zone in the past, buyers stepped in and defended it aggressively.
That makes this area critical.
📈If $100 holds, this level could once again act as a base for stabilization and a potential upside reaction.
📉But if $100 breaks, the picture changes entirely, and SOL risks entering a much deeper bearish phase into 2026.
Will history repeat itself… or will this support finally give way?
⚠️ Disclaimer: This is not financial advice. Always do your own research and manage risk properly.
📚 Stick to your trading plan regarding entries, risk, and management.
Good luck! 🍀
All Strategies Are Good; If Managed Properly!
~Richard Nasr

SOL - The Building Block!I call this area the Building Block, and it’s doing exactly what it’s supposed to do.
Right now, CRYPTOCAP:SOL is trading below the $129 structure, and as long as price stays under this level, the bias remains bearish. No guessing, no forcing it. Structure is structure.
That said, this level is important.
👉 A clean break and hold above $129 would change the picture completely and mark the start of a bullish phase, opening the door for higher prices.
Until that happens, patience is key. Let CRYPTOCAP:SOL prove itself before switching bias.
⚠️ Disclaimer: This is not financial advice. Always do your own research and manage risk properly.
📚 Stick to your trading plan regarding entries, risk, and management.
Good luck! 🍀
All Strategies Are Good; If Managed Properly!
~Richard Nasr

ETH - is it time for a correction?ETH is starting to look over-bought.
Price is currently hovering around a strong intersection between the orange supply zone and the upper red trendlines. This is not just any resistance, it’s a zone where momentum has historically cooled off.
As long as this area holds, a bearish correction is expected, with price likely rotating back toward the lower blue trendlines, where buyers previously stepped in.
This doesn’t change the bigger picture... it’s simply a reset within structure.
⚠️ Disclaimer: This is not financial advice. Always do your own research and manage risk properly.
📚 Stick to your trading plan regarding entries, risk, and management.
Good luck! 🍀
All Strategies Are Good; If Managed Properly!
~Richard Nasr

$ALPH – Long-term range low and historical demand zoneASX:ALPH is trading back at a long-term demand zone that previously marked cycle lows.
This area has historically attracted buyers after extended drawdowns.
Price is still in a broader downtrend, so this is not a trend reversal call!
However, for those who believe in Alephium long term, this region could represent a reasonable accumulation zone.
Patience matters here.
Not financial advice.

ETH - the Calm before the Storm!From a structure point of view, ETH remains bullish, trading cleanly inside a flat rising channel.
The lower bound of the channel continues to act as support, keeping the broader bullish bias intact.
🔑 The key level to watch is the red structure zone.
For the bulls to truly take over and push price toward the upper bound of the channel, we need a clear break and hold above that structure. That’s the trigger that shifts ETH from consolidation into expansion.
Until then, expect chop and buildup... not weakness.
⚠️ Disclaimer: This is not financial advice. Always do your own research and manage risk properly.
📚 Stick to your trading plan regarding entries, risk, and management.
Good luck! 🍀
All Strategies Are Good; If Managed Properly!
~Richard Nasr

ZEC - From Exhaustion to Expansion!!!📉ZEC spent days trapped in a clear bearish phase on the left side of the chart, forming lower lows and lower highs. But everything changed once price tapped the major swing low, where buyers stepped in aggressively.
📈Since then, ZEC has been respecting a new rising channel , shifting the market structure from bearish to bullish. As long as price remains inside this channel, the bulls remain in control.
We will be looking for longs around the intersection of:
- the lower blue trendline, and
- the most recent higher-low zone
🏹This is where buyers have consistently reacted before, and where the next bullish impulse could start.
If this structure holds, ZEC may push toward the upper boundary of the channel once again.
Do you think ZEC is gearing up for another leg up? Let me know below 👇
⚠️ Disclaimer: This is not financial advice. Always do your own research and manage risk properly.
📚 Stick to your trading plan regarding entries, risk, and management.
Good luck! 🍀
All Strategies Are Good; If Managed Properly!
~Richard Nasr

TradeCityPro | HBAR at Critical Support, Bears in Control👋 Welcome to TradeCityPro!
In this analysis, I want to review HBAR, one of the RWA-focused projects, currently ranked 21st on CoinMarketCap with a market cap of $5.71 billion.
🗓 Daily Timeframe
On the daily timeframe, this coin is sitting on a very important support zone.
✔️ There is also a curved descending trendline visible on HBAR, which started forming from the 0.2915 top.
🎲 Every time the price has touched this trendline, bearish momentum has increased.
🎯 Right now, the price is inside this support area, and considering the strong selling pressure in the market, the probability of this zone breaking is high.
💥 The RSI oscillator has also taken a bearish direction after the rejection from 0.2915, spending most of the time below the 50 level, which indicates bearish momentum dominating the market.
💧 If RSI enters the oversold zone, this bearish momentum will intensify even further, increasing the likelihood of a breakdown of support.A break of 0.13055 would be a very strong short trigger.
📊 For long positions, after the descending trendline breaks, we can enter using the 0.15111 trigger.
⚡️ Signs like increasing volume and RSI stabilizing above 50 will act as strong confirmations for a bullish reversal.
📝 Final Thoughts
Stay calm, trade wisely, and let's capture the market's best opportunities!
This analysis reflects our opinions and is not financial advice.
Share your thoughts in the comments, and don’t forget to share this analysis with your friends! ❤️

#LAYER/USDT Forming Falling Wedge#LAYER
The price is moving within an ascending channel on the 1-hour timeframe and is adhering to it well. It is poised to break out strongly and retest the channel.
We have a downtrend line on the RSI indicator that is about to break and retest, which supports the upward move.
There is a key support zone in green at 0.2187, representing a strong support point.
We have a trend of consolidation above the 100-period moving average.
Entry price: 0.2240
First target: 0.2380
Second target: 0.2544
Third target: 0.2753
Don't forget a simple money management rule:
Place your stop-loss order below the green support zone.
Once you reach the first target, save some money and then change your stop-loss order to an entry order.
For any questions, please leave a comment.
Thank you.

TradeCityPro | XRP Shows Potential After Support Bounce👋 Welcome to TradeCity Pro!
Let’s dive into the XRP coin analysis. It’s one of the oldest crypto projects, with a market cap of $136.74 billion, currently ranked 4th on CoinMarketCap.
⏳ 4-Hour Timeframe
On the 4-hour timeframe, this coin is sitting on a very important support level at 2.1843.
✔️ This level can also be viewed as a support zone. Currently, the price has shown a reaction to this zone and is moving upwards with very low volume.
⚡️ The first resistance zone for XRP is at 2.3404. Considering the low buying volume in the recent candles, the probability of a continued bullish move is higher unless the buying volume increases.
📊 If the buying volume starts to increase, we can use the 2.3404 level as a trigger for a long position. The next significant resistance levels for this coin are 2.5508 and 2.6718.
🔔 However, if the volume remains this low, a break below the 2.1843 support could trigger a short position. The next support zone for XRP is at 2.0013.
🛒 For spot purchases or confirmation of a new bullish trend, the trigger we currently have is 2.6718. Personally, for spot buying, I will track this coin after the 2.6718 level.
📝 Final Thoughts
Stay calm, trade wisely, and let's capture the market's best opportunities!
This analysis reflects our opinions and is not financial advice.
Share your thoughts in the comments, and don’t forget to share this analysis with your friends! ❤️

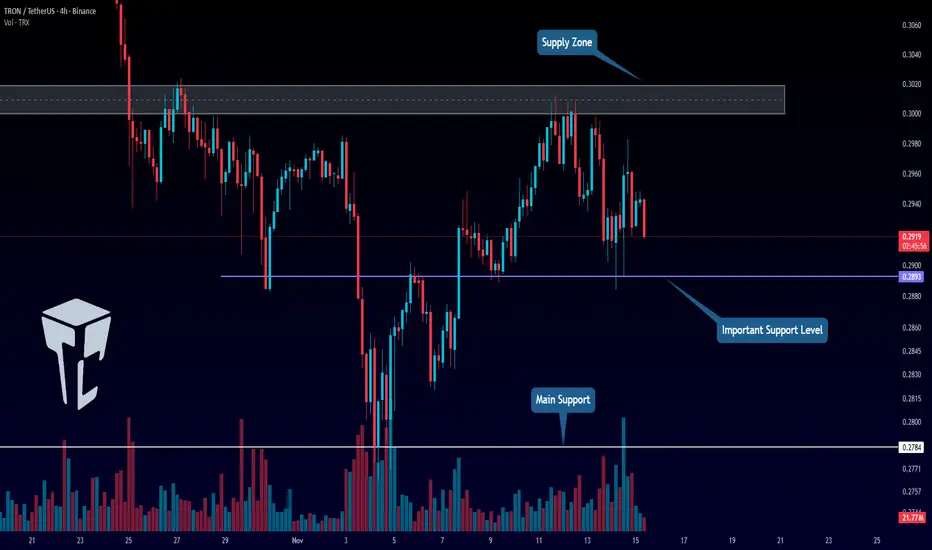
TradeCityPro | TRX Pressured at Key Breakdown Level👋 Welcome to TradeCityPro!
In this analysis, I want to review the TRX coin, one of the oldest projects in the crypto space, with a market cap of $27.65 billion, currently ranked 8th on CoinMarketCap.
⏳ 4-Hour Timeframe
On this timeframe, as you can see, TRX is facing a very strong resistance zone, from which it has recently been rejected and has started a minor correction.
⭐ The support level currently holding this coin is at 0.2893, and during this correction phase, the price has already tested this level several times with long wicks.
✔️ At the moment, the price is hovering close to this support zone.Breaking below 0.2893 could serve as a solid short trigger.
🎲 The next support zone, if 0.2893 breaks, is around 0.2784, which can be used as the target for the short position.
💥 For long positions, the current trigger is the breakout of the resistance zone. A successful breakout above this area could mark the start of a new bullish trend for TRX.
📝 Final Thoughts
Stay calm, trade wisely, and let's capture the market's best opportunities!
This analysis reflects our opinions and is not financial advice.
Share your thoughts in the comments, and don’t forget to share this analysis with your friends! ❤️
SOL - Enough is Enough!📉After weeks of selling pressure , SOL is finally approaching a massive confluence zone around the $150 round number, which aligns perfectly with a strong weekly support area highlighted in blue.
⚔️This level has historically acted as a major pivot zone , and as long as SOL holds above it, I’ll be looking for short-term long opportunities, targeting the upper bound of the falling red channel.
🏹However, for the bulls to fully take control, SOL must break above the last major high marked in red, confirming a shift from correction to continuation.
Could this be the point where Solana says - Enough is enough? 👀
⚠️ Disclaimer: This is not financial advice. Always do your own research and manage risk properly.
📊All Strategies Are Good; If Managed Properly!
~Richard Nasr

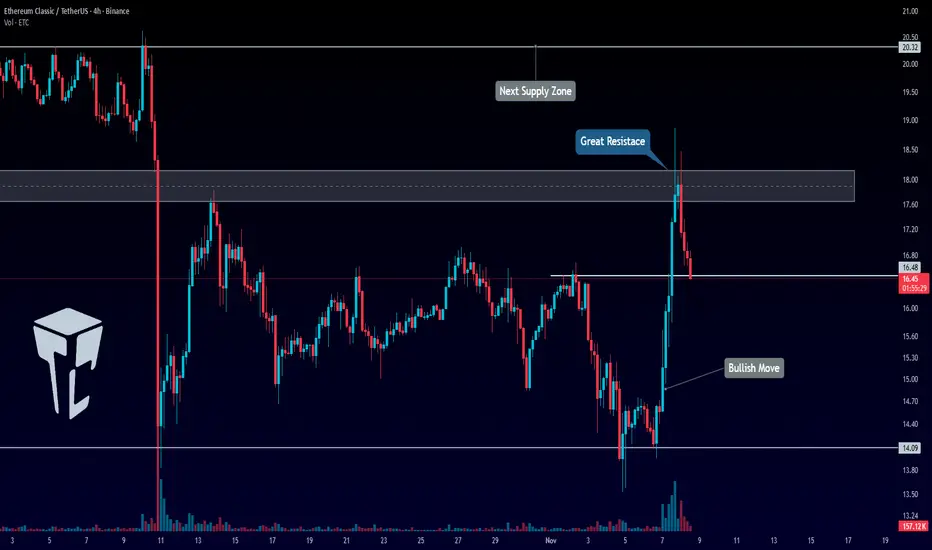
TradeCityPro | ETC: Key Levels and Trend Analysis👋 Welcome to TradeCity Pro!
In this analysis, I want to review the ETC coin—one of the Layer 1 projects with a market cap of $2.57 billion, currently ranked 39th on CoinMarketCap.
⏳ 4-Hour Timeframe
On the 4-hour timeframe, this coin made an upward move after being supported at the 14.09 level and was able to reach around the $18 zone.
✅ Currently, the price has had a minor correction, dropping to near the 16.48 level.
🎲 If the 18$ level is broken, the continuation of the move will begin, and we can use this as a trigger for a long position.
✨ If the correction continues and the 16.48 level is broken, the price could undergo deeper corrections.
📊 Currently, the volume is in favor of the buyers, and the volume has been decreasing during the correction. Therefore, if the price moves towards the 18$ zone with increasing volume, we can open a long position.
⭐ The main confirmation for a bullish trend on this coin will be breaking the 18$ zone and setting a higher high and low beyond this level. The next resistance level for the price is at 20.32$.
📝 Final Thoughts
Stay calm, trade wisely, and let's capture the market's best opportunities!
This analysis reflects our opinions and is not financial advice.
Share your thoughts in the comments, and don’t forget to share this analysis with your friends! ❤️
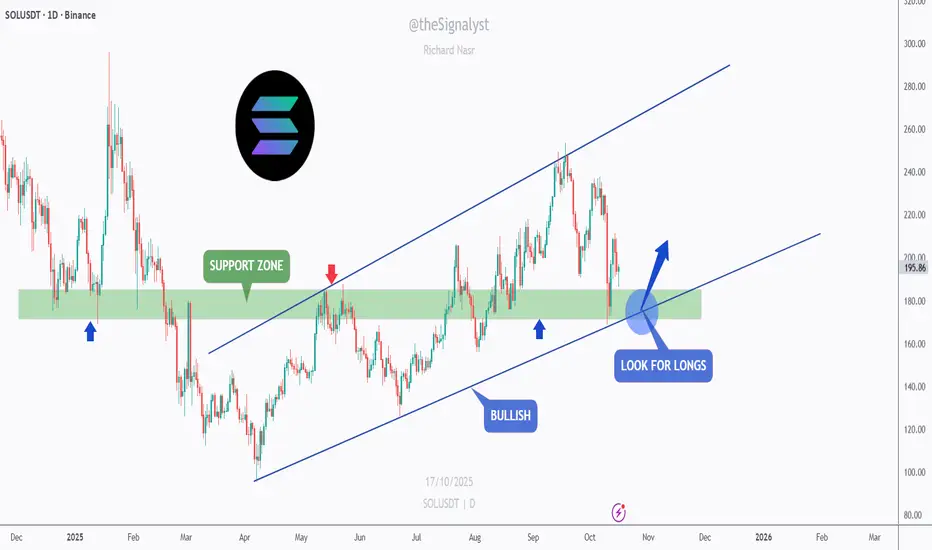
SOL - Buying the Retest Like a Sniper!SOL remains overall bullish , trading within a clean ascending channel and currently retesting the support zone that has acted as both resistance and support in the past.
This zone also aligns perfectly with the lower blue trendline, creating a strong area of confluence.
As long as this intersection holds, SOL is likely to rebound from here. I’ll be looking for bullish rejections or reversal patterns around the current zone to enter long positions, aiming for the next resistance levels near $230 and $260.
However, if the price breaks below the support zone, we could see a deeper correction before buyers regain control.
⚠️ Disclaimer: This is not financial advice. Always do your own research and manage risk properly.
📚 Stick to your trading plan regarding entries, risk, and management.
Good luck! 🍀
All Strategies Are Good; If Managed Properly!
~Richard Nasr
TradeCityPro | SOL: Market Calms After Sharp Move & RSI Support👋 Welcome to TradeCityPro!
Let’s analyze SOL, one of the most popular Ethereum killers with a market cap of $99.9 billion, currently ranking 6th on CoinMarketCap.
⏳ 4-Hour Timeframe
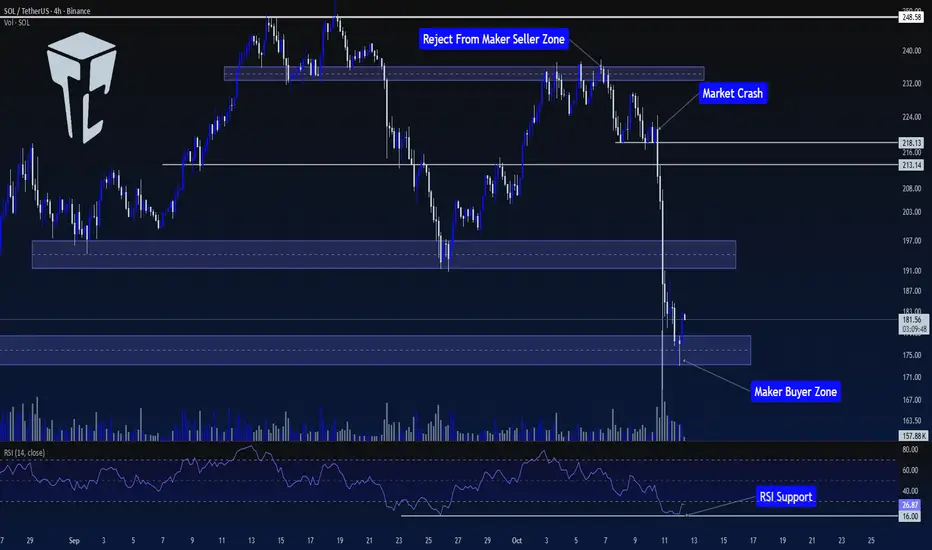
In the previous analysis, we had a Maker Buyer zone around $235. In that analysis, I mentioned that breaking this zone would be an early trigger for breaking $248.58.
🔍 However, the price never managed to sustain above this level, and after getting rejected from this zone, the price entered a corrective phase, forming a support at $218.13.
📊 After the price bounced from $218.13 for the first time, it failed to set a new high in line with previous highs and instead formed a lower high. The price returned to $218.13 again.
✔️ With the breakout of this level, coinciding with news between China and the U.S., the price started a sharp downward move, breaking through the $213.14 support.
✨ Over the course of 2-3 candles, SOL made a sharp move towards the first Maker Buyer zone, breaking it and reaching the second Maker Buyer zone.
💫 Naturally, there was a significant increase in selling volume during this move, and RSI dropped to 16, where it found support.
🧩 Currently, the market seems to have calmed down, with RSI still in the Oversell zone, but volatility has significantly decreased.
💡 Although the market has calmed, I believe the price needs to build a more structured setup before finding valid triggers, and the market conditions are not ideal for opening positions right now.
💥 So, for now, I won’t provide any triggers on this coin and will wait for more structure to form before making a better decision to open a position.
📝 Final Thoughts
Stay calm, trade wisely, and let's capture the market's best opportunities!
This analysis reflects our opinions and is not financial advice.
Share your thoughts in the comments, and don’t forget to share this analysis with your friends! ❤️
TradeCityPro | NEAR: Breakout Opportunity and Potential Uptrend👋 Welcome to TradeCity Pro!
In this analysis, I’ll review NEAR, one of the Layer 1 and AI crypto projects, with a market cap of $3.9 billion, currently ranked 35th on CoinMarketCap.
⏳ 4-Hour Timeframe
This coin is showing an upward trend against Bitcoin and is currently in a very important resistance zone.
✨ Since being supported at the $2.589 level, the price has reacted multiple times to this zone, and it has formed a higher low at $2.832.
📊 At present, the price is engaged with a supply zone, which it has encountered several times, and is now reaching it again with increased buying volume.
🎲 Breaking this resistance zone will initiate a new upward move for this coin. The main trigger for confirming this move is a break at $3.211.
✔️ We can use the $3.211 break as a trigger for a long position on this coin. Additionally, if the RSI enters Overbuy, the upward movement could become much sharper and more volatile.
📝 Final Thoughts
Stay calm, trade wisely, and let's capture the market's best opportunities!
This analysis reflects our opinions and is not financial advice.
Share your thoughts in the comments, and don’t forget to share this analysis with your friends! ❤️

TradeCityPro | AVAX: Testing Key Support and Resistance Zones👋 Welcome to TradeCity Pro!
In this analysis, I will review AVAX, one of the Layer 1 and RWA coins with a market cap of $11.98 billion, ranked 16th on CoinMarketCap.
⏳ 4-Hour Timeframe
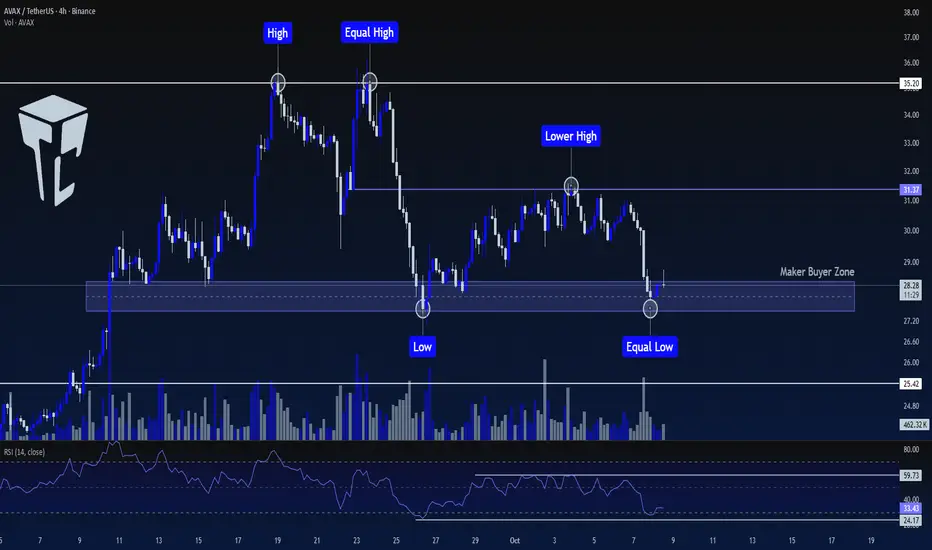
On the 4-hour timeframe, AVAX has a strong Maker Buyer zone that has been tested multiple times and provided support.
⭐ On the other hand, after creating two equal peaks at 35.20, the next peak was lower, at 31.37.
✅ This indicates that the sellers' strength in the market is greater than the buyers' strength, but buyers also have a significant support level, which has been effective so far in preventing further price decline.
🧩 Since Bitcoin's trend is entirely bullish, and there’s a high chance of Bitcoin's dominance decreasing, altcoins may experience an upward move. So, I am inclined to open a long position on this coin.
📊 The first trigger for a long position is the break of 31.37. The main trigger to start the coin's primary trend will be 35.20.
💥 If you believe the market will move downward and are looking for a short position, breaking the support level I marked could lead to a price decline towards 25.42.
📝 Final Thoughts
Stay calm, trade wisely, and let's capture the market's best opportunities!
This analysis reflects our opinions and is not financial advice.
Share your thoughts in the comments, and don’t forget to share this analysis with your friends! ❤️
L1XUSD - Large WicksA relatively new altcoin that is looking to rocket upwards.
Seeing wicks like this is in my experience a very bullish sign.
Plotting the upper two with a trend line may reveal possible targets for a bull run.
Weekly chart

TradeCityPro | SUI: Approaching Key Breakout From Channel👋 Welcome to TradeCity Pro!
In this analysis, I want to review the SUI coin for you, one of the coins that gained significant attention in 2024 and currently ranks 14th on CoinMarketCap with a market cap of $13.22 billion.
📅 Daily Timeframe
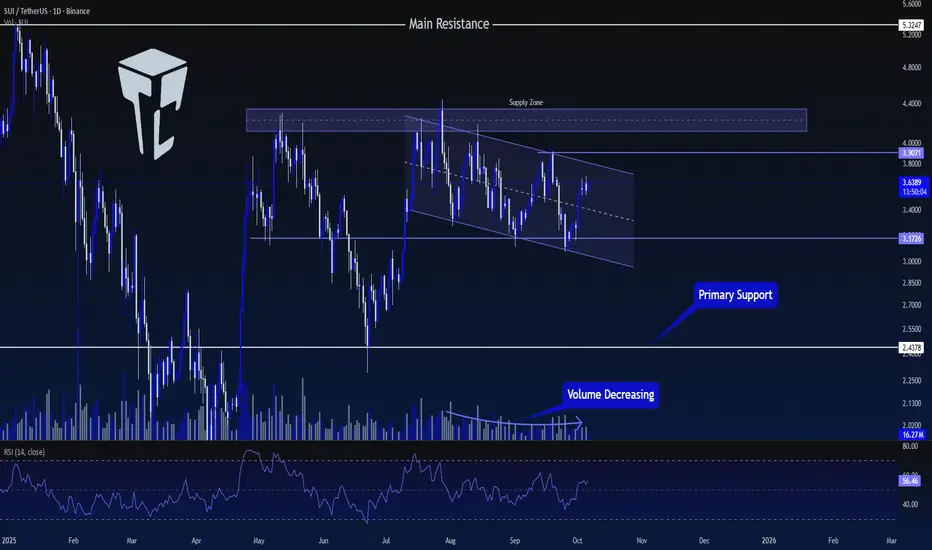
On the daily timeframe, this coin has formed a supply zone near $4, and for the past few months, the price has been struggling with it.
⭐ At the moment, after the latest rejection from this zone, a descending channel has formed, guiding the price slowly downward.
✅ The support level that the price has recently built is 3.1726, which has been tested twice, and now the price is moving toward the top of the channel.
🎲 If the channel breaks to the upside, we can consider opening a long position. The main bullish confirmation will come after breaking the upper resistance zone, but an early long position can be opened upon the breakout of 3.9071.
🔍 If the downward movement resumes and 3.1726 breaks, the move could extend to the next support area at 2.4378.
📝 Final Thoughts
Stay calm, trade wisely, and let's capture the market's best opportunities!
This analysis reflects our opinions and is not financial advice.
Share your thoughts in the comments, and don’t forget to share this analysis with your friends! ❤️
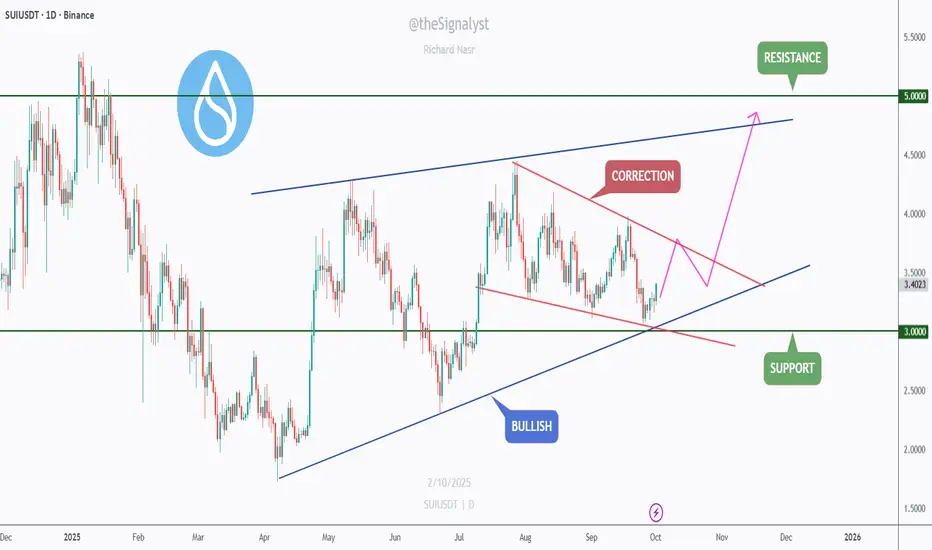
$SUI - Correction within an Uptrend: Eyes on $3.0 → $5.0SUI is respecting a broader rising structure while carving a descending correction (red channel/wedge) on the daily.
Price just bounced from the trendline + $3.00 support, a clean confluence area where bulls typically reload.
Trend context: Macro higher-lows intact (bullish). Micro still corrective until the wedge breaks.
Key levels
Support: $3.00 (structure + rising trendline)
Resistance: $3.55–$3.60 (wedge cap / first hurdle), then $5.00 (major ceiling)
Confluence 🔑
Rising blue trendline + horizontal $3.00 + corrective wedge = high-interest decision zone.
Scenarios
Bullish 📈Hold $3.00 and break above $3.55–$3.60 → momentum extension toward $4.20–$4.50, then the $5.00 range high.
Bearish 📉Daily close below $3.00 → risk of a deeper pullback before the uptrend resumes.
Do you think SUI clears the wedge on this attempt, or does it need one more higher-low above $3 first? 🤔
⚠️ Disclaimer: This is not financial advice. Always do your own research and manage risk properly.
📚 Stick to your trading plan regarding entries, risk, and management.
Good luck! 🍀
All Strategies Are Good; If Managed Properly!
~Richard Nasr
ETH – Bulls Eyeing the Next Push!ETH has been showing strength after reclaiming the $4,000 psychological level and breaking back above structure. Price is now trading inside a rising channel, keeping the overall outlook bullish in the short term.
At the moment, ETH is hovering around the $4,040–$4,000 support area. This zone aligns with the lower red trendline of the channel, creating a strong confluence for potential bullish continuation.
As long as ETH holds above this zone, I’ll be looking for long opportunities with the next impulse higher in mind. If broken downward, however, we could see a deeper correction before the bulls step back in.
The key level to watch remains $4,000 . Stay above = bullish bias intact. Break below = caution for further downside.
Do you think ETH will maintain its momentum above $4,000, or will the bears step in for another retest lower? 🤔
⚠️ Disclaimer: This is not financial advice. Always do your own research and manage risk properly.
📚 Stick to your trading plan regarding entries, risk, and management.
Good luck! 🍀
All Strategies Are Good; If Managed Properly!
~Richard Nasr

Concordium payments infrastructure adoption will launch $CCDThe previous CCD idea played out nicely. Now it's time for real performance.
Ultimate goal: 1CCD = 1USD (x50).
New set-up
End of Q3 2025, the CCD chart has proven heartbeat with signs of volume and decisive price action.
New targets are mapped in the chart as Private Presale (PP) levels.
Expectation: at least a reclaim of these levels based on strong fundamentals.
Fundamentals supportive of case
💳 PayFi and stablecoin narratives are focal for the next level of crypto market growth and adoption
🌐 Outstanding new management team with deep industry connections
💱 >10 stablecoin issuers confirmed to launch on Concordium: transactions and TVL will grow tremendously
🤝 >20 partnerships secured in the last 4 months
📈 Hilbert Capital (NASDAQ-listed) confirmed CCD as a strategic investment, next to CRYPTOCAP:ETH and CRYPTOCAP:BTC
🔧 Q4 2025 protocol upgrade unlocks unique features for institutional adoption in blockchain payments:
1) Programmable stablecoins without smart contract risk
2) Geofenced & age-gated payments (via ID/KYC)
3) Concordium ID: portable KYC across platforms, integrated with payment programmability

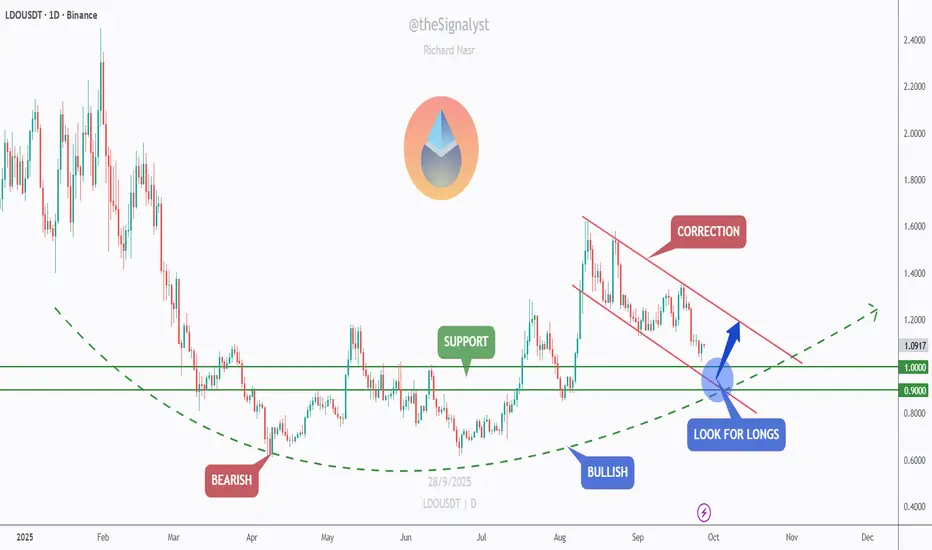
LDO – Waiting at the $1 ConfluenceLDO is overall bullish and currently in a correction phase inside a falling red channel. I’m waiting for price to reach the confluence of the support zone + round number $1.00 + lower red trendline. That intersection is where I’ll look for longs if we get a clear bullish reaction.
If we bounce: first targets $1.15–$1.20, then $1.30–$1.40 (channel top). A clean break/retest above $1.10 would add confirmation.
Invalidation: a daily close below $0.90 would put the setup on hold.
Does the $1 confluence hold and kick off the next leg up? 🤔
⚠️ Disclaimer: This is not financial advice. Always do your own research and manage risk properly.
📚 Stick to your trading plan regarding entries, risk, and management.
Good luck! 🍀
All Strategies Are Good; If Managed Properly!
~Richard Nasr