LAYERUSDT Forming Falling WedgeLAYERUSDT is forming a clear falling wedge pattern, a classic bullish reversal signal that often indicates an upcoming breakout. The price has been consolidating within a narrowing range, suggesting that selling pressure is weakening while buyers are beginning to regain control. With consistent volume confirming accumulation at lower levels, the setup hints at a potential bullish breakout soon. The projected move could lead to an impressive gain of around 140% to 150% once the price breaks above the wedge resistance.
This falling wedge pattern is typically seen at the end of downtrends or corrective phases, and it represents a potential shift in market sentiment from bearish to bullish. Traders closely watching LAYERUSDT are noting the strengthening momentum as it nears a breakout zone. The good trading volume adds confidence to this pattern, showing that market participants are positioning early in anticipation of a reversal.
Investors’ growing interest in LAYERUSDT reflects rising confidence in the project’s long-term fundamentals and current technical strength. If the breakout confirms with sustained volume, this could mark the start of a fresh bullish leg. Traders might find this a valuable setup for medium-term gains, especially as the wedge pattern completes and buying momentum accelerates.
✅ Show your support by hitting the like button and
✅ Leaving a comment below! (What is your opinion about this Coin?)
Your feedback and engagement keep me inspired to share more insightful market analysis with you!
LAYERUSDT

LAYER Update🚨📊 LAYER Update
LAYER has just broken out above the red resistance zone 🔴🚀
with strong, big bullish candles, showing powerful buyer momentum.
With this clean breakout,
LAYER could continue moving up toward the green line targets 🟩🎯
as long as price holds above the old resistance (now turned support).
Key points:
🔴 Red resistance broken
🚀 Strong bullish breakout candles
🟩 Next targets = green line levels
Support flip increases bullish continuation chances

LAYERUSDT Forming Falling WedgeLAYERUSDT is forming a clear falling wedge pattern on the daily chart, a classic bullish reversal signal that often indicates an upcoming breakout in the high-performance Solana ecosystem of late 2025. The price has been consolidating within a narrowing range around $0.23, suggesting that selling pressure is weakening while buyers are beginning to regain control through higher lows amid the recent 37% surge from oversold depths. With good trading volume exploding to over $288 million in the last 24 hours—dominated by Binance's LAYER/USDT pair—the setup hints at a potential bullish breakout soon, especially as RSI rebounds from oversold territory near 40 and the wedge nears its apex. The projected move could lead to an impressive gain of 60% to 70%+ once the price breaks above the wedge resistance near $0.27, targeting levels up to $0.39 in the near-term rally.
This falling wedge pattern is typically seen at the end of downtrends or corrective phases, and it represents a potential shift in market sentiment from bearish to bullish as LAYERUSDT stabilizes post its October lows at $0.085. Traders closely watching LAYERUSDT are noting the strengthening momentum from Solayer's InfiniSVM architecture, which leverages RDMA and InfiniBand for 1MM+ TPS and near-zero latency, fueling real traction in decentralized high-frequency trading. The good trading volume adds confidence to this pattern, showing that market participants are positioning early in anticipation of a reversal, with open interest spiking 60% and over 1.8 million trades signaling whale accumulation.
Investors’ growing interest in LAYERUSDT reflects rising confidence in the project’s long-term fundamentals, like the hardware-accelerated network's multi-execution model and integrations targeting $79 million market cap growth. If the breakout confirms with sustained volume, this could mark the start of a fresh bullish leg, amplified by predictions eyeing $3+ highs in 2025's scaling boom. Traders might find this a valuable setup for medium-term gains, especially as the wedge pattern completes and buying momentum accelerates toward $0.50+ in the Solana DeFi surge.
✅ Show your support by hitting the like button and ✅ Leaving a comment below! (What is You opinion about this Coin) Your feedback and engagement keep me inspired to share more insightful market analysis with you!

#LAYER/USDT Forming Falling Wedge#LAYER
The price is moving within an ascending channel on the 1-hour timeframe and is adhering to it well. It is poised to break out strongly and retest the channel.
We have a downtrend line on the RSI indicator that is about to break and retest, which supports the upward move.
There is a key support zone in green at 0.2187, representing a strong support point.
We have a trend of consolidation above the 100-period moving average.
Entry price: 0.2240
First target: 0.2380
Second target: 0.2544
Third target: 0.2753
Don't forget a simple money management rule:
Place your stop-loss order below the green support zone.
Once you reach the first target, save some money and then change your stop-loss order to an entry order.
For any questions, please leave a comment.
Thank you.

LAYERUSDT Forming Falling WedgeLAYERUSDT is forming a clear falling wedge pattern on the daily chart, a classic bullish reversal signal that often indicates an upcoming breakout in the high-performance Solana ecosystem of late 2025. The price has been consolidating within a narrowing range around $0.23, suggesting that selling pressure is weakening while buyers are beginning to regain control through higher lows amid the recent 37% surge from oversold depths. With good trading volume exploding to over $288 million in the last 24 hours—dominated by Binance's LAYER/USDT pair—the setup hints at a potential bullish breakout soon, especially as RSI rebounds from oversold territory near 40 and the wedge nears its apex. The projected move could lead to an impressive gain of 60% to 70%+ once the price breaks above the wedge resistance near $0.27, targeting levels up to $0.39 in the near-term rally.
This falling wedge pattern is typically seen at the end of downtrends or corrective phases, and it represents a potential shift in market sentiment from bearish to bullish as LAYERUSDT stabilizes post its October lows at $0.085. Traders closely watching LAYERUSDT are noting the strengthening momentum from Solayer's InfiniSVM architecture, which leverages RDMA and InfiniBand for 1MM+ TPS and near-zero latency, fueling real traction in decentralized high-frequency trading. The good trading volume adds confidence to this pattern, showing that market participants are positioning early in anticipation of a reversal, with open interest spiking 60% and over 1.8 million trades signaling whale accumulation.
Investors’ growing interest in LAYERUSDT reflects rising confidence in the project’s long-term fundamentals, like the hardware-accelerated network's multi-execution model and integrations targeting $79 million market cap growth. If the breakout confirms with sustained volume, this could mark the start of a fresh bullish leg, amplified by predictions eyeing $3+ highs in 2025's scaling boom. Traders might find this a valuable setup for medium-term gains, especially as the wedge pattern completes and buying momentum accelerates toward $0.50+ in the Solana DeFi surge.
✅ Show your support by hitting the like button and ✅ Leaving a comment below! (What is You opinion about this Coin) Your feedback and engagement keep me inspired to share more insightful market analysis with you!

Solayer, Big Rewards For The Patient, 630% Target ExposedYou could say that this is not an easy one because of Bitcoin's current situation. When Bitcoin is shaky, doubtful, the entire market becomes doubtful and hard to approach, but still, we buy the bottom/support and sell when prices are up.
Solayer produced an uncharacteristic rise previously, it can always repeat a strange behavior, it can detach from the market and move in its own way. There are always pairs that can do anything and do move strangely but also, market conditions can be something today and something different the next day. We shouldn't ignore a good opportunity based on assumptions or something that is not confirmed.
Solayer produced a double-bottom and the volume is good now with the current bounce.
There is also an ending diagonal (blue), which is a reversal pattern.
Say the short-term goes awry and Solayer continues lower, it hits a lower low; how long is it going to take for a reversal to happen? Once we hit bottom, if the bottom is not hit it isn't likely to be far away.
Say things go very bad and we get another low; how long will it take, two months?
That's the beauty of Cryptocurrency trading. Say it does go bad and instead of a reversal we get lower and it takes two months for prices to go up. Guess what? Profits potential would still go beyond 200% within 3 months. That's pretty good for sure no matter how you slice it, think long-term.
On the other hand, one can easy hit the first target for 130% or more within one month, short-term. If it doesn't work, try again, but you can't go wrong if you buy and wait. Notice the difference between current price and the all-time high... It is a nice chart setup, a nice trading opportunity; easy money, depending on your strategy, your thinking, your mindset.
If you are in too much a hurry, ok, you can secure a loss. If you have patience, you can end up with another win in the coming months. It is a great situation. Get ten like these and you set up yourself for success in the short-term. Once your targets hit, can take 3 months or 3 days, find a new set of charts. New opportunities are available every single day.
Take the time to take action. Take the time to choose; choose wisely, and the market will reward you with tons of profits; Crypto is here to stay.
Thank you for reading.
Your support is appreciated.
Namaste.

Solayer 144% —The Fed Will Lower Interest Rates June 2025Endless opportunities this market has to offer. Even the same opportunity turns up over and over, again and again. If you missed it once, you can comeback and the market will opens its door for you to trade.
Easy win, easy buy, easy profits, easy hold, easy trade.
Solayer went even lower and matched the early March 2025 low prices. It can continue even lower before reversing so watch-out. It can also start moving right away. The trick is to buy and hold, not worrying about the short-term.
If the market wants to move lower, that's ok, we wait. If it moves higher, we have a win (green), this is also good, we wait for our target to hit to sell. You can use the target on the chart or you can aim higher is up to you.
If prices move lower, you can use a stop-loss or quit at a loss. No bueno.
If the market moves lower, it will recover because we are bullish now-long-term.
If the market was bearish, the overall market and cycle, then we wouldn't be talking about holding and long-term growth, we would be talking about taking profits and going home.
The Fed will lower interest rates later this month. This will create a major boom; Crypto is going up. You can more than double your capital with this pair. Endless opportunities the Cryptocurrency market has to offer.
Thank you for reading.
Namaste.

Got Correction? Solayer Buy Opportunity (PP: ~600%)A correction is not the end. Remember, when prices drop in a bull market this truly becomes a buy opportunity...
Good evening my fellow Cryptocurrency trader, I hope you are having a very nice day.
Here LAYERUSDT went through a strong correction, a fast correction but that does not matter, it is actually good news because prices are back to baseline and low prices means a new opportunity to trade.
Prices are back to the level visited in mid-March and the correction was more than 70% strong. What does this means? This means that the correction is over and there is room for a new wave of growth.
We have a volume breakout and support is found at a higher low.
Keeping it simple, Solayer is ready to grow.
Namaste.

$LAYER Short-term OutlookBINANCE:LAYERUSDT | 6h
Showing signs of recovery after the sharp drop.
Key support: $0.90–$1 — needs to hold this zone
Immediate resistance: $1.26 — a break above could trigger a move to $1.60 to $2 (short-term target)
If $1 holds, short-term upside remains likely

$LAYER - Long Trade IdeaBINANCE:LAYERUSDT | 4h
Momentum’s turning, not a bad spot to punt a long. Who knows, they will send it to Valhalla
Key levels for potential targets:
tp1 - 1.20 to 1.35
tp2 - 1.60 to 1.90
tp3 - 2 to 2.20

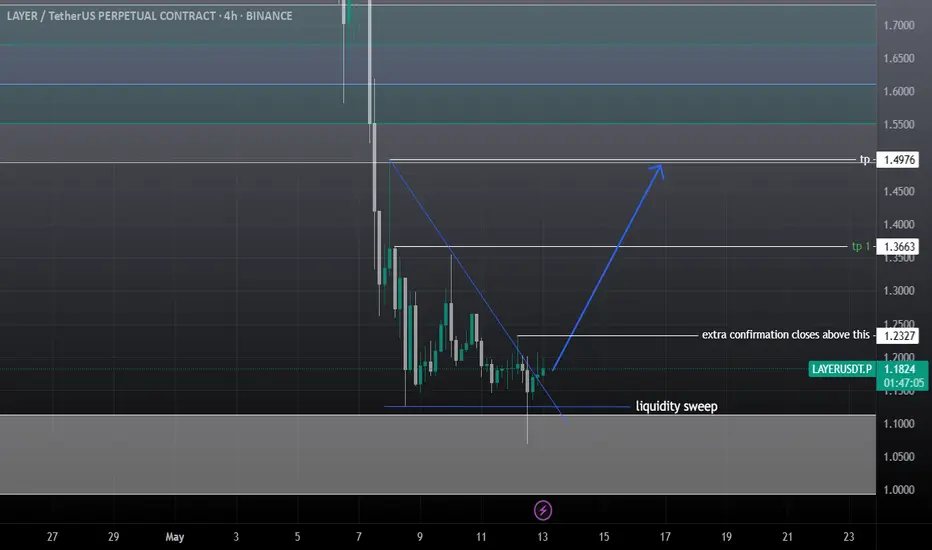
Layer, SOl Layer swing tradeAs 1 day & 4hrs candle failed to close below the previous one, it's following the liquidation sweep model, expectations are high that it will hit daily fvg at least 1.49$ manage your risk, the gray box is 1 day Bullish order Block, If btc hold the ground it will pump more.
Be careful with LAYER (8H)A key trendline on the LAYER chart has been lost.
Due to this break in structure, the price may gradually move toward the identified targets.
Additionally, there is a bearish CH (Change of Character) on the chart.
The targets are clearly marked.
A daily candle closing above the invalidation level will invalidate this analysis.
Do not enter the position without capital management and stop setting
Comment if you have any questions
thank you

Broke out of the rising wedge but...LAYERUSDT has formed higher highs and higher lows inside of the a rising wedge it created recently. Howerver, during the last trading session , price seems to have consolidated at the last low creating an extra confirmation at this level as support.
My SL is 1.7765 and TP is 1.26

$LAYER to $2.50?$LAYER | 1h
Solayer price is now trading above its value area high. It could establish a new value area here if we hold the poc or $2
Added measurements for potential tail imbalance profile trade setup, with possible target of $2.30 to $2.50 if Bitcoin can hold the 84k support

$LAYER — Potential Squeeze to $2.20Despite a weak market and a major token unlock, $LAYER is showing a green candle.
Solayer’s $LAYER demonstrates impressive relative strength amid tariff-driven selloffs.
It’s currently in price discovery, with $2 acting as local resistance.
If CRYPTOCAP:BTC breaks above 85k resistance, $LAYER could squeeze up to $2.20. Watching its CVD, which could retest its range high.

Trading opportunity for LAYERUSDTBased on technical factors there is a Sell position in :
📊 LAYERUSDT
🔴 Sell Now
🪫Stop loss 1.6090
🔋Target 1.0666
📏 R/R 1,5
💸RISK : 1%
We hope it is profitable for you ❤️
Please support our activity with your likes👍 and comments📝

#LAYERUSDT setup remains active 📉 LONG MEXC:LAYERUSDT.P from $1.5722
🛡 Stop loss: $1.5440
🕒 Timeframe: 1H
✅ Market Overview:
➡️ The coin is showing "its own game" — price action is independent of #BTC and #ETH, reacting to internal volume dynamics.
➡️ Ascending triangle breakout with a confirmed close above the key $1.5440 zone.
➡️ Empty space ahead — no major resistance levels until $1.6060–$1.6210.
➡️ Accumulation is forming between $1.5440–$1.5700 — a breakout may follow.
➡️ Important: candles must close above $1.5440 to confirm the long scenario.
🎯 TP Targets:
💎 TP1: $1.5880
💎 TP2: $1.6060
💎 TP3: $1.6210 (full measured move from triangle pattern)
📢 Recommendations:
If volume MEXC:LAYERUSDT.P increases during a breakout above $1.5722 — expect a rapid move.
If price pulls back — the $1.5254 area could offer a second entry opportunity.
The coin looks strong but slightly overbought — partial take profit at TP1 is advised.
📢 A strong breakout above $1.5700 may lead to a sharp move due to lack of resistance.
📢 Avoid 1H candle close below $1.5440 — scenario invalidation.
📢 If the move occurs on weak volume — watch for a potential reversal near TP1.
🚀 MEXC:LAYERUSDT.P setup remains active — holding the key level could lead to a move toward TP2–TP3!

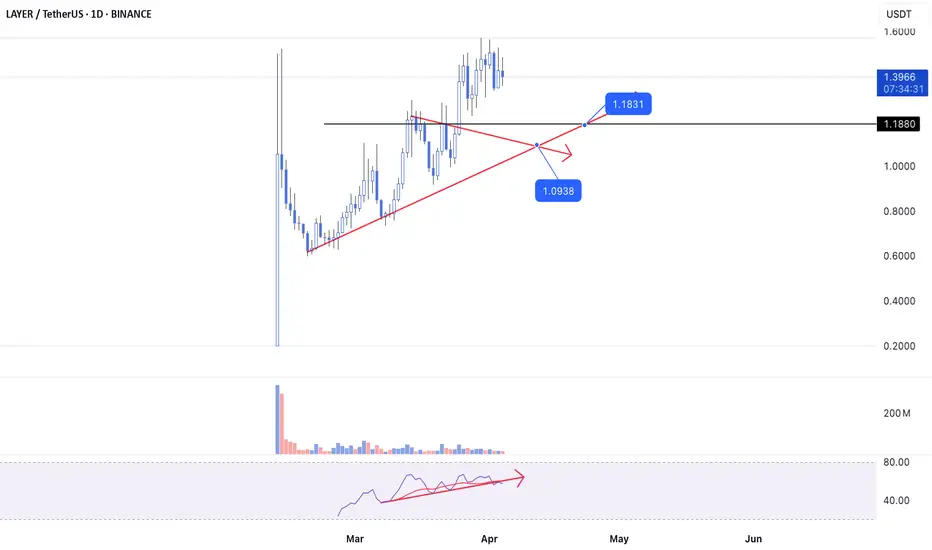
Layer - ShortDear my friends,
I’m observing the Layer chart on larger timeframes. And when switching to the daily timeframe, my perspective becomes quite clear. With the RSI having dropped below support along with a divergence between price and RSI, I’m seeing two support zones that the Layer price might return to: $1.18 or $1.09. I’ll short here and wait for the price to move to these two zones before making my next decision.
Best Regards,
$LAYER could shoot up to $2 to $2.50Solayer (LAYER) is standing out strongly, forming a series of higher lows while maintaining its parabolic curve.
Among the altcoins, LAYER has been one that is consistently trending upward, as is evident in its chart.
$1.60 appears to be the immediate hurdle, acting as resistance. I expect a massive breakout if we can manage to surpass this level.
Alternatively, if we can stay above $1.20, might pave the way up to $2, potentially extending as high as $2.50 (short term)

LAYERUSDT – Patience Wins the Trade📌 Green Box = Key Support Zone – This is where smart money might step in.
🚨 No Need to Rush Shorts!
Waiting for Price to Reach the Target → Jumping in too early is gambling, not trading.
LTF Confirmations are Everything → If we see a reaction + CDV confirmation, then we evaluate.
Break Below? → If price slices through support without demand, we shift the plan.
📊 Discipline beats impulse. Most lose money chasing trades—we wait, we execute, we profit.
✅I keep my charts clean and simple because I believe clarity leads to better decisions.
✅My approach is built on years of experience and a solid track record. I don’t claim to know it all but I’m confident in my ability to spot high-probability setups.
✅If you would like to learn how to use the heatmap, cumulative volume delta and volume footprint techniques that I use below to determine very accurate demand regions, you can send me a private message. I help anyone who wants it completely free of charge.
🔑I have a long list of my proven technique below:
🎯 ZENUSDT.P: Patience & Profitability | %230 Reaction from the Sniper Entry
🐶 DOGEUSDT.P: Next Move
🎨 RENDERUSDT.P: Opportunity of the Month
💎 ETHUSDT.P: Where to Retrace
🟢 BNBUSDT.P: Potential Surge
📊 BTC Dominance: Reaction Zone
🌊 WAVESUSDT.P: Demand Zone Potential
🟣 UNIUSDT.P: Long-Term Trade
🔵 XRPUSDT.P: Entry Zones
🔗 LINKUSDT.P: Follow The River
📈 BTCUSDT.P: Two Key Demand Zones
🟩 POLUSDT: Bullish Momentum
🌟 PENDLEUSDT.P: Where Opportunity Meets Precision
🔥 BTCUSDT.P: Liquidation of Highly Leveraged Longs
🌊 SOLUSDT.P: SOL's Dip - Your Opportunity
🐸 1000PEPEUSDT.P: Prime Bounce Zone Unlocked
🚀 ETHUSDT.P: Set to Explode - Don't Miss This Game Changer
🤖 IQUSDT: Smart Plan
⚡️ PONDUSDT: A Trade Not Taken Is Better Than a Losing One
💼 STMXUSDT: 2 Buying Areas
🐢 TURBOUSDT: Buy Zones and Buyer Presence
🌍 ICPUSDT.P: Massive Upside Potential | Check the Trade Update For Seeing Results
🟠 IDEXUSDT: Spot Buy Area | %26 Profit if You Trade with MSB
📌 USUALUSDT: Buyers Are Active + %70 Profit in Total
🌟 FORTHUSDT: Sniper Entry +%26 Reaction
🐳 QKCUSDT: Sniper Entry +%57 Reaction
📊 BTC.D: Retest of Key Area Highly Likely
📊 XNOUSDT %80 Reaction with a Simple Blue Box!
📊 BELUSDT Amazing %120 Reaction!
I stopped adding to the list because it's kinda tiring to add 5-10 charts in every move but you can check my profile and see that it goes on..

LAYER/USDT Analysis: Trade for Trend ContinuationThis asset has relatively low correlation with Bitcoin and remains in an uptrend.
A long position is considered upon a test and buyer reaction in the $1.2-$1.12 zone , with an initial target of $1.4.

LAYER/USDT: 100%+ PROFIT POTENTIAL TRADE SETUP!!🚀 Hey Traders! LAYER Breakout Alert – 100%+ Move on the Horizon? 👀🔥
If you’re excited for this setup, smash that 👍 and hit Follow for premium trade ideas that actually deliver! 💹🔥
🔥 LAYER/USDT – Double Breakout & Retest in Play! 🚀
LAYER has broken out from both a Cup & Handle pattern and an Ascending Triangle, signaling strong bullish momentum. It’s currently retesting the breakout zone, offering a prime entry opportunity! 💥
💰 Trade Setup:
📍 Entry: CMP, add more up to $1.18
🎯 Targets: 100-120% upside 📈
🛑 Stop-Loss: $1.08
⚡ Leverage: Low (Max 5x)
🔎 Strategy:
Enter with low leverage now
Add more on dips and ride the breakout wave higher 🚀
💬 What’s Your Take?
Are you bullish on LAYER’s double breakout potential? Share your analysis, predictions, and strategies in the comments! Let’s lock in those gains and ride this pump together! 💰🚀🔥

HMSTRUSDT UPDATEHMStrUSDT is a cryptocurrency trading at $0.0017. Its target price is $0.0023, indicating a potential 30%+ gain. The pattern is a Falling Wedge, a reversal pattern signaling a trend change. This pattern suggests the downward trend may be ending. A breakout from the wedge could lead to a strong upward move. The Falling Wedge is a positive signal, indicating a potential price surge. Investors are optimistic about HMStrUSDT's future performance. The current price may be a buying opportunity. Reaching the target price would result in significant returns. HMStrUSDT is poised for a potential breakout and substantial gains.
