#LDO/USDT — Critical Retest at Demand Zone vs Long-Term Downt#LDO
The price is moving in a descending channel on the 1-hour timeframe. It has reached the lower boundary and is heading towards a breakout, with a retest of the upper boundary expected.
We are seeing a bearish bias in the Relative Strength Index (RSI), which has reached near the lower boundary, and an upward bounce is expected.
There is a key support zone in green at 0.5680, and the price has bounced from this level several times. Another bounce is expected.
We are seeing a trend towards stabilizing above the 100-period moving average, which we are approaching, supporting the upward trend.
Entry Price: 0.5880
First Target: 0.5970
Second Target: 0.6112
Third Target: 0.6278
Remember a simple principle: Money Management.
Place your stop-loss order below the green support zone.
For any questions, please leave a comment.
Thank you.
LDOBTC

LDO Looks Bullish (4H)This symbol is in a symmetrical pattern, and it seems that wave G, which was an ABC, has completed.
Key areas have been cleared, and if we are lucky, we can enter a long/buy position on the pullback.
We have two entry points, which we will enter using DCA.
The targets are marked on the chart.
A daily candle closing below the invalidation level will invalidate this analysis.
For risk management, please don't forget stop loss and capital management
When we reach the first target, save some profit and then change the stop to entry
Comment if you have any questions
Thank You

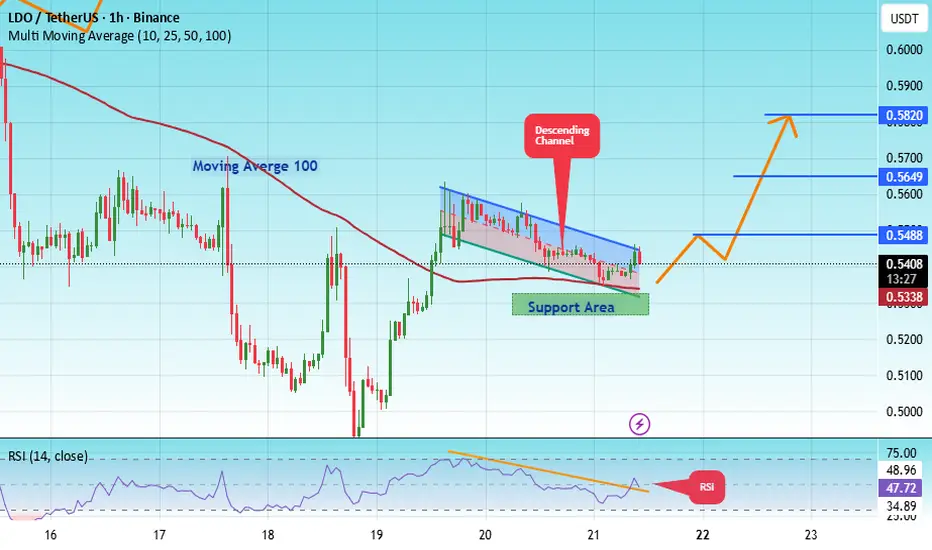
#LDO/USDT — Critical Retest at Demand Zone vs Long-Term Downt#LDO
The price is moving in a descending channel on the 1-hour timeframe. It has reached the lower boundary and is heading towards breaking above it, with a retest of the upper boundary expected.
We have a downtrend on the RSI indicator, which has reached near the lower boundary, and an upward rebound is expected.
There is a key support zone in green at 0.5300. The price has bounced from this level multiple times and is expected to bounce again.
We have a trend towards consolidation above the 100-period moving average, as we are moving close to it, which supports the upward movement.
Entry price: 0.5412
First target: 0.5488
Second target: 0.5650
Third target: 0.5820
Don't forget a simple principle: money management.
Place your stop-loss order below the green support zone.
For any questions, please leave a comment.
Thank you.
LDO Forming Higher Low Under Daily Resistance🔥 Welcome To FireHoseReel !
Let’s dive into Lido DAO (LDO) analysis.
⛳️ LDO Fundamental Overview
Lido DAO (LDO) is a leading liquid-staking governance token ranked around #84 on CoinMarketCap, enabling ETH staking rewards while keeping assets liquid and driving DeFi participation.
👀 LDO 4H Overview
LDO bounced from a monthly support level and moved higher, forming a higher low at $0.5267. Price is now trading just below its daily resistance at $0.5591.
📊 Volume Analysis
After testing the daily resistance, LDO experienced declining volume and selling pressure. Following the higher low formation, buyers stepped in again. If buying volume continues, the $0.5591 resistance could be broken.
✍️ LDO Trading Scenarios
🟢 Long Scenario:
A breakout above $0.5591 with increasing buy volume, along with RSI breaking above 56.58, increases the probability of a breakout and can trigger a long setup.
🔴 Short Scenario:
A breakdown below the current low at $0.5267, combined with rising sell volume and RSI dropping below 41.94, can activate a short setup.
🧠 Protect your capital first. No setup is worth blowing your account. If risk isn’t controlled, profit means nothing. Trade with rules, not emotions.

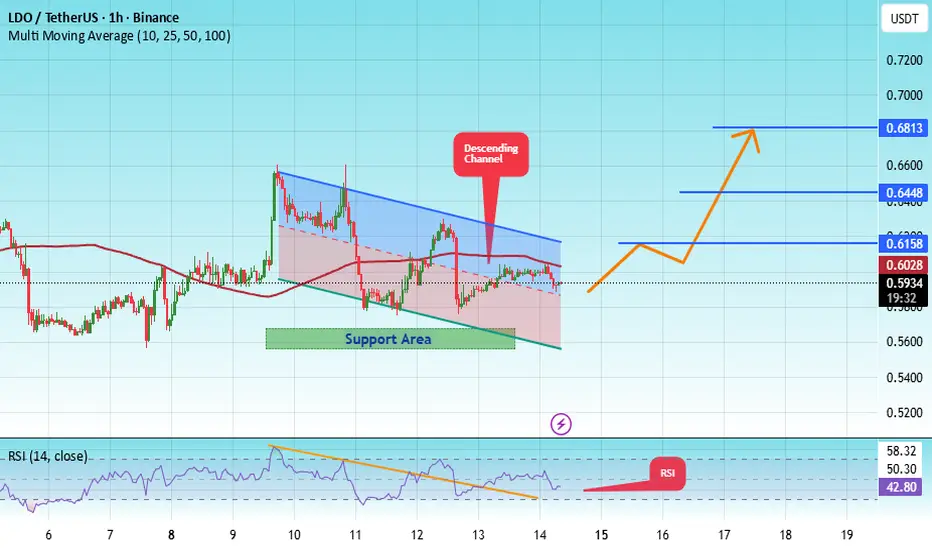
#LDO/USDT — Critical Retest at Demand Zone vs Long-Term Downtr#LDO
The price is moving in a descending channel on the 1-hour timeframe. It has reached the lower boundary and is heading towards breaking above it, with a retest of the upper boundary expected.
We have a downtrend on the RSI indicator, which has reached near the lower boundary, and an upward rebound is expected.
There is a key support zone in green at 0.5625. The price has bounced from this zone multiple times and is expected to bounce again.
We have a trend towards stability above the 100-period moving average, as we are moving close to it, which supports the upward movement.
Entry price: 0.5936
First target: 0.6160
Second target: 0.6448
Third target: 0.6813
Don't forget a simple principle: money management.
Place your stop-loss order below the support zone in green.
For any questions, please leave a comment.
Thank you.
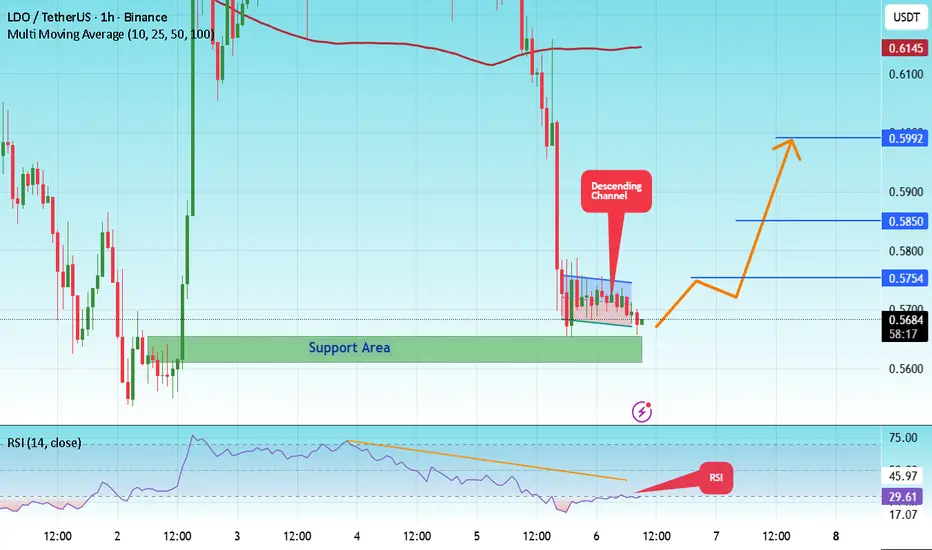
#LDO/USDT — Critical Retest at Demand Zone vs Long-Term Downtr#LDO
The price is moving in a descending channel on the 1-hour timeframe. It has reached the lower boundary and is heading towards a breakout, with a retest of the upper boundary expected.
We are seeing a bearish bias in the Relative Strength Index (RSI), which has reached near the lower boundary, and an upward bounce is expected.
There is a key support zone in green at 0.5635, and the price has bounced from this level several times. Another bounce is expected.
We are seeing a trend towards stabilizing above the 100-period moving average, which we are approaching, supporting the upward trend.
Entry Price: 0.5673
First Target: 0.5757
Second Target: 0.5850
Third Target: 0.5992
Remember a simple principle: Money Management.
Place your stop-loss order below the green support zone.
For any questions, please leave a comment.
Thank you.
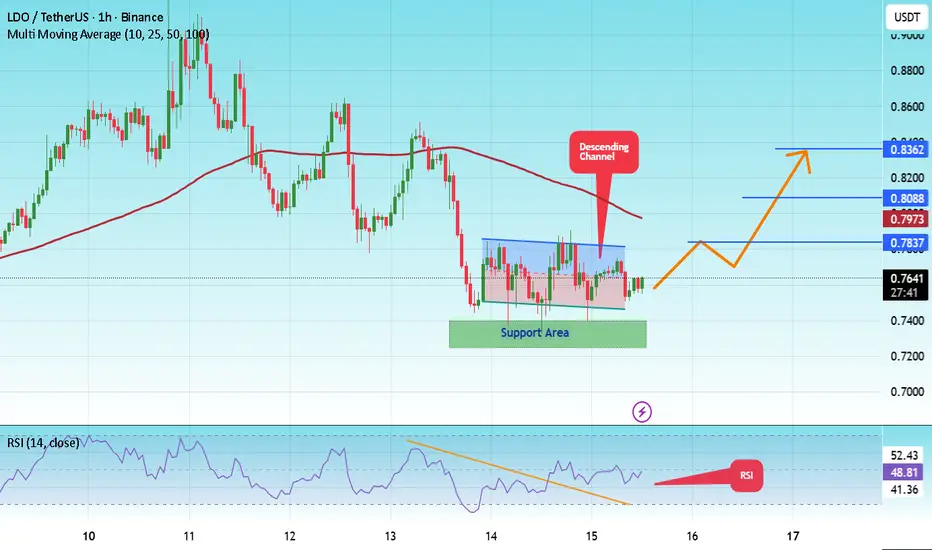
#LDO/USDT — Critical Retest at Demand Zone vs Long-Term Downtr#LDO
The price is moving in a descending channel on the 1-hour timeframe and is expected to break out and continue upwards.
We have a trend to stabilize above the 100-period moving average again.
We have a downtrend on the RSI indicator, which supports an upward move if it breaks above it.
We have a key support zone in green that pushed the price higher at 0.7330.
Entry price: 0.7643
First target: 0.7837
Second target: 0.8088
Third target: 0.8362
For risk management, don't forget stop-loss orders and capital management.
The stop-loss is below the support zone in green.
Upon reaching the first target, take some profits and then change the stop-loss order to an entry order.
For any questions, please comment.
Thank you.
#LDO/USDT — Critical Retest at Demand Zone vs Long-Term Downtr#LDO
The price is moving within an ascending channel on the 1-hour timeframe and is adhering to it well. It is poised to break out strongly and retest the channel.
We have a downtrend line on the RSI indicator that is about to break and retest, which supports the upward move.
There is a key support zone in green at 0.7400, representing a strong support point.
We have a trend of consolidation above the 100-period moving average.
Entry price: 0.7514
First target: 0.7640
Second target: 0.7879
Third target: 0.8140
Don't forget a simple money management rule:
Place your stop-loss order below the green support zone.
Once you reach the first target, save some money and then change your stop-loss order to an entry order.
For any questions, please leave a comment.
Thank you.

#LDO/USDT — Critical Retest at Demand Zone vs Long-Term Downtr#LDO
The price is moving in a descending channel on the 1-hour frame and is expected to break and continue upward.
We have a trend to stabilize above the 100 moving average once again.
We have a downtrend on the RSI indicator that supports the upward move with a breakout.
We have a major support area in green that pushed the price higher at 0.8568.
Entry price: 0.9144.
First target: 0.9520.
Second target: 0.9971.
Third target: 1.04.
To manage risk, don't forget stop loss and capital management.
When you reach the first target, save some profits and then change your stop order to an entry order.
For inquiries, please comment.
Thank you.

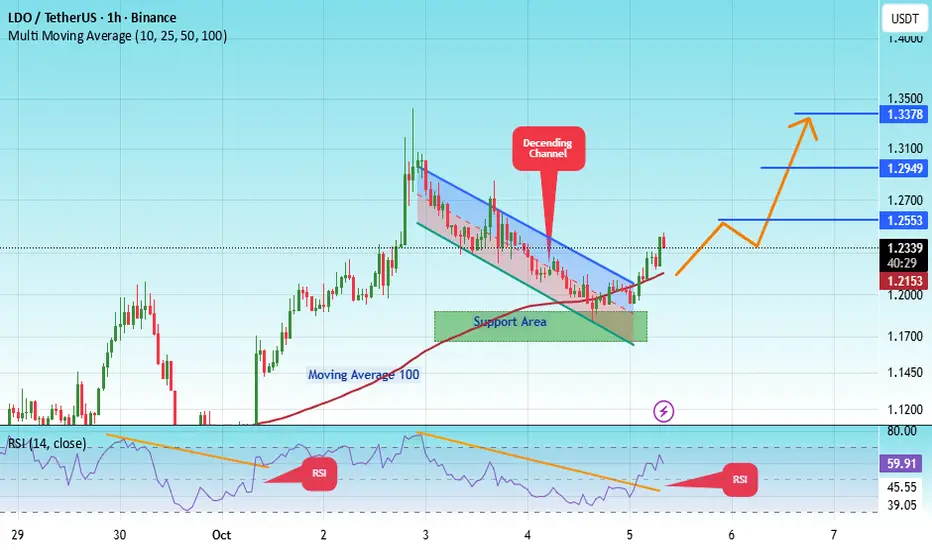
#LDOUSDT Analysis — Pullback Before Bullish Continuation
#LDO
The price is moving within a descending channel on the 1-hour frame, adhering well to it, and is heading for a strong breakout and retest.
We have a bearish trend on the RSI indicator that is about to be broken and retested, which supports the upward breakout.
There is a major support area in green at 1.17, representing a strong support point.
We are heading for consolidation above the 100 moving average.
Entry price: 1.23
First target: 1.25
Second target: 1.30
Third target: 1.34
Don't forget a simple matter: capital management.
#LDO/USDT — Critical Retest at Demand Zone vs Long-Term Downtre#LDO
The price is moving within a descending channel on the 1-hour frame, adhering well to it, and is heading for a strong breakout and retest.
We have a bearish trend on the RSI indicator that is about to be broken and retested, which supports the upward breakout.
There is a major support area in green at 1.04, representing a strong support point.
We are heading for consolidation above the 100 moving average.
Entry price: 1.10
First target: 1.14
Second target: 1.20
Third target: 1.27
Don't forget a simple matter: capital management.
When you reach the first target, save some money and then change your stop-loss order to an entry order.
For inquiries, please leave a comment.
Thank you.

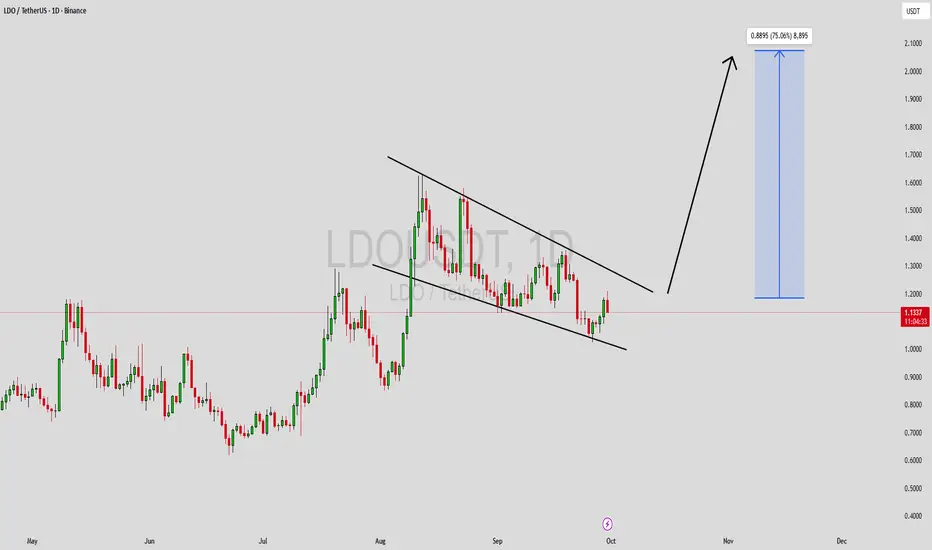
LDOUSDT Forming Falling WedgeLDOUSDT is currently shaping a falling wedge pattern, a classic bullish reversal signal in technical trading. This structure reflects consistent price compression with lower highs and lower lows, but the momentum of sellers is steadily weakening. When combined with strong volume, this setup becomes a high-probability breakout formation, pointing to a potential upside of 60% to 70%+ once resistance levels are cleared.
The falling wedge often precedes explosive breakouts as market participants recognize the shift in momentum. For LDOUSDT, a breakout confirmation above its upper trendline could trigger strong buying interest, inviting both short-term traders and long-term investors to enter positions. This could result in a sharp price acceleration toward higher resistance levels, fueling a sustained bullish trend.
Investor attention toward this project is also on the rise, strengthening the fundamentals behind the technical setup. The combination of favorable sentiment, healthy trading activity, and clear chart structure makes LDOUSDT an attractive opportunity for those seeking strong risk-to-reward trades in the current market environment.
✅ Show your support by hitting the like button and
✅ Leaving a comment below! (What is You opinion about this Coin)
Your feedback and engagement keep me inspired to share more insightful market analysis with you!
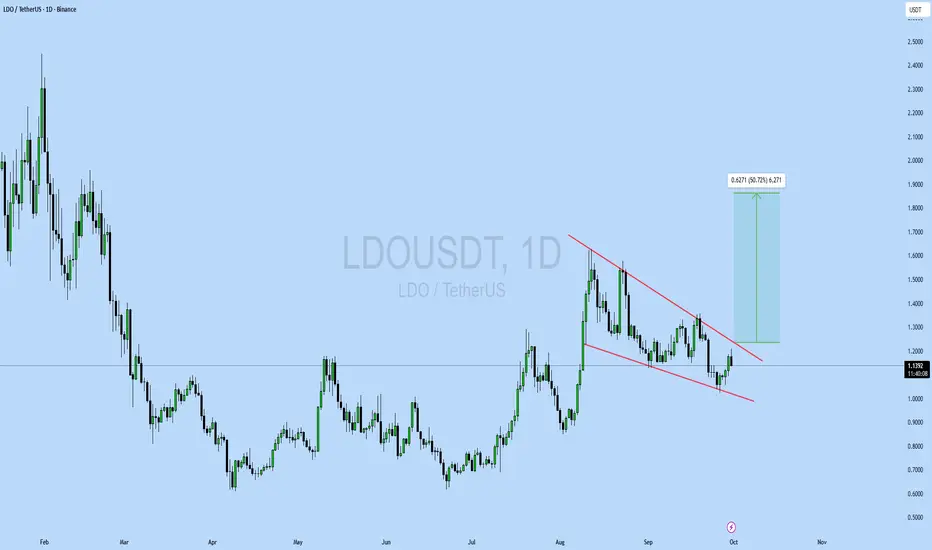
LDOUSDT UPDATE#LDO
UPDATE
LDO Technical Setup
Pattern: Bullish falling wedge breakout
Current Price: $1.138
Target Price: $1.76
Target % Gain: 50.72%
LDO is breaking out of a falling wedge on the 1D timeframe, signaling a bullish reversal with upside potential toward $1.76. Momentum favors continuation if buyers sustain pressure. Always use proper risk management.
#LDO/USDT#LDO
The price is moving within a descending channel on the 1-hour frame and is expected to break and continue upward.
We have a trend to stabilize above the 100 moving average once again.
We have a downtrend on the RSI indicator that supports the upward move with a breakout.
We have a support area at the lower boundary of the channel at 1.18, acting as strong support from which the price can rebound.
We have a major support area in green that pushed the price upward at 1.17.
Entry price: 1.22.
First target: 1.57.
Second target: 1.31.
Third target: 1.37.
To manage risk, don't forget stop loss and capital management.
When you reach the first target, save some profits and then change the stop order to an entry order.
For inquiries, please comment.
Thank you.
LDOUSDT UPDATE#LDO
UPDATE
LDO Technical Setup
Pattern : Falling Wedge Pattern
Current Price: $1.236
Target Price: $1.99
Target % Gain: 68.22%
Technical Analysis: LDO has broken out of a falling wedge on the 1D chart and is retesting the breakout zone with support from the purple demand area. Volume shows strength, and if price holds above $1.20, continuation toward $1.99 is likely.
Time Frame: 1D
Risk Management Tip: Always use proper risk management.

#LDO/USDT | Flipped Longe Term Resistance#LDO
The price is moving within an ascending channel on the 1-hour frame, adhering well to it, and is on its way to breaking strongly upwards and retesting it.
We have support from the lower boundary of the ascending channel, at 1.31.
We have a downtrend on the RSI that is about to be broken and retested, supporting the upside.
There is a major support area in green at 1.28, which represents a strong basis for the upside.
Don't forget a simple thing: ease and capital.
When you reach the first target, save some money and then change your stop-loss order to an entry order.
For inquiries, please leave a comment.
We have a trend to hold above the 100 Moving Average.
Entry price: 1.42.
First target: 1.48.
Second target: 1.55.
Third target: 1.63.
Don't forget a simple thing: ease and capital.
When you reach your first target, save some money and then change your stop-loss order to an entry order.
For inquiries, please leave a comment.
Thank you.

#LDO/USDT#LDO
The price is moving within a descending channel on the 1-hour frame, adhering well to it, and is on its way to breaking strongly upwards and retesting it.
We have support from the lower boundary of the descending channel, at 1.128.
We have a downtrend on the RSI indicator that is about to be broken and retested, supporting the upside.
There is a major support area in green at 1.10, which represents a strong basis for the upside.
Don't forget a simple thing: ease and capital.
When you reach the first target, save some money and then change your stop-loss order to an entry order.
For inquiries, please leave a comment.
We have a trend to hold above the 100 Moving Average.
Entry price: 1.139.
First target: 1.172.
Second target: 1.210.
Third target: 1.270.
Don't forget a simple thing: ease and capital.
When you reach your first target, save some money and then change your stop-loss order to an entry order.
For inquiries, please leave a comment.
Thank you.

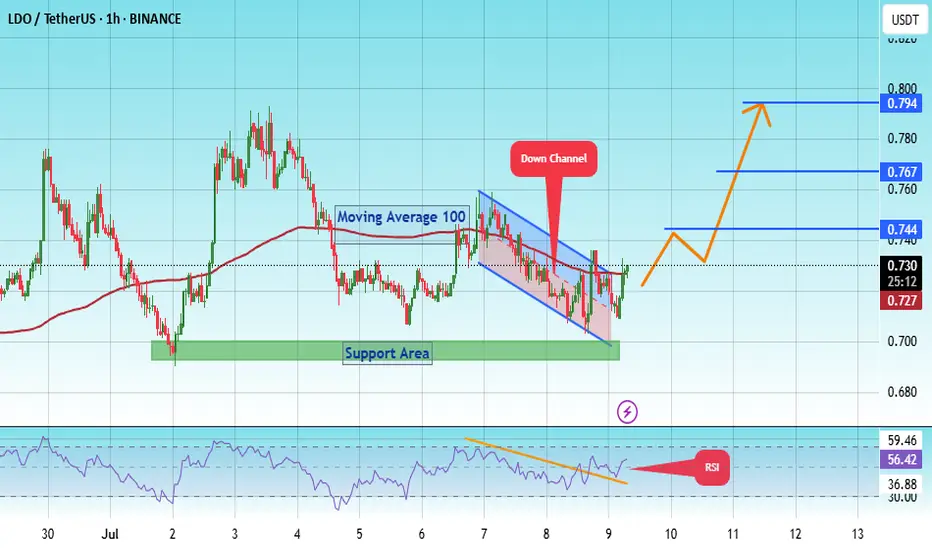
#LDO PUMP TO $ 0.794 ?#LDO
The price is moving within a descending channel on the 1-hour frame, adhering well to it, and is on its way to breaking it strongly upwards and retesting it.
We have a bounce from the lower boundary of the descending channel. This support is at 0.703.
We have a downtrend on the RSI indicator that is about to break and retest, supporting the upside.
There is a major support area in green at 0.695, which represents a strong basis for the upside.
Don't forget a simple thing: ease and capital.
When you reach the first target, save some money and then change your stop-loss order to an entry order.
For inquiries, please leave a comment.
We have a trend to hold above the 100 Moving Average.
Entry price: 0.730
First target: 0.744
Second target: 0.767
Third target: 0.794
Don't forget a simple thing: ease and capital.
When you reach the first target, save some money and then change your stop-loss order to an entry order.
For inquiries, please leave a comment.
Thank you.
#LDO/USDT#LDO
The price is moving within a descending channel on the 1-hour frame, adhering well to it, and is heading toward a strong breakout and retest.
We are experiencing a rebound from the lower boundary of the descending channel. This support is at 0.741.
We have a downtrend on the RSI indicator that is about to be broken and retested, supporting the upward trend.
We are in a trend of consolidation above the 100 moving average.
Entry price: 0.780
First target: 0.805
Second target: 0.837
Third target: 0.870

#LDO/USDT#LDO
The price is moving within a descending channel on the 1-hour frame, adhering well to it, and is heading for a strong breakout and retest.
We are experiencing a rebound from the lower boundary of the descending channel, which is support at 0.988.
We are experiencing a downtrend on the RSI indicator, which is about to break and retest, supporting the upward trend.
We are looking for stability above the 100 Moving Average.
Entry price: 1.008
First target: 1.022
Second target: 1.042
Third target: 1.067

LDO is bearish for MidTerm (2D)Before anything, pay attention to the timeframe; it’s a 2-day timeframe and requires patience.
From the point where we placed the red arrow on the chart, it seems that the bullish LDO pattern, which was a triangle, has completed. LDO has now entered a bearish pattern of the same degree as the previous bullish pattern.
LDO is expected to remain bearish in the medium term and not break above the red box marked on the chart.
The low-risk area for buy positions in spot has been identified for buyers.
The closure of a daily candle above the invalidation level will invalidate this analysis
For risk management, please don't forget stop loss and capital management
Comment if you have any questions
Thank You

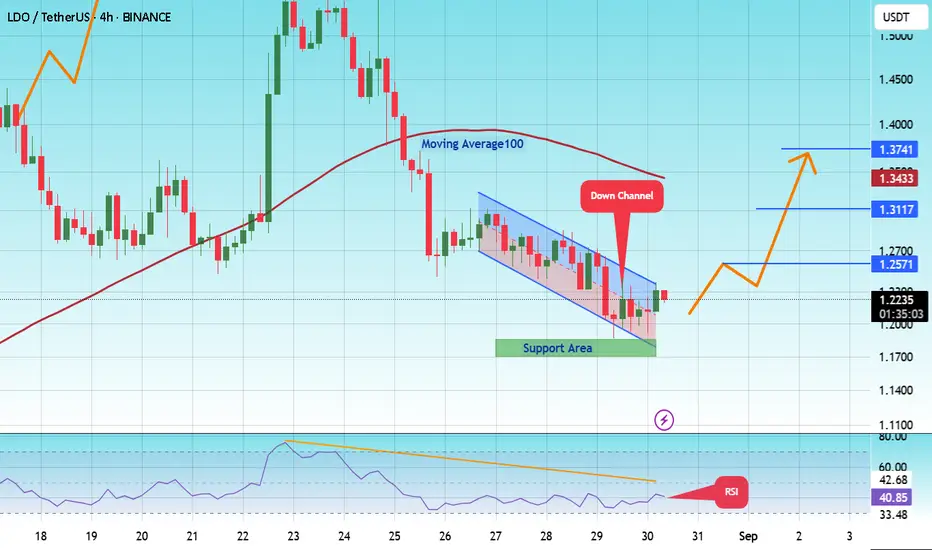
#LDO/USDT#LDO
The price is moving in a descending channel on the 1-hour frame and is adhering to it well and is heading to break it upwards strongly and retest it
We have a bounce from the lower limit of the descending channel, this support is at a price of 1.20
We have a downtrend on the RSI indicator that is about to break and retest, which supports the rise
We have a trend to stabilize above the moving average 100
Entry price 1.23
First target 1.28
Second target 1.34
Third target 1.41

#LDO/USDT#LDO
The price is moving in a descending channel on the 1-hour frame and is adhering to it well and is heading to break it upwards strongly and retest it
We have a bounce from the lower limit of the descending channel, this support is at a price of 1.64
We have a downtrend on the RSI indicator that is about to break and retest, which supports the rise
We have a trend to stabilize above the moving average 100
Entry price 1.71
First target 1.80
Second target 1.87
Third target 1.95
