#LDO/USDT — Critical Retest at Demand Zone vs Long-Term Downt#LDO
The price is moving within a descending channel on the hourly timeframe. It has reached the lower boundary and is heading towards a breakout, with a retest of the upper boundary expected.
The Relative Strength Index (RSI) is showing a downward trend, approaching the lower boundary, and an upward bounce is anticipated.
There is a key support zone in green at 0.4090, and the price has bounced from this level several times and is expected to bounce again.
The indicator is showing a trend towards consolidation above the 100-period moving average, which we are approaching, supporting the upward move.
Entry Price: 0.4173
First Target: 0.4280
Second Target: 0.4400
Third Target: 0.4548
Stop Loss: Below the green support zone.
Remember this simple thing: Money management.
For any questions, please leave a comment.
Thank you.
LDOUSDTPERP

#LDO/USDT — Critical Retest at Demand Zone vs Long-Term Downt#LDO
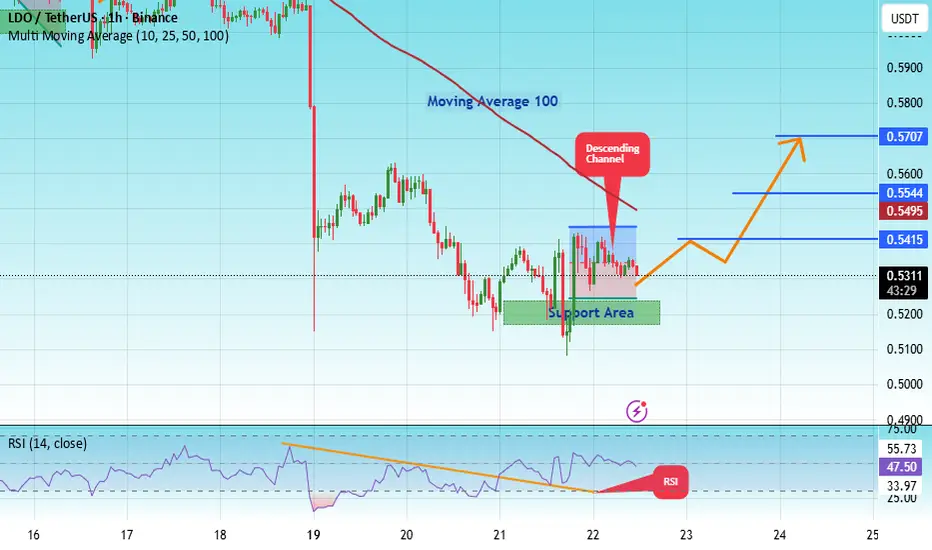
The price is moving within a descending channel on the hourly timeframe. It has reached the lower boundary and is heading towards a breakout, with a retest of the upper boundary expected.
The Relative Strength Index (RSI) is showing a downward trend, approaching the lower boundary, and an upward bounce is anticipated.
There is a key support zone in green at 0.5200, and the price has bounced from this level several times and is expected to bounce again.
The indicator is showing a trend towards consolidation above the 100-period moving average, which we are approaching, supporting the upward move.
Entry Price: 0.5311
First Target: 0.5415
Second Target: 0.5544
Third Target: 0.5707
Stop Loss: Below the green support zone.
Remember this simple thing: Money management.
For any questions, please leave a comment.
Thank you.
#LDO/USDT — Critical Retest at Demand Zone vs Long-Term Downt#LDO
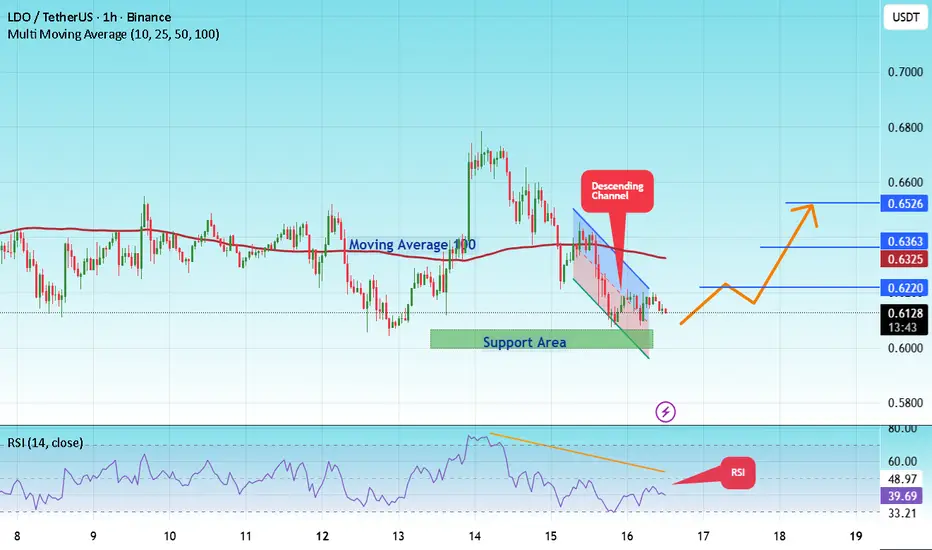
The price is moving within a descending channel on the hourly timeframe. It has reached the upper boundary and is heading towards breaking it. A retest of this boundary is expected.
The Relative Strength Index (RSI) is showing an upward trend, as it has approached the upper boundary. A bearish reversal is expected.
There is a key support zone in green at 0.6020. The price has bounced from this zone several times and is expected to bounce again.
A consolidation trend is observed above the 100-period moving average, which we are approaching. This trend supports a decline towards this level.
Entry Price: 0.6128
Target 1: 0.6220
Target 2: 0.6363
Target 3: 0.6526
Stop Loss: Above the green support zone.
Remember this simple thing: Money management.
For any questions, please leave a comment.
Thank you.
#LDO/USDT — Critical Retest at Demand Zone vs Long-Term Downt#LDO
The price is moving in a descending channel on the 1-hour timeframe. It has reached the lower boundary and is heading towards a breakout, with a retest of the upper boundary expected.
We are seeing a bearish bias in the Relative Strength Index (RSI), which has reached near the lower boundary, and an upward bounce is expected.
There is a key support zone in green at 0.5680, and the price has bounced from this level several times. Another bounce is expected.
We are seeing a trend towards stabilizing above the 100-period moving average, which we are approaching, supporting the upward trend.
Entry Price: 0.5880
First Target: 0.5970
Second Target: 0.6112
Third Target: 0.6278
Remember a simple principle: Money Management.
Place your stop-loss order below the green support zone.
For any questions, please leave a comment.
Thank you.

LDOUSDT UPDATE#LDO
UPDATE
DGB Technical Setup
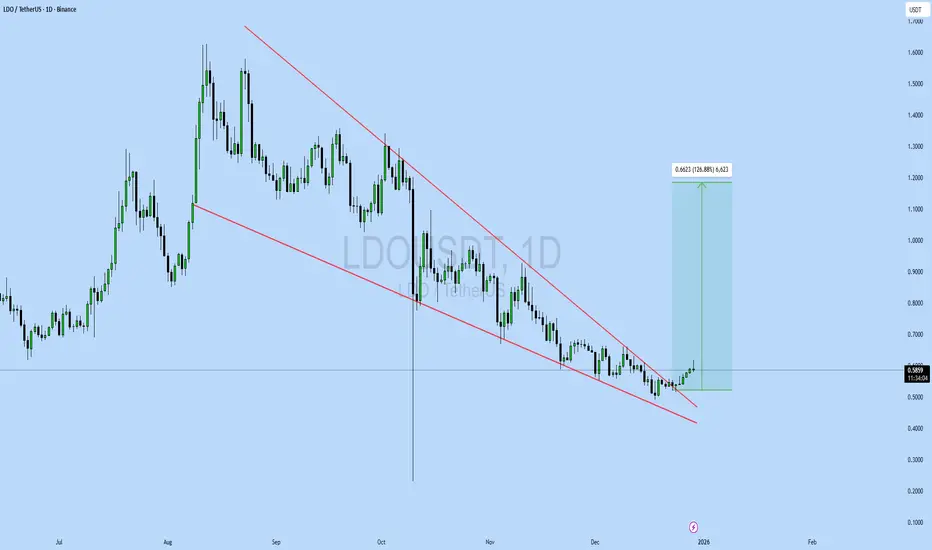
Pattern: Falling Wedge Pattern
Current Price: 0.5833
Target Price: 1.25
Target % Gain: 126.88%
Technical Analysis: LDO is breaking out of a falling wedge pattern on the 1D chart, indicating bullish potential. The price has recently pushed above the wedge support area and is attempting a breakout toward the upper resistance trendline. This move is supported by improving momentum, and a sustained hold above the breakout zone could validate continuation toward the projected target area shown on the chart.
Time Frame: 1D
Risk Management Tip: Always use proper risk management.
#LDO/USDT — Critical Retest at Demand Zone vs Long-Term Downt#LDO
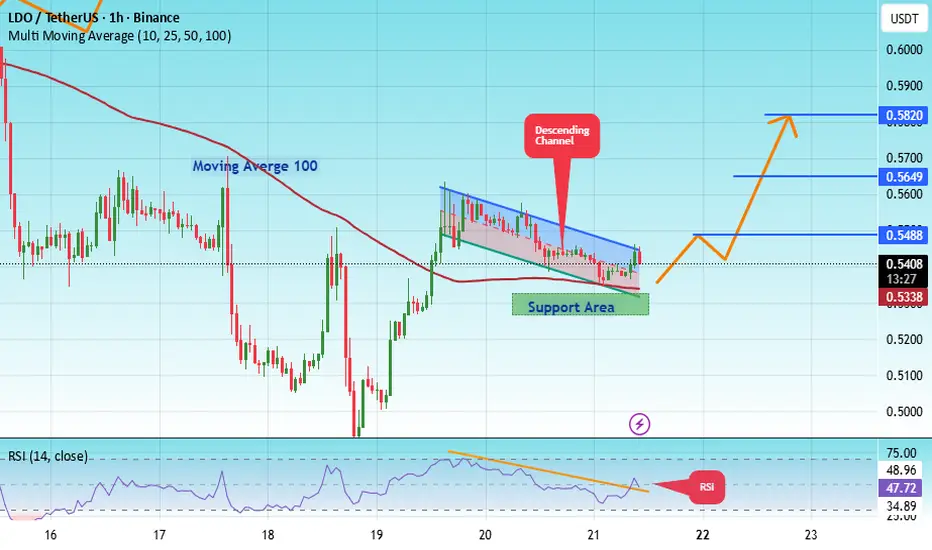
The price is moving in a descending channel on the 1-hour timeframe. It has reached the lower boundary and is heading towards breaking above it, with a retest of the upper boundary expected.
We have a downtrend on the RSI indicator, which has reached near the lower boundary, and an upward rebound is expected.
There is a key support zone in green at 0.5300. The price has bounced from this level multiple times and is expected to bounce again.
We have a trend towards consolidation above the 100-period moving average, as we are moving close to it, which supports the upward movement.
Entry price: 0.5412
First target: 0.5488
Second target: 0.5650
Third target: 0.5820
Don't forget a simple principle: money management.
Place your stop-loss order below the green support zone.
For any questions, please leave a comment.
Thank you.
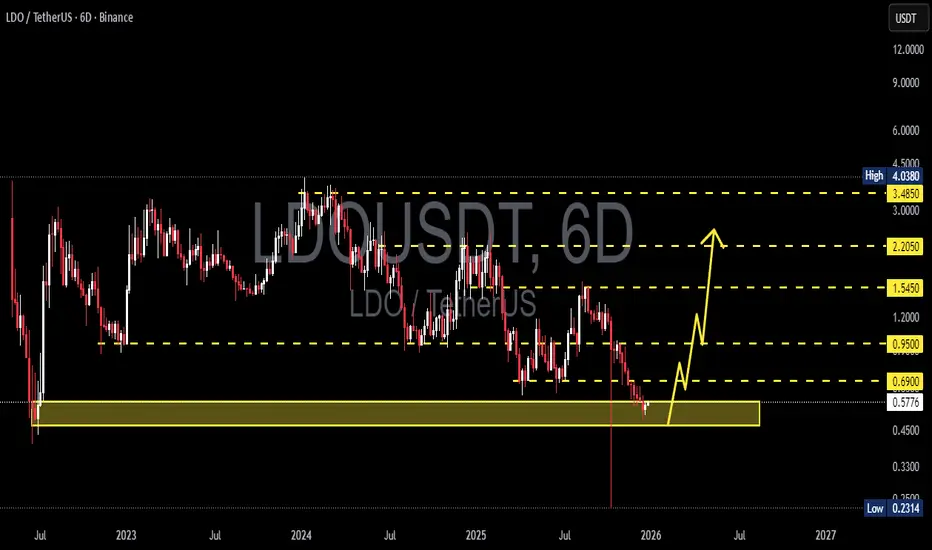
LDO/USDT – Hold for a Bounce or Break for CapitulationLDO/USDT on the 6D timeframe (Binance) is currently in a strong bearish continuation phase after failing to maintain its bullish structure from the 3.48–4.03 peak area. Price has now declined into a major historical demand zone, highlighted by the yellow box at 0.5785 – 0.470.
This zone represents a key long-term support area and could act as the last major defense for buyers before a deeper bearish move.
---
Market Structure & Trend
Primary trend: Bearish
Consistent Lower Highs (LH) and Lower Lows (LL)
Previous bullish structure has been fully invalidated
Price remains below all major higher-timeframe resistance levels
Bearish momentum is still dominant, although it is slowing as price reaches demand
---
Technical Pattern Explanation
1. Bearish Market Structure Breakdown
Price continues to respect a bearish structure, confirming long-term distribution.
2. Descending Range / Loose Bearish Channel
Price action forms a declining range with weak bullish reactions at each resistance:
0.95
1.545
2.205
3. Strong Historical Demand Zone
The 0.5785 – 0.470 zone:
Previously triggered strong bullish reactions
Acts as a historical accumulation area
High probability zone for institutional demand if buyers step in
---
Key Levels
Support:
0.5785 – 0.470 (Major Demand Zone)
Below this zone: 0.231 (Historical Low)
Resistance:
0.690
0.950
1.545
2.205
3.485 (Major Supply Zone)
---
Bullish Scenario
The bullish scenario is valid only if:
Price holds above 0.470
Strong rejection candles / long lower wicks appear inside the demand zone
Followed by a break and close above 0.690
Bullish Targets:
0.690
0.950
1.545
Extended target: 2.205
Note: This is a counter-trend setup, suitable for accumulation or speculative swing trades, not a confirmed trend reversal.
---
Bearish Scenario
Bearish continuation occurs if:
Price closes below 0.470
The demand zone fails to hold
No significant buyer reaction appears
Bearish Targets:
0.330
0.231 (Historical Low)
A clean breakdown would likely trigger a capitulation move.
---
Conclusion
LDO is currently trading at a critical long-term decision zone.
The 0.5785 – 0.470 area acts as the final support zone for buyers.
Holding this zone → potential relief rally or accumulation phase
Breaking below → high risk of accelerated bearish continuation
Patience and price action confirmation are strongly recommended.
#LDOUSDT #LDO #CryptoAnalysis #TechnicalAnalysis #Altcoin #DemandZone #SupportResistance #BearishMarket #PotentialReversal
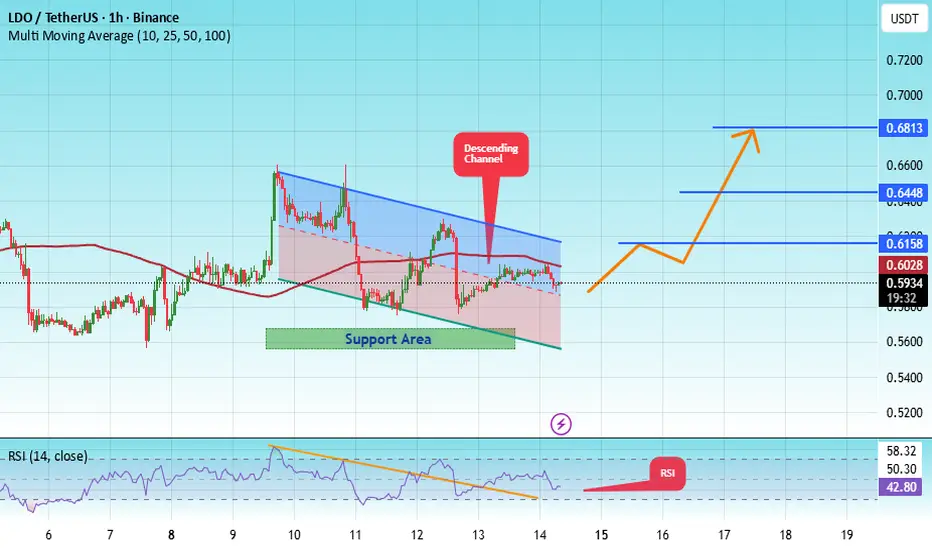
#LDO/USDT — Critical Retest at Demand Zone vs Long-Term Downtr#LDO
The price is moving in a descending channel on the 1-hour timeframe. It has reached the lower boundary and is heading towards breaking above it, with a retest of the upper boundary expected.
We have a downtrend on the RSI indicator, which has reached near the lower boundary, and an upward rebound is expected.
There is a key support zone in green at 0.5625. The price has bounced from this zone multiple times and is expected to bounce again.
We have a trend towards stability above the 100-period moving average, as we are moving close to it, which supports the upward movement.
Entry price: 0.5936
First target: 0.6160
Second target: 0.6448
Third target: 0.6813
Don't forget a simple principle: money management.
Place your stop-loss order below the support zone in green.
For any questions, please leave a comment.
Thank you.
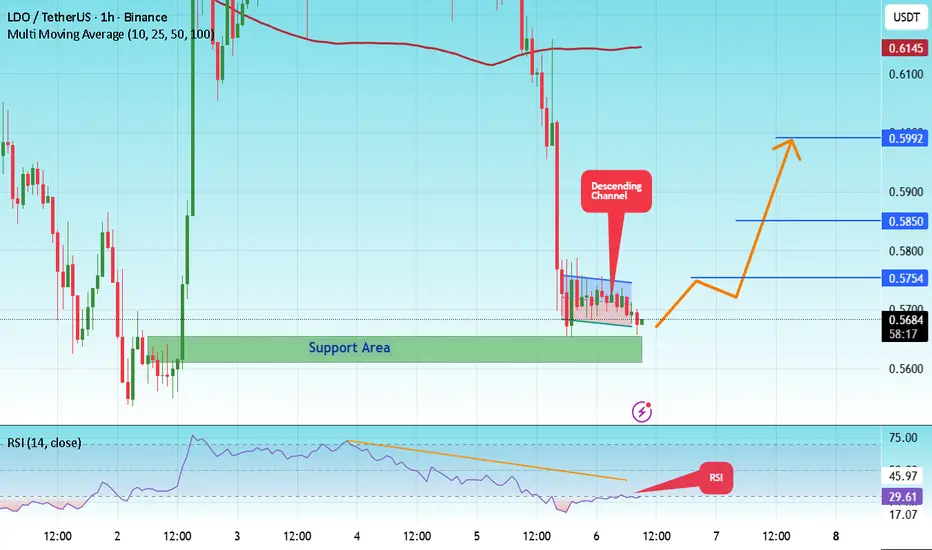
#LDO/USDT — Critical Retest at Demand Zone vs Long-Term Downtr#LDO
The price is moving in a descending channel on the 1-hour timeframe. It has reached the lower boundary and is heading towards a breakout, with a retest of the upper boundary expected.
We are seeing a bearish bias in the Relative Strength Index (RSI), which has reached near the lower boundary, and an upward bounce is expected.
There is a key support zone in green at 0.5635, and the price has bounced from this level several times. Another bounce is expected.
We are seeing a trend towards stabilizing above the 100-period moving average, which we are approaching, supporting the upward trend.
Entry Price: 0.5673
First Target: 0.5757
Second Target: 0.5850
Third Target: 0.5992
Remember a simple principle: Money Management.
Place your stop-loss order below the green support zone.
For any questions, please leave a comment.
Thank you.
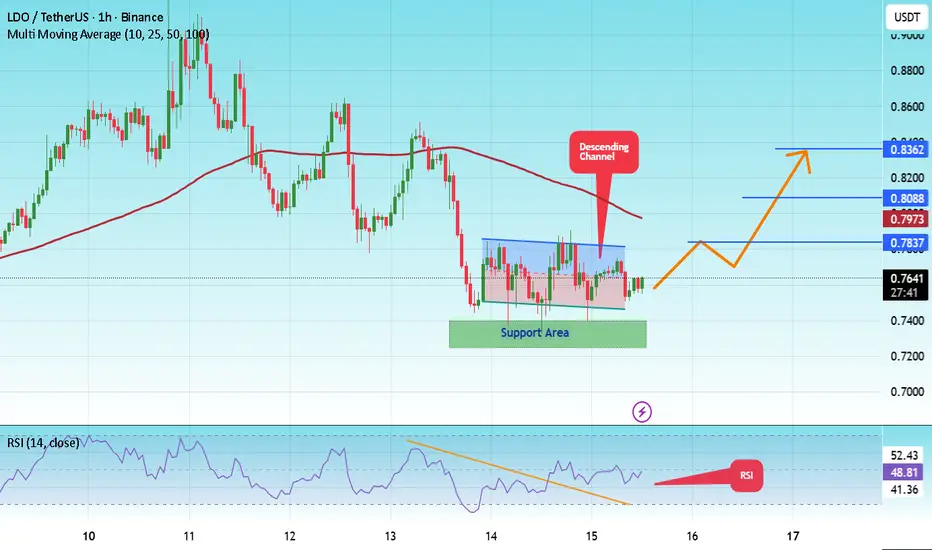
#LDO/USDT — Critical Retest at Demand Zone vs Long-Term Downtr#LDO
The price is moving in a descending channel on the 1-hour timeframe and is expected to break out and continue upwards.
We have a trend to stabilize above the 100-period moving average again.
We have a downtrend on the RSI indicator, which supports an upward move if it breaks above it.
We have a key support zone in green that pushed the price higher at 0.7330.
Entry price: 0.7643
First target: 0.7837
Second target: 0.8088
Third target: 0.8362
For risk management, don't forget stop-loss orders and capital management.
The stop-loss is below the support zone in green.
Upon reaching the first target, take some profits and then change the stop-loss order to an entry order.
For any questions, please comment.
Thank you.
#LDO/USDT — Critical Retest at Demand Zone vs Long-Term Downtr#LDO
The price is moving within an ascending channel on the 1-hour timeframe and is adhering to it well. It is poised to break out strongly and retest the channel.
We have a downtrend line on the RSI indicator that is about to break and retest, which supports the upward move.
There is a key support zone in green at 0.7400, representing a strong support point.
We have a trend of consolidation above the 100-period moving average.
Entry price: 0.7514
First target: 0.7640
Second target: 0.7879
Third target: 0.8140
Don't forget a simple money management rule:
Place your stop-loss order below the green support zone.
Once you reach the first target, save some money and then change your stop-loss order to an entry order.
For any questions, please leave a comment.
Thank you.

#LDO/USDT — Critical Retest at Demand Zone vs Long-Term Downtr#LDO
The price is moving in a descending channel on the 1-hour frame and is expected to break and continue upward.
We have a trend to stabilize above the 100 moving average once again.
We have a downtrend on the RSI indicator that supports the upward move with a breakout.
We have a major support area in green that pushed the price higher at 0.8568.
Entry price: 0.9144.
First target: 0.9520.
Second target: 0.9971.
Third target: 1.04.
To manage risk, don't forget stop loss and capital management.
When you reach the first target, save some profits and then change your stop order to an entry order.
For inquiries, please comment.
Thank you.

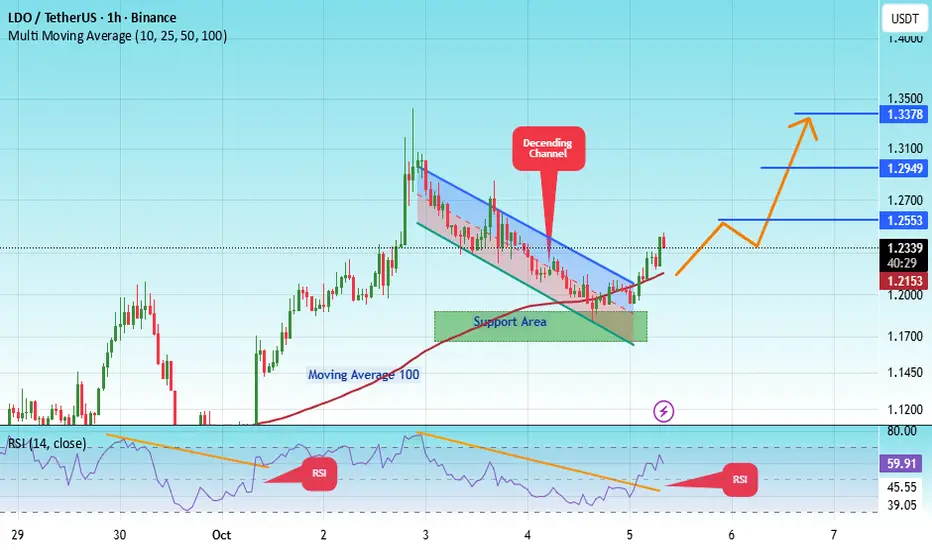
#LDOUSDT Analysis — Pullback Before Bullish Continuation
#LDO
The price is moving within a descending channel on the 1-hour frame, adhering well to it, and is heading for a strong breakout and retest.
We have a bearish trend on the RSI indicator that is about to be broken and retested, which supports the upward breakout.
There is a major support area in green at 1.17, representing a strong support point.
We are heading for consolidation above the 100 moving average.
Entry price: 1.23
First target: 1.25
Second target: 1.30
Third target: 1.34
Don't forget a simple matter: capital management.
#LDO/USDT — Critical Retest at Demand Zone vs Long-Term Downtre#LDO
The price is moving within a descending channel on the 1-hour frame, adhering well to it, and is heading for a strong breakout and retest.
We have a bearish trend on the RSI indicator that is about to be broken and retested, which supports the upward breakout.
There is a major support area in green at 1.04, representing a strong support point.
We are heading for consolidation above the 100 moving average.
Entry price: 1.10
First target: 1.14
Second target: 1.20
Third target: 1.27
Don't forget a simple matter: capital management.
When you reach the first target, save some money and then change your stop-loss order to an entry order.
For inquiries, please leave a comment.
Thank you.

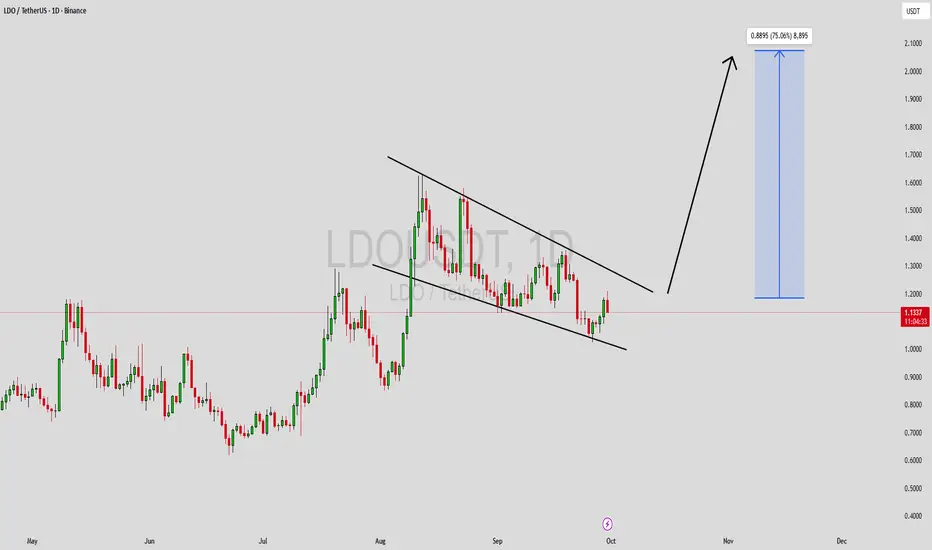
LDOUSDT Forming Falling WedgeLDOUSDT is currently shaping a falling wedge pattern, a classic bullish reversal signal in technical trading. This structure reflects consistent price compression with lower highs and lower lows, but the momentum of sellers is steadily weakening. When combined with strong volume, this setup becomes a high-probability breakout formation, pointing to a potential upside of 60% to 70%+ once resistance levels are cleared.
The falling wedge often precedes explosive breakouts as market participants recognize the shift in momentum. For LDOUSDT, a breakout confirmation above its upper trendline could trigger strong buying interest, inviting both short-term traders and long-term investors to enter positions. This could result in a sharp price acceleration toward higher resistance levels, fueling a sustained bullish trend.
Investor attention toward this project is also on the rise, strengthening the fundamentals behind the technical setup. The combination of favorable sentiment, healthy trading activity, and clear chart structure makes LDOUSDT an attractive opportunity for those seeking strong risk-to-reward trades in the current market environment.
✅ Show your support by hitting the like button and
✅ Leaving a comment below! (What is You opinion about this Coin)
Your feedback and engagement keep me inspired to share more insightful market analysis with you!
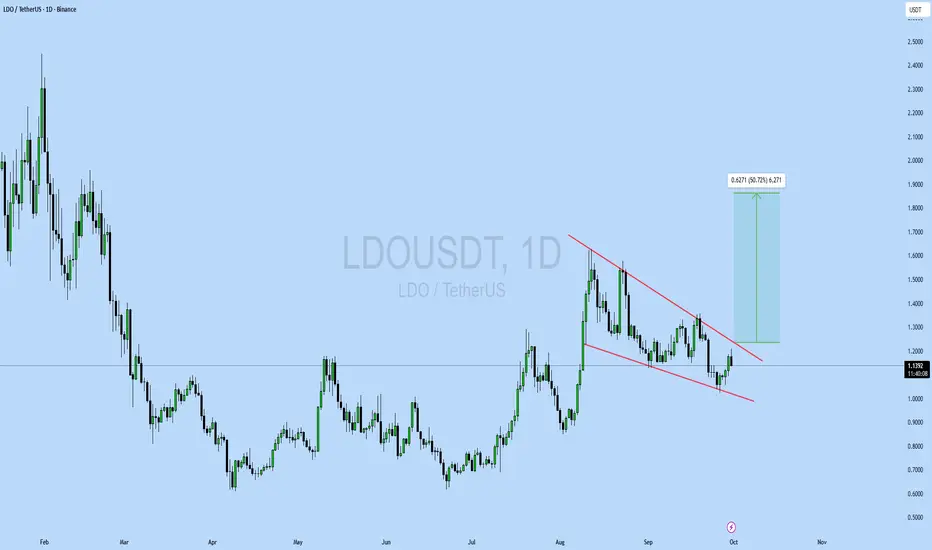
LDOUSDT UPDATE#LDO
UPDATE
LDO Technical Setup
Pattern: Bullish falling wedge breakout
Current Price: $1.138
Target Price: $1.76
Target % Gain: 50.72%
LDO is breaking out of a falling wedge on the 1D timeframe, signaling a bullish reversal with upside potential toward $1.76. Momentum favors continuation if buyers sustain pressure. Always use proper risk management.
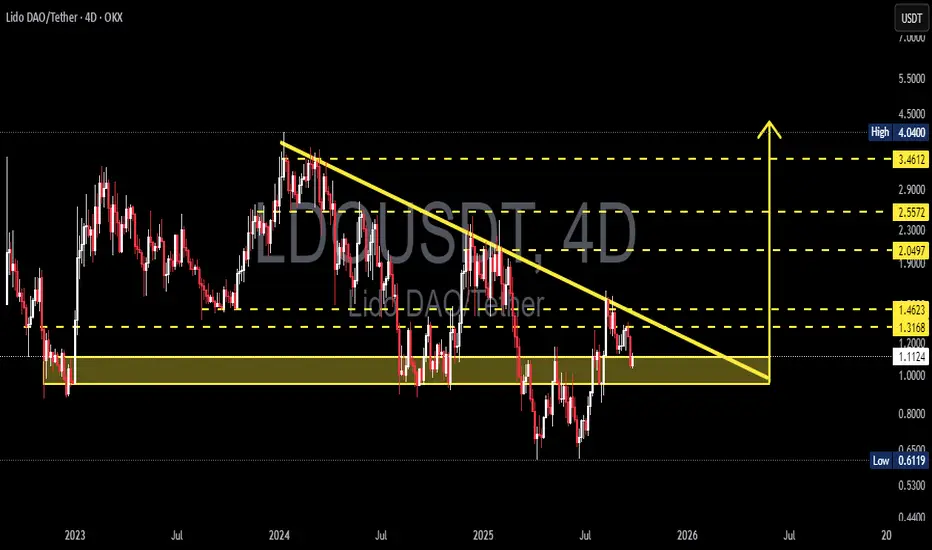
LDOUSDT — Critical Retest at Demand Zone vs Long-Term Downtren!Lido DAO (LDO) is currently sitting at a make-or-break level. The chart shows price being squeezed between a long-term descending trendline from the 2023–2024 highs and a strong demand zone around $1.00–1.12. This setup signals a major decision point: either a bullish reversal is about to begin, or bearish continuation will take over.
---
🔎 Key Technical Structure
Descending Trendline: consistent lower-highs pressuring every bounce → sellers still in control on the bigger picture.
Demand Zone $1.00–1.12: highlighted in yellow, repeatedly acting as strong support → buyers are defending aggressively.
Support vs Resistance Clash: the meeting point of horizontal demand and the trendline creates a descending triangle-like structure. Typically bearish, but if demand holds, it could trigger a powerful reversal breakout.
---
🚀 Bullish Scenario
Confirmation: 4D close above the trendline and $1.46.
Upside targets:
$2.05 (Target 1, key resistance)
$2.55 (Target 2, prior supply area)
$3.46 (Target 3, major resistance)
Potential upside: +80% to +210% from current levels if breakout is strong.
---
🔻 Bearish Scenario
Confirmation: 4D close below $1.00 support.
Downside target: retest of structural low at $0.61.
Potential downside: about -45% from current levels.
---
⚖️ Conclusion
LDO is at a critical decision zone:
Break above $1.46 → opens the door to $2–3+ rally.
Breakdown below $1.00 → likely continuation toward $0.61.
For swing traders, this is a moment to wait for confirmation before committing to a major position. This demand zone could be the foundation for accumulation or the beginning of deeper downside.
---
📢 Note
Always wait for candle close (4D/1W) + volume confirmation before entering. This analysis is for educational purposes only — not financial advice.
---
#LDO #LDOUSDT #LidoDAO #DeFi #Crypto #TechnicalAnalysis #Breakout #SupportResistance #SwingTrade
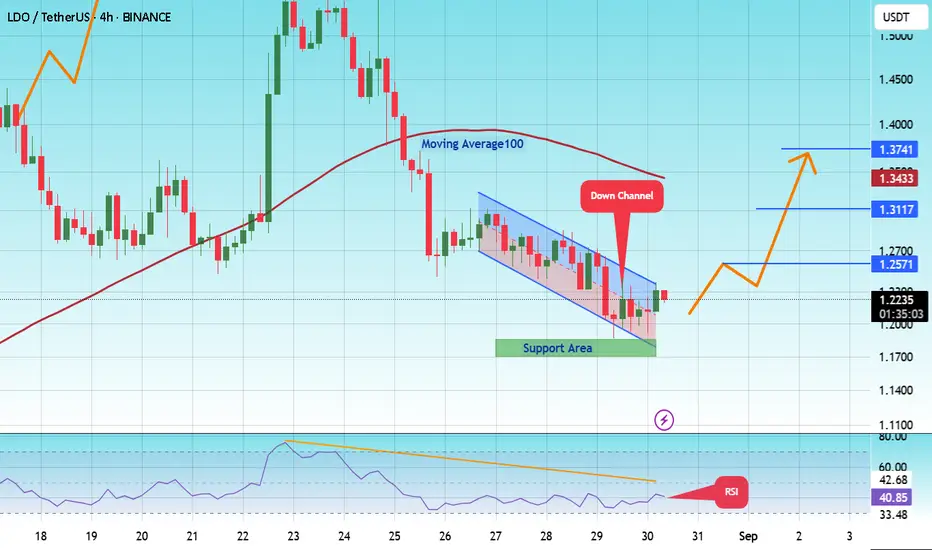
#LDO/USDT#LDO
The price is moving within a descending channel on the 1-hour frame and is expected to break and continue upward.
We have a trend to stabilize above the 100 moving average once again.
We have a downtrend on the RSI indicator that supports the upward move with a breakout.
We have a support area at the lower boundary of the channel at 1.18, acting as strong support from which the price can rebound.
We have a major support area in green that pushed the price upward at 1.17.
Entry price: 1.22.
First target: 1.57.
Second target: 1.31.
Third target: 1.37.
To manage risk, don't forget stop loss and capital management.
When you reach the first target, save some profits and then change the stop order to an entry order.
For inquiries, please comment.
Thank you.
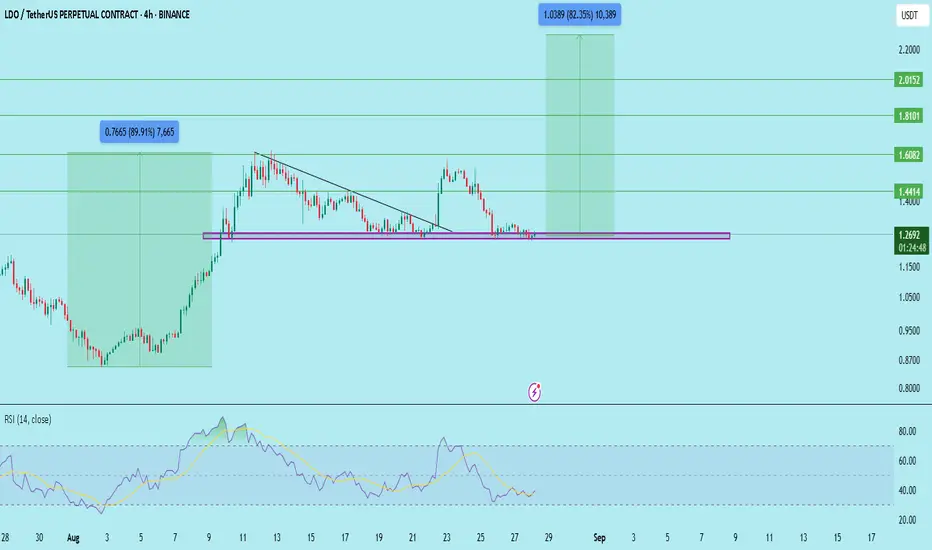
LDO/USDT – Key Support Retest & Possible Reversal SetupLDO has come back to retest the 1.25–1.27 demand zone, which acted as a strong support level in the past. This zone has historically triggered bullish momentum whenever defended successfully.
Analysis & Structure
Price recently retraced from its highs and is now testing the previous accumulation zone.
Buyers seem to be defending the 1.25–1.27 support (purple rectangle).
If this support holds, LDO could bounce towards higher resistance levels.
A breakdown below 1.25, however, would invalidate this setup and open the path to further downside.
Trade Plan
Entry Zone: 1.25–1.27 (support retest)
Stop Loss: Below 1.25 (invalidates the bullish structure)
Targets: 1.44, 1.60, 1.81, 2.01
Trading Insight
This is a risk-reward favorable setup if the support zone holds. Patience is key here – confirmation on higher timeframes is recommended before entering.
DYOR | Not Financial Advice
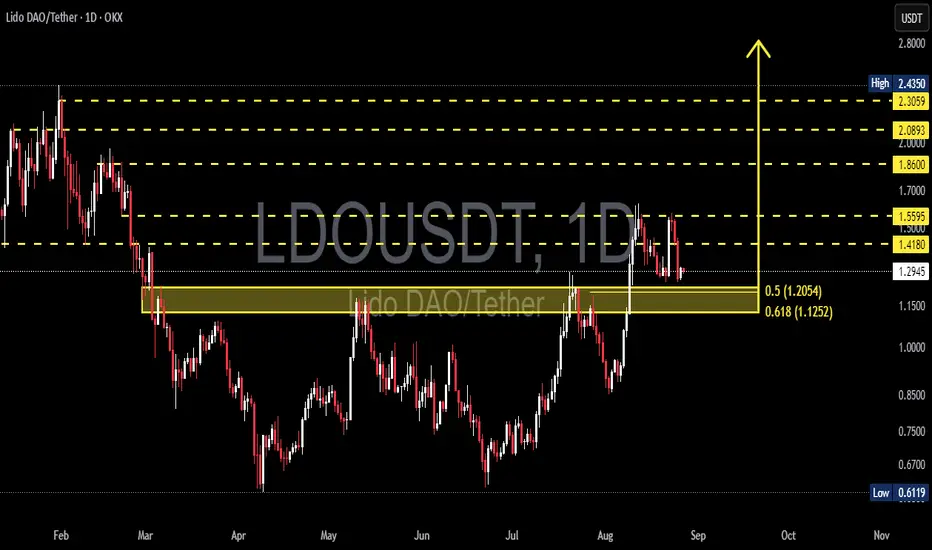
LDO/USDT — Breakout, Retest, and the Critical Demand Zone!🔎 Market Structure
LDO price is currently hovering around 1.29 USDT after breaking out of a long accumulation phase from the 0.61 low. Technically, the market has just made a significant breakout, but is now undergoing a healthy pullback to retest a key demand zone.
The 1.205 – 1.125 zone is the main focus because:
It aligns with the Fibonacci retracement 0.5 & 0.618, also known as the “golden zone.”
Acts as a flip zone (previous resistance → potential support/demand).
If this zone holds, LDO may continue its bullish momentum with higher upside targets.
---
🟢 Bullish Scenario
As long as price holds above 1.205 – 1.125, bullish momentum remains valid.
Long lower wicks at this demand area may indicate buyer absorption/accumulation.
Upside targets if demand holds:
1.418 → 1.5595 → 1.86 → 2.0893 → 2.3059 → 2.4350 (high from the chart).
A confirmed daily close above 1.418 would strengthen the bullish outlook.
📌 Strategy: Accumulate around 1.20–1.12 or wait for breakout confirmation above 1.418. Stop-loss below 1.10. Mid-term targets 1.55–1.86; long-term extension up to 2.30–2.43.
---
🔴 Bearish Scenario
If price closes daily below 1.125, the demand zone fails to hold.
This could trigger a deeper correction towards 0.85, and in extension, back to the 0.61 low.
A breakdown of such a strong demand zone usually accelerates selling pressure.
📌 Strategy: Short entries only valid if daily close confirms below 1.125 with strong volume. Downside targets: 0.85 → 0.61. Stop-loss above 1.25.
---
📈 Pattern & Sentiment
Key pattern: Breakout from accumulation + retest of golden zone.
Sentiment: Neutral–bullish as long as demand zone holds. Watch out for liquidity sweeps below 1.125.
Volume: Bullish confirmation requires increasing buy volume on rebounds.
---
✅ Conclusion
Bullish case: Holding the 1.205–1.125 golden zone → continuation towards 1.418–1.5595 and higher levels.
Bearish case: Daily close below 1.125 → deeper correction to 0.85–0.61.
LDO is at a critical decision point: continuation of the uptrend or rejection into a broader correction.
#LDO #LDOUSDT #Lido #CryptoAnalysis #Altcoin #Fibonacci #Breakout #SwingTrade #CryptoSignals
#LDO/USDT | Flipped Longe Term Resistance#LDO
The price is moving within an ascending channel on the 1-hour frame, adhering well to it, and is on its way to breaking strongly upwards and retesting it.
We have support from the lower boundary of the ascending channel, at 1.31.
We have a downtrend on the RSI that is about to be broken and retested, supporting the upside.
There is a major support area in green at 1.28, which represents a strong basis for the upside.
Don't forget a simple thing: ease and capital.
When you reach the first target, save some money and then change your stop-loss order to an entry order.
For inquiries, please leave a comment.
We have a trend to hold above the 100 Moving Average.
Entry price: 1.42.
First target: 1.48.
Second target: 1.55.
Third target: 1.63.
Don't forget a simple thing: ease and capital.
When you reach your first target, save some money and then change your stop-loss order to an entry order.
For inquiries, please leave a comment.
Thank you.

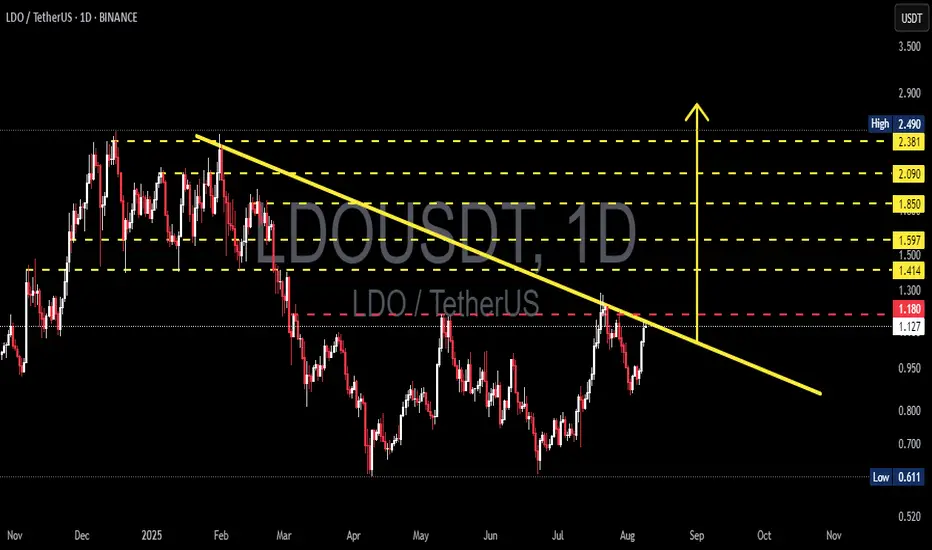
LDO/USDT — Testing the Downtrend Line: Breakout or Rejection?Summary
LDO price is currently testing the descending trendline (yellow) connecting this year’s major highs. This zone coincides with a key horizontal resistance around 1.18–1.30. Price action in this area will determine the next move — either a sustained breakout towards higher supply zones or a rejection leading to renewed bearish pressure.
---
Key Levels (from chart)
Immediate resistance / quick supply zone: ~1.18 (red line) — short-term key.
Descending trendline (yellow): dynamic resistance, currently intersecting near 1.18–1.30.
Staged resistance targets (yellow dashed lines): 1.414 → 1.50 → 1.597 → 1.85 → 2.09 → 2.38 → 2.49.
Main supports: 0.95–1.00 (intraday), and major swing low 0.611.
---
Pattern / Structure Analysis
Mid-term trend — bearish: a clear series of lower highs since the start of the year, marked by a descending supply line.
Current condition — accumulation pressure: after months of sideways consolidation, price is rallying into trendline resistance — often a decisive point leading to either breakout or rejection.
No clear classic reversal pattern (e.g., full inverse head & shoulders) — more of a trendline test after consolidation.
Volume and daily close confirmation are critical to avoid false breakouts.
---
Bullish Scenario (requirements for a valid bullish setup)
Bullish trigger (confirmation):
1. Daily close above trendline + above ~1.30 (body close, not just wick).
2. Rising volume during breakout, showing strong buying participation.
3. A successful retest of the trendline as support after breakout for safer entry.
Step targets after confirmation:
Target 1: 1.414 — partial profit zone.
Target 2: 1.50 – 1.597 — mid-term resistance.
Target 3: 1.85 – 2.09 — major supply zone; if momentum remains, extend to 2.38 – 2.49.
Risk management:
Initial stop-loss below retest area or under 0.95 (adjust to position size).
Consider trailing stops for strong momentum moves.
---
Bearish Scenario (rejection / continuation)
Bearish trigger (confirmation):
1. Rejection at trendline: long upper wick + daily close back under 1.18 without volume confirmation on buying.
2. Increasing sell volume during rejection and follow-through.
Downside targets:
Target 1: 0.95–1.00 (intraday support).
Target 2: 0.80 (mid-level support).
Target 3: if breakdown continues, retest major low at 0.611.
Short strategy on confirmation:
Enter after rejection candle with volume confirmation; stop-loss above wick high / slightly above trendline.
---
Key Signals to Watch Before Entry
1. Daily close — avoid acting solely on intraday wicks.
2. Volume — breakouts without strong volume are prone to failure.
3. Retest confirmation — ideal for safer entries after breakout.
4. Broader market context — BTC/DeFi sentiment can accelerate or reverse moves.
5. Orderflow / on-chain / Lido news — large unlocks or updates may trigger volatility.
---
Trading Plan Highlights
Position sizing: risk only 1–2% of capital per trade.
Measured stop-loss: under breakout retest or under 0.95 for longs; above rejection wick for shorts.
Take profits in stages at resistance zones; avoid aiming for one all-or-nothing target.
Prepare a contingency plan for false breakouts.
---
Final Note
LDO is at a decision point — whether to break the yellow trendline or get rejected will set the mid-term direction. Wait for confirmation (daily close + volume + retest) before committing capital, and maintain strict risk control.
---
Hashtags (for TradingView):
#LDOUSDT #LDO #Lido #Crypto #TechnicalAnalysis #Breakout #SwingTrade #RiskManagement
#LDO/USDT#LDO
The price is moving within a descending channel on the 1-hour frame, adhering well to it, and is on its way to breaking strongly upwards and retesting it.
We have support from the lower boundary of the descending channel, at 1.128.
We have a downtrend on the RSI indicator that is about to be broken and retested, supporting the upside.
There is a major support area in green at 1.10, which represents a strong basis for the upside.
Don't forget a simple thing: ease and capital.
When you reach the first target, save some money and then change your stop-loss order to an entry order.
For inquiries, please leave a comment.
We have a trend to hold above the 100 Moving Average.
Entry price: 1.139.
First target: 1.172.
Second target: 1.210.
Third target: 1.270.
Don't forget a simple thing: ease and capital.
When you reach your first target, save some money and then change your stop-loss order to an entry order.
For inquiries, please leave a comment.
Thank you.
