#LDO/USDT — Critical Retest at Demand Zone vs Long-Term Downt#LDO
The price is moving within a descending channel on the hourly timeframe. It has reached the lower boundary and is heading towards a breakout, with a retest of the upper boundary expected.
The Relative Strength Index (RSI) is showing a downward trend, approaching the lower boundary, and an upward bounce is anticipated.
There is a key support zone in green at 0.4090, and the price has bounced from this level several times and is expected to bounce again.
The indicator is showing a trend towards consolidation above the 100-period moving average, which we are approaching, supporting the upward move.
Entry Price: 0.4173
First Target: 0.4280
Second Target: 0.4400
Third Target: 0.4548
Stop Loss: Below the green support zone.
Remember this simple thing: Money management.
For any questions, please leave a comment.
Thank you.
Ldousdtrading

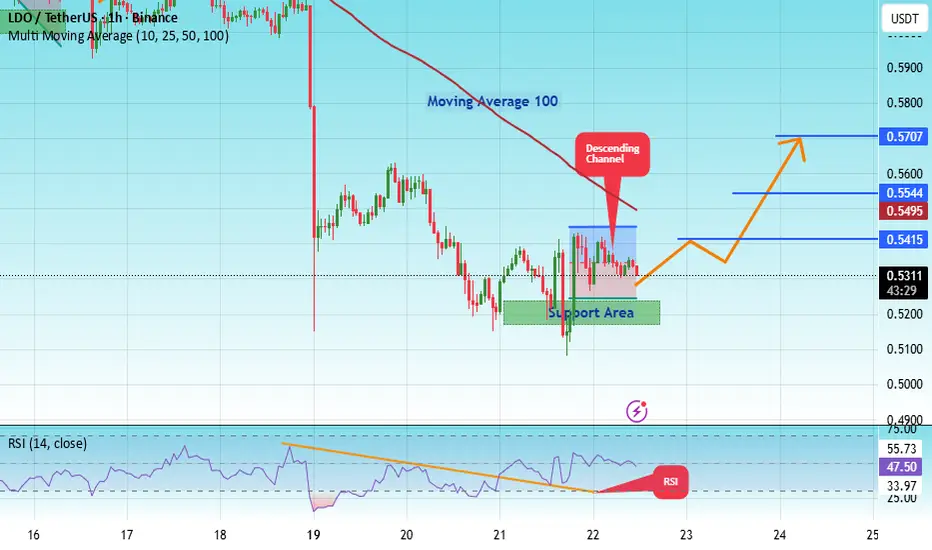
#LDO/USDT — Critical Retest at Demand Zone vs Long-Term Downt#LDO
The price is moving within a descending channel on the hourly timeframe. It has reached the lower boundary and is heading towards a breakout, with a retest of the upper boundary expected.
The Relative Strength Index (RSI) is showing a downward trend, approaching the lower boundary, and an upward bounce is anticipated.
There is a key support zone in green at 0.5200, and the price has bounced from this level several times and is expected to bounce again.
The indicator is showing a trend towards consolidation above the 100-period moving average, which we are approaching, supporting the upward move.
Entry Price: 0.5311
First Target: 0.5415
Second Target: 0.5544
Third Target: 0.5707
Stop Loss: Below the green support zone.
Remember this simple thing: Money management.
For any questions, please leave a comment.
Thank you.
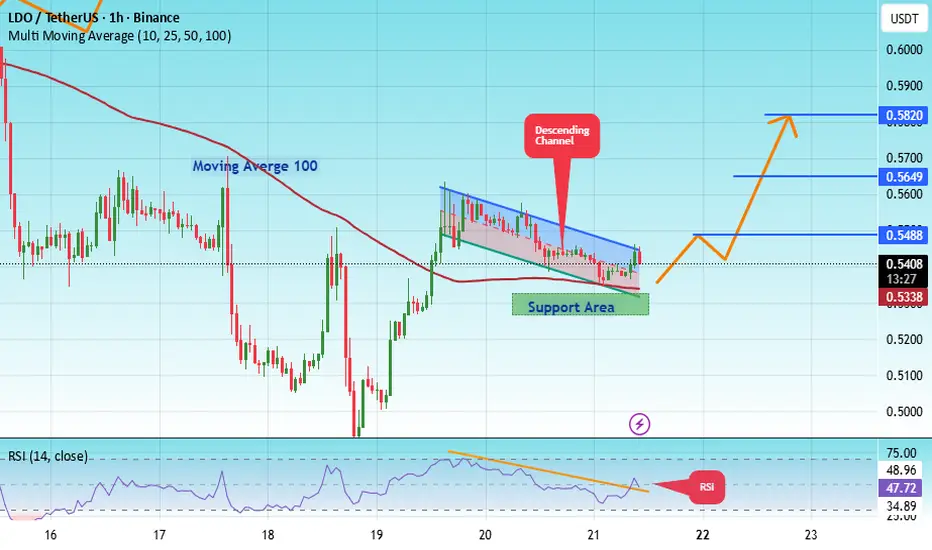
#LDO/USDT — Critical Retest at Demand Zone vs Long-Term Downt#LDO
The price is moving in a descending channel on the 1-hour timeframe. It has reached the lower boundary and is heading towards breaking above it, with a retest of the upper boundary expected.
We have a downtrend on the RSI indicator, which has reached near the lower boundary, and an upward rebound is expected.
There is a key support zone in green at 0.5300. The price has bounced from this level multiple times and is expected to bounce again.
We have a trend towards consolidation above the 100-period moving average, as we are moving close to it, which supports the upward movement.
Entry price: 0.5412
First target: 0.5488
Second target: 0.5650
Third target: 0.5820
Don't forget a simple principle: money management.
Place your stop-loss order below the green support zone.
For any questions, please leave a comment.
Thank you.
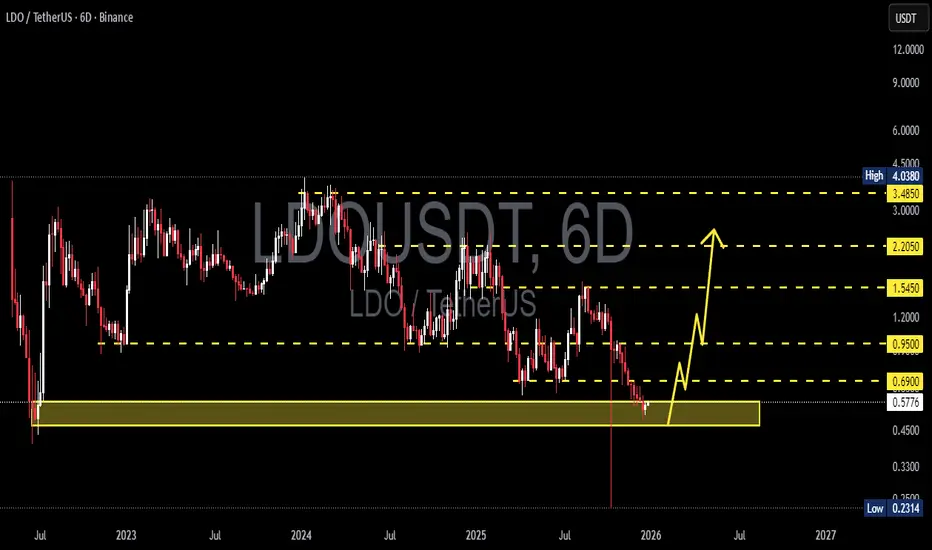
LDO/USDT – Hold for a Bounce or Break for CapitulationLDO/USDT on the 6D timeframe (Binance) is currently in a strong bearish continuation phase after failing to maintain its bullish structure from the 3.48–4.03 peak area. Price has now declined into a major historical demand zone, highlighted by the yellow box at 0.5785 – 0.470.
This zone represents a key long-term support area and could act as the last major defense for buyers before a deeper bearish move.
---
Market Structure & Trend
Primary trend: Bearish
Consistent Lower Highs (LH) and Lower Lows (LL)
Previous bullish structure has been fully invalidated
Price remains below all major higher-timeframe resistance levels
Bearish momentum is still dominant, although it is slowing as price reaches demand
---
Technical Pattern Explanation
1. Bearish Market Structure Breakdown
Price continues to respect a bearish structure, confirming long-term distribution.
2. Descending Range / Loose Bearish Channel
Price action forms a declining range with weak bullish reactions at each resistance:
0.95
1.545
2.205
3. Strong Historical Demand Zone
The 0.5785 – 0.470 zone:
Previously triggered strong bullish reactions
Acts as a historical accumulation area
High probability zone for institutional demand if buyers step in
---
Key Levels
Support:
0.5785 – 0.470 (Major Demand Zone)
Below this zone: 0.231 (Historical Low)
Resistance:
0.690
0.950
1.545
2.205
3.485 (Major Supply Zone)
---
Bullish Scenario
The bullish scenario is valid only if:
Price holds above 0.470
Strong rejection candles / long lower wicks appear inside the demand zone
Followed by a break and close above 0.690
Bullish Targets:
0.690
0.950
1.545
Extended target: 2.205
Note: This is a counter-trend setup, suitable for accumulation or speculative swing trades, not a confirmed trend reversal.
---
Bearish Scenario
Bearish continuation occurs if:
Price closes below 0.470
The demand zone fails to hold
No significant buyer reaction appears
Bearish Targets:
0.330
0.231 (Historical Low)
A clean breakdown would likely trigger a capitulation move.
---
Conclusion
LDO is currently trading at a critical long-term decision zone.
The 0.5785 – 0.470 area acts as the final support zone for buyers.
Holding this zone → potential relief rally or accumulation phase
Breaking below → high risk of accelerated bearish continuation
Patience and price action confirmation are strongly recommended.
#LDOUSDT #LDO #CryptoAnalysis #TechnicalAnalysis #Altcoin #DemandZone #SupportResistance #BearishMarket #PotentialReversal
#LDO/USDT — Critical Retest at Demand Zone vs Long-Term Downtr#LDO
The price is moving within an ascending channel on the 1-hour timeframe and is adhering to it well. It is poised to break out strongly and retest the channel.
We have a downtrend line on the RSI indicator that is about to break and retest, which supports the upward move.
There is a key support zone in green at 0.7400, representing a strong support point.
We have a trend of consolidation above the 100-period moving average.
Entry price: 0.7514
First target: 0.7640
Second target: 0.7879
Third target: 0.8140
Don't forget a simple money management rule:
Place your stop-loss order below the green support zone.
Once you reach the first target, save some money and then change your stop-loss order to an entry order.
For any questions, please leave a comment.
Thank you.

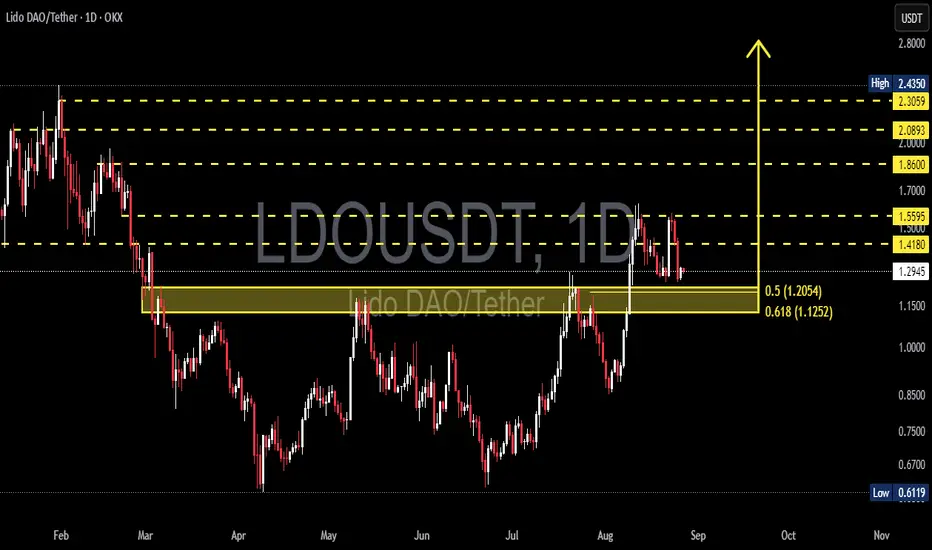
LDO/USDT — Breakout, Retest, and the Critical Demand Zone!🔎 Market Structure
LDO price is currently hovering around 1.29 USDT after breaking out of a long accumulation phase from the 0.61 low. Technically, the market has just made a significant breakout, but is now undergoing a healthy pullback to retest a key demand zone.
The 1.205 – 1.125 zone is the main focus because:
It aligns with the Fibonacci retracement 0.5 & 0.618, also known as the “golden zone.”
Acts as a flip zone (previous resistance → potential support/demand).
If this zone holds, LDO may continue its bullish momentum with higher upside targets.
---
🟢 Bullish Scenario
As long as price holds above 1.205 – 1.125, bullish momentum remains valid.
Long lower wicks at this demand area may indicate buyer absorption/accumulation.
Upside targets if demand holds:
1.418 → 1.5595 → 1.86 → 2.0893 → 2.3059 → 2.4350 (high from the chart).
A confirmed daily close above 1.418 would strengthen the bullish outlook.
📌 Strategy: Accumulate around 1.20–1.12 or wait for breakout confirmation above 1.418. Stop-loss below 1.10. Mid-term targets 1.55–1.86; long-term extension up to 2.30–2.43.
---
🔴 Bearish Scenario
If price closes daily below 1.125, the demand zone fails to hold.
This could trigger a deeper correction towards 0.85, and in extension, back to the 0.61 low.
A breakdown of such a strong demand zone usually accelerates selling pressure.
📌 Strategy: Short entries only valid if daily close confirms below 1.125 with strong volume. Downside targets: 0.85 → 0.61. Stop-loss above 1.25.
---
📈 Pattern & Sentiment
Key pattern: Breakout from accumulation + retest of golden zone.
Sentiment: Neutral–bullish as long as demand zone holds. Watch out for liquidity sweeps below 1.125.
Volume: Bullish confirmation requires increasing buy volume on rebounds.
---
✅ Conclusion
Bullish case: Holding the 1.205–1.125 golden zone → continuation towards 1.418–1.5595 and higher levels.
Bearish case: Daily close below 1.125 → deeper correction to 0.85–0.61.
LDO is at a critical decision point: continuation of the uptrend or rejection into a broader correction.
#LDO #LDOUSDT #Lido #CryptoAnalysis #Altcoin #Fibonacci #Breakout #SwingTrade #CryptoSignals
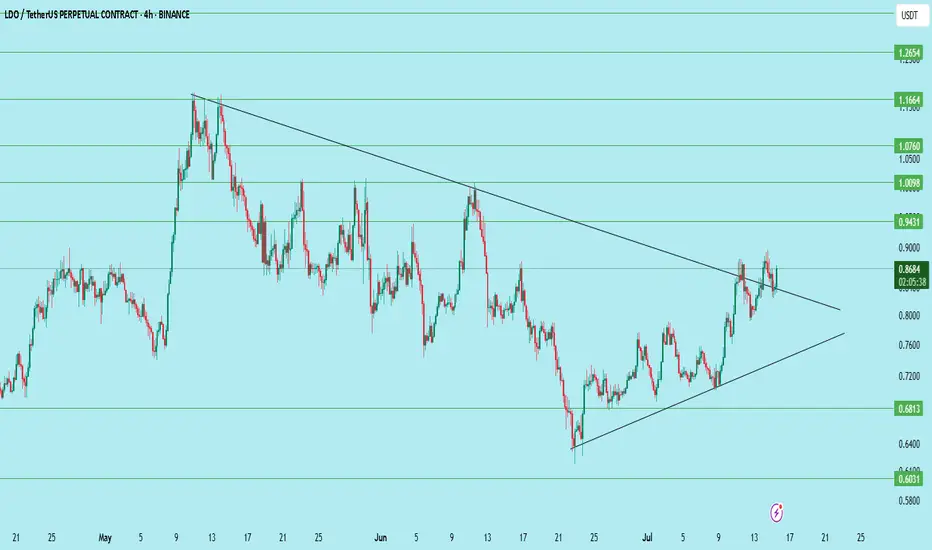
LDO/USDT – Symmetrical Triangle Breakout SetupLDO is trading just below a major downtrend line and forming higher lows, compressing into a symmetrical triangle. A breakout looks close!
Chart Insights:
Price approaching resistance around $0.87–$0.88
Strong structure of higher lows holding since June
A breakout above the trendline can trigger a strong move
Trade Setup:
Entry: On breakout above $0.88
Stoploss: Below $0.81
Targets:
T1: $0.943
T2: $1.009
T3: $1.076
T4: $1.166
T5: $1.265
Good volume confirmation will strengthen the move. Watch closely!
DYOR | Not financial advice
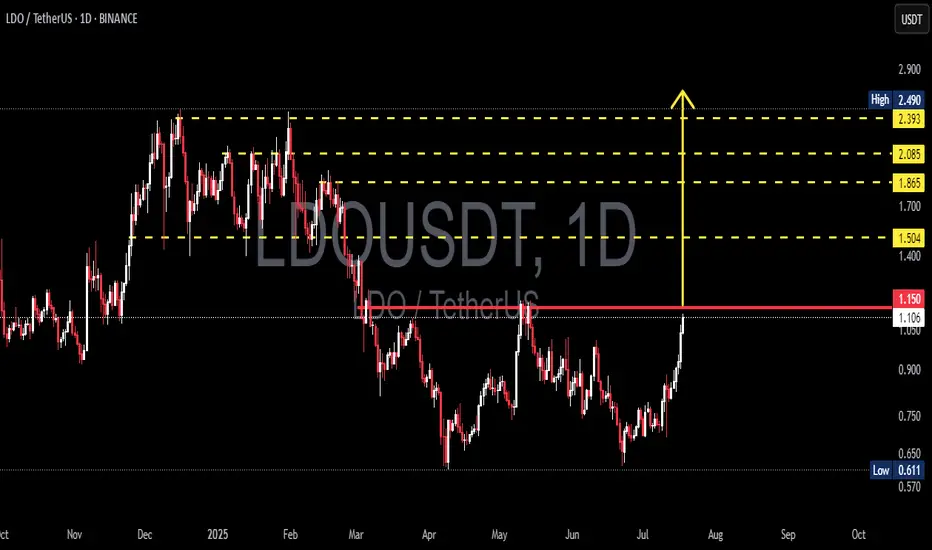
LDO/USDT Breakout Watch Ready to Fly After a Strategic Breakout?🔍 Full Technical Analysis
After months of downtrend and tight consolidation, LDO/USDT is showing clear signs of a bullish resurgence. The breakout above the key psychological resistance at $1.15 opens up a wide path toward higher resistance zones, potentially marking the beginning of a strong upward trend.
📐 Key Pattern Formed:
✅ Double Bottom Pattern
> Clearly visible from May to July 2025, with a neckline at $1.15. This is a classic bullish reversal pattern. The breakout above the neckline confirms the setup, projecting a significant upward move based on the measured height of the pattern.
✅ Horizontal Resistance Breakout
> The $1.15 level acted as a major resistance since April 2025. A clean breakout above it suggests that bulls are regaining control of the market momentum.
✅ Bullish Scenario (Primary Bias)
If the price successfully holds above the $1.15 zone and confirms it as support (successful retest), we may witness a bullish rally targeting the following levels:
🎯 Target 1: $1.504
— A minor resistance and previous consolidation area.
🎯 Target 2: $1.865
— A strong resistance level from earlier distribution zones.
🎯 Target 3: $2.085
— A technically significant level and key reaction point from past price action.
🎯 Target 4: $2.393 – $2.490
— A major supply zone and swing high from early 2025. This serves as the potential final target of the current bullish leg.
🟢 Volume increased during the breakout — a strong confirmation signal that this move is genuine, not a fakeout.
🟢 RSI likely gaining strength — though not shown on this chart, momentum indicators are likely supporting the move with a breakout from neutral levels.
❌ Bearish Scenario (If Breakout Fails)
If the price fails to hold above $1.15 and drops back below $1.05:
🔻 Potential Fakeout Risk
— A correction could send LDO back to:
Minor support at $0.90
Base support at $0.75
Major support at $0.611 (2025’s low)
📉 A breakdown below $0.611 would invalidate the bullish structure entirely, putting LDO back into a strong downtrend.
📊 Final Thoughts:
> LDO/USDT is at a critical decision point. A clean breakout from a strong medium-term structure opens the door for a significant bullish continuation. With pattern confirmation and strong volume support, this setup could mark the beginning of a mid-term uptrend.
The key lies in holding above $1.15 and watching for a healthy retest. This is a premium setup for swing traders and trend followers looking for early entries before a possible major move.
🧠 Trading Tips:
✅ Ideal Entry: On successful retest around $1.15 – $1.10
❌ Stop Loss: Below $1.00
📈 Targets: $1.50, $1.85, $2.08, and $2.49 (scaling out recommended)
#LDO #LDOUSDT #CryptoBreakout #AltcoinRally #TechnicalAnalysis #DoubleBottom #CryptoSignals #TradingViewIdeas #SwingTradeSetup #BullishPattern
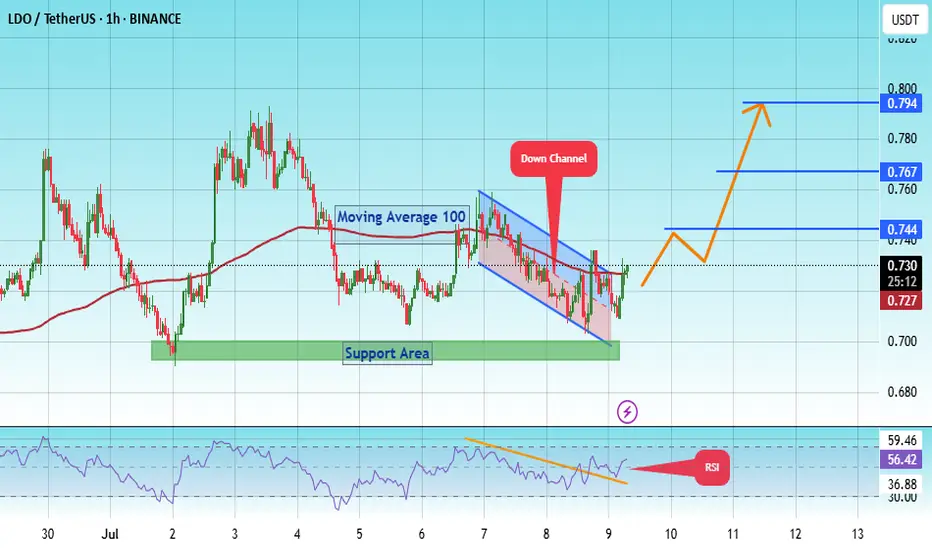
#LDO PUMP TO $ 0.794 ?#LDO
The price is moving within a descending channel on the 1-hour frame, adhering well to it, and is on its way to breaking it strongly upwards and retesting it.
We have a bounce from the lower boundary of the descending channel. This support is at 0.703.
We have a downtrend on the RSI indicator that is about to break and retest, supporting the upside.
There is a major support area in green at 0.695, which represents a strong basis for the upside.
Don't forget a simple thing: ease and capital.
When you reach the first target, save some money and then change your stop-loss order to an entry order.
For inquiries, please leave a comment.
We have a trend to hold above the 100 Moving Average.
Entry price: 0.730
First target: 0.744
Second target: 0.767
Third target: 0.794
Don't forget a simple thing: ease and capital.
When you reach the first target, save some money and then change your stop-loss order to an entry order.
For inquiries, please leave a comment.
Thank you.
LDOUSDT 1D AnalysisLDO ~ 1D Analysis
#LDO Buy gradually after retesting this support block with a short term target of at least 10%+ from here.

LDOUSDT 4D Analysis LDO ~ 4D Analysis
#LDO Buy gradually from here if you still have confidence in this coin with a short term target of at least 20%++

#LDO/USDT#LDO
The price is moving within a descending channel on the 1-hour frame, adhering well to it, and is heading for a strong breakout and retest.
We are experiencing a rebound from the lower boundary of the descending channel, which is support at 0.988.
We are experiencing a downtrend on the RSI indicator, which is about to break and retest, supporting the upward trend.
We are looking for stability above the 100 Moving Average.
Entry price: 1.008
First target: 1.022
Second target: 1.042
Third target: 1.067

LDOUSDT 1D AnalysisLDO ~ 1D Analysis
#LDO Buy after successfully penetrating this resistant line with a short -term target of at least 10%+ from here.

LDO - big lie - Many influencers have been touting this coin.
- the coin is found in the side
- the exit was down and I expect the downtrend to continue
if you like the idea, please "Like" it. This is the best "Thanks!" for the author 😊 P.S. Always do your own analysis before a trade. Put a stop loss. Fix profits in installments. Withdraw profits in fiat and please yourself and your friends.

LDOUSDT 4DLDO ~ 4D Analysis
#LDO Buy when visiting this support with a short -term target of at least 15%+.

LDOUSDT 1WLDO ~ 1W Analysis
#LDO So far it still continues to maintain this support. Buy gradually from here with a short -term target of at least 20%+.

#LDO/USDT#LDO
The price is moving in a descending channel on the 1-hour frame and is adhering to it well and is heading to break it upwards strongly and retest it
We have a bounce from the lower limit of the descending channel, this support is at a price of 1.20
We have a downtrend on the RSI indicator that is about to break and retest, which supports the rise
We have a trend to stabilize above the moving average 100
Entry price 1.23
First target 1.28
Second target 1.34
Third target 1.41

#LDO/USDT#LDO
The price is moving in a descending channel on the 1-hour frame and is adhering to it well and is heading to break it upwards strongly and retest it
We have a bounce from the lower limit of the descending channel, this support is at a price of 1.64
We have a downtrend on the RSI indicator that is about to break and retest, which supports the rise
We have a trend to stabilize above the moving average 100
Entry price 1.71
First target 1.80
Second target 1.87
Third target 1.95

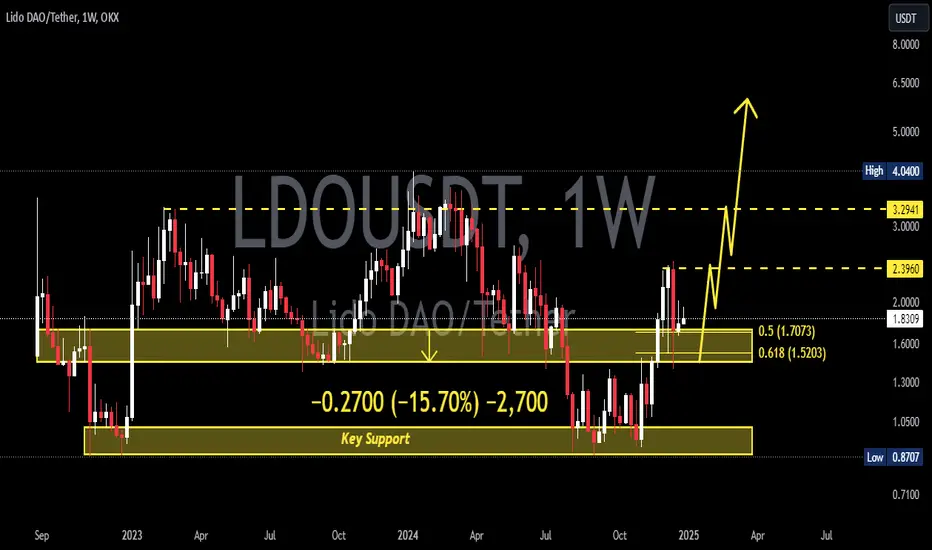
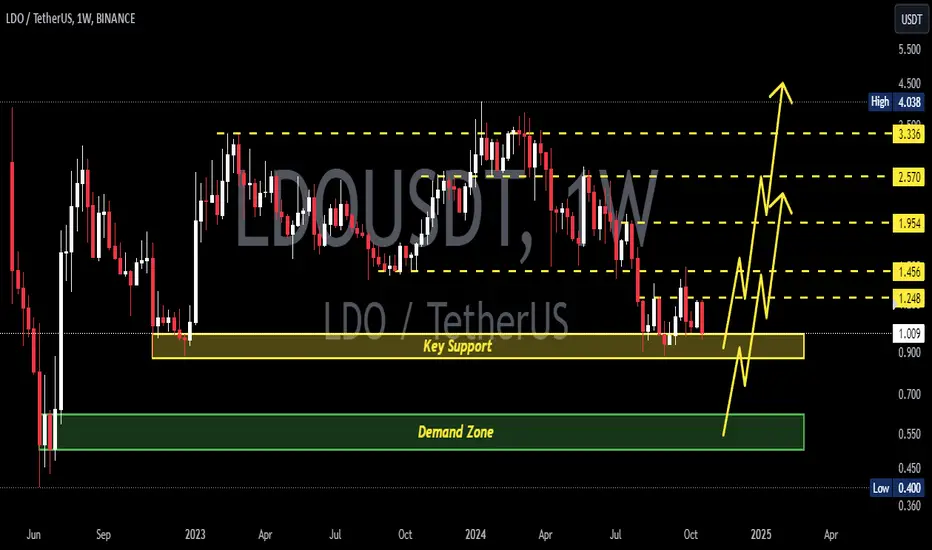
LDO/USDT Consolidates: Ready for a Breakout After 917 Days?$LDO/USDT is currently trading within a wide sideways range for the past 917 days, consolidating between the key demand/support zone and the key supply/resistance zone.
A potential bullish breakout could occur if the price breaks and sustains above the upper marked resistance zone.
This breakout may lead to a significant upward move, making it a critical level to watch.
DYOR, NFA

LDOUSDT 1WLDO Update ~ 1W
#LDO So far it continues to maintain its bullish structure. This is a very good support Block for gradual rebuys. With a minimum target of 20%+
LDO target $1.984h time frame
-
Entry: $1.24
TP: $1.9875
SL: $1.0575
RR: 4.1
-
(1) Symmetrical structure is creating, high possibility to reach previous high
(2) Strong pump recently that bring LDO from $0.87 to $1.45 in two days
(3) Getting support at fib 0.618, which is $1.24
(4) $2.5 will be easy to hit if momentum is enough based on the flipped structure
(5) Stop loss once going below $1.0575

LDOUSDTLDO ~ 1W
#LDO If you still have Conviction on this coin,. You can place your first purchase on this support block. and you can place the second purchase on the next support block.
LDOUSDTLDO ~ 1W ✅
MIL:LDO Our first purchase will be active here.
❗ We will make a second purchase if this key support is unable to withstand bear pressure. and of course you already know our target price for this scenario.
