#LEVER/USDT Potential liquidity sweep and pump#LEVER
The price is moving in a descending channel on the 1-hour timeframe. It has reached the lower boundary and is heading towards breaking above it, with a retest of the upper boundary expected.
We have a downtrend on the RSI indicator, which has reached near the lower boundary, and an upward rebound is expected.
There is a key support zone in green at 0.00001901. The price has bounced from this zone multiple times and is expected to bounce again.
We have a trend towards consolidation above the 100-period moving average, as we are moving close to it, which supports the upward movement.
Entry price: 0.00002022
First target: 0.00002089
Second target: 0.00002234
Third target: 0.00002437
Don't forget a simple principle: money management.
Place your stop-loss below the support zone in green.
For any questions, please leave a comment.
Thank you.
LEVERUSDT

#LEVER/USDT Potential liquidity sweep and pump#LEVER
The price is moving in a descending channel on the 1-hour timeframe. It has reached the lower boundary and is heading towards breaking above it, with a retest of the upper boundary expected.
We have a downtrend on the RSI indicator, which has reached near the lower boundary, and an upward rebound is expected.
There is a key support zone in green at 0.00001560. The price has bounced from this zone multiple times and is expected to bounce again.
We have a trend towards consolidation above the 100-period moving average, as we are moving close to it, which supports the upward movement.
Entry price: 0.00002021
First target: 0.00002080
Second target: 0.00002156
Third target: 0.00002252
Don't forget a simple principle: money management.
Place your stop-loss below the support zone in green.
For any questions, please leave a comment.
Thank you.

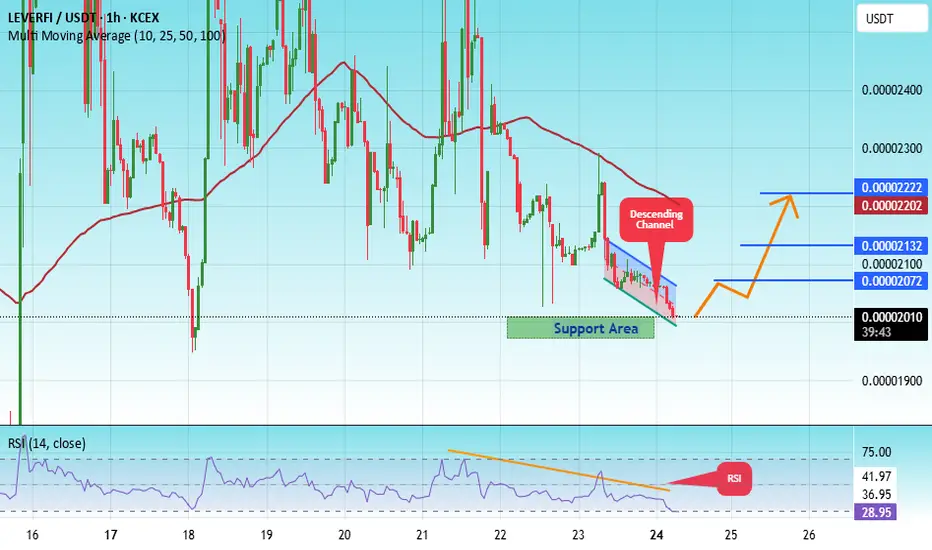
#LEVER/USDT Potential liquidity sweep and pump#LEVER
The price is moving within an ascending channel on the 1-hour timeframe and is adhering to it well. It is poised to break out strongly and retest the channel.
We have a downtrend line on the RSI indicator that is about to break and retest, which supports the upward move.
There is a key support zone in green at 0.00001992, representing a strong support point.
We have a trend of consolidation above the 100-period moving average.
Entry price: 0.00002009
First target: 0.00002072
Second target: 0.00002132
Third target: 0.00002222
Don't forget a simple money management rule.
Place your stop-loss order below the green support zone.
Once you reach the first target, save some money and then change your stop-loss order to an entry order.
For any questions, please leave a comment.
Thank you.
#LEVER/USDT Potential liquidity sweep and pump#LEVER
The price is moving within an ascending channel on the 1-hour timeframe and is holding well. It is poised to break out strongly and retest the channel.
We have a downtrend line on the RSI indicator that is about to break and retest, which supports the upward move.
There is a key support zone in green at 0.00002032, representing a strong support point.
We have a trend of consolidation above the 100-period moving average.
Entry price: 0.00002266
First target: 0.00002450
Second target: 0.00002610
Third target: 0.00002826
Don't forget a simple money management rule.
Place your stop-loss order below the green support zone.
Once you reach the first target, save some money and then change your stop-loss order to an entry order.
For any questions, please leave a comment.
Thank you.

#LEVER/USDT Potential liquidity sweep and pump#LEVER
The price is moving within an ascending channel on the 1-hour timeframe and is adhering to it well. It is poised to break out strongly and retest the channel.
We have a downtrend line on the RSI indicator that is about to break and retest, which supports the upward move.
There is a key support zone in green at 0.00002185, representing a strong support point.
We have a trend of consolidation above the 100-period moving average.
Entry price: 0.00002250
First target: 0.00002295
Second target: 0.00002350
Third target: 0.00002414
Don't forget a simple money management rule.
Place your stop-loss order below the green support zone.
Once you reach the first target, save some money and then change your stop-loss order to an entry order.
For any questions, please leave a comment.
Thank you.

#LEVER/USDT Pump Anticipated#LEVER
The price is moving within a descending channel on the 1-hour frame, adhering well to it, and is heading for a strong breakout and retest.
We have a bearish trend on the RSI indicator that is about to be broken and retested, which supports the upward breakout.
There is a major support area in green at 0005705, representing a strong support point.
We are heading for consolidation above the 100 moving average.
Entry price: 0.0006015
First target: 0.0006441
Second target: 0.0006900
Third target: 0.0007600
Don't forget a simple matter: capital management.
When you reach the first target, save some money and then change your stop-loss order to an entry order.
For inquiries, please leave a comment.
Thank you.

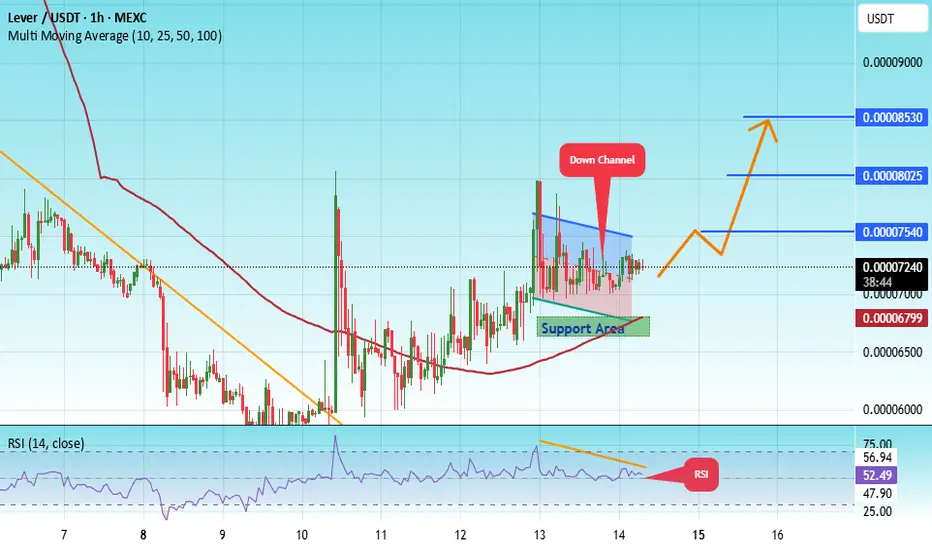
#LEVER/USDT Forming Strong Falling Wedge#LEVER
The price is moving within a descending channel on the 1-hour frame, adhering well to it, and is heading for a strong breakout and retest.
We have a bearish trend on the RSI indicator that is about to be broken and retested, which supports the upward breakout.
There is a major support area in green at 00006680, which represents a strong support point.
For inquiries, please leave a comment.
We are in a consolidation trend above the 100 moving average.
Entry price: 0.00007260
First target: 0.00007540
Second target: 0.00008000
Third target: 0.00008530
Don't forget a simple matter: capital management.
When you reach the first target, save some money and then change your stop-loss order to an entry order.
For inquiries, please leave a comment.
Thank you.
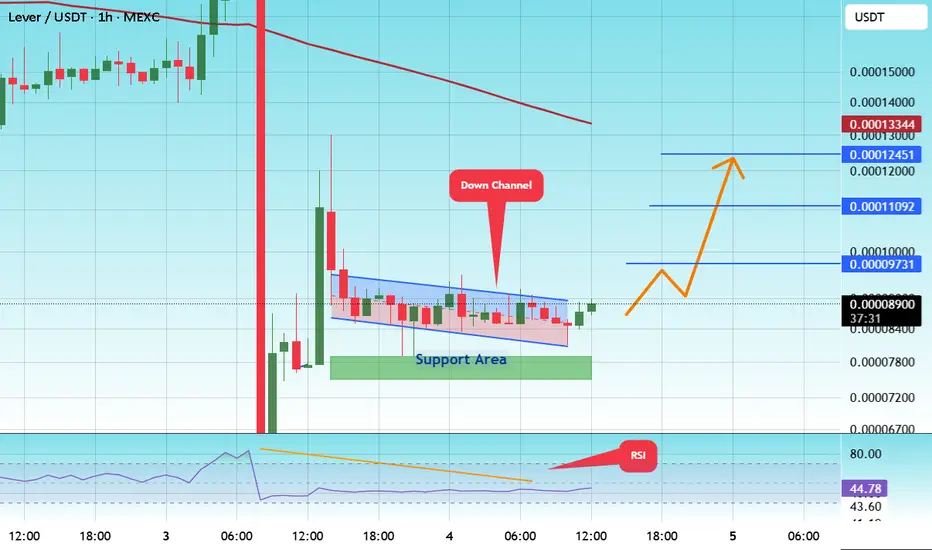
#LEVER/USDT Forming Strong Falling Wedge#LEVER
The price is moving within a descending channel on the 1-hour frame and is expected to break and continue upward.
We have a trend to stabilize above the 100 moving average once again.
We have a downtrend on the RSI indicator that supports the upward break.
We have a support area at the lower boundary of the channel at 0.00008220, acting as strong support from which the price can rebound.
We have a major support area in green that pushed the price upward at 0.00007700.
Entry price: 0.0008760.
First target: 0.00009730.
Second target: 0.00011092.
Third target: 0.00012450.
To manage risk, don't forget stop loss and capital management.
When you reach the first target, save some profits and then change the stop order to an entry order.
For inquiries, please comment.
Thank you.
#LEVER/USDT Forming Strong Falling Wedge#LEVER
The price is moving within a descending channel on the 1-hour frame, adhering well to it, and heading for a strong breakout and retest.
We have a bearish trend on the RSI indicator that is about to be broken and retested, which supports the upward breakout.
There is a major support area in green at 0.0001388, which represents a strong support point.
For inquiries, please leave a comment.
We are in a consolidation trend above the 100 moving average.
Entry price: 0.0001476
First target: 0.0001537
Second target: 0.0001656
Third target: 0.0001800
Don't forget a simple matter: capital management.
When you reach the first target, save some money and then change your stop-loss order to an entry order.
For inquiries, please leave a comment.
Thank you.

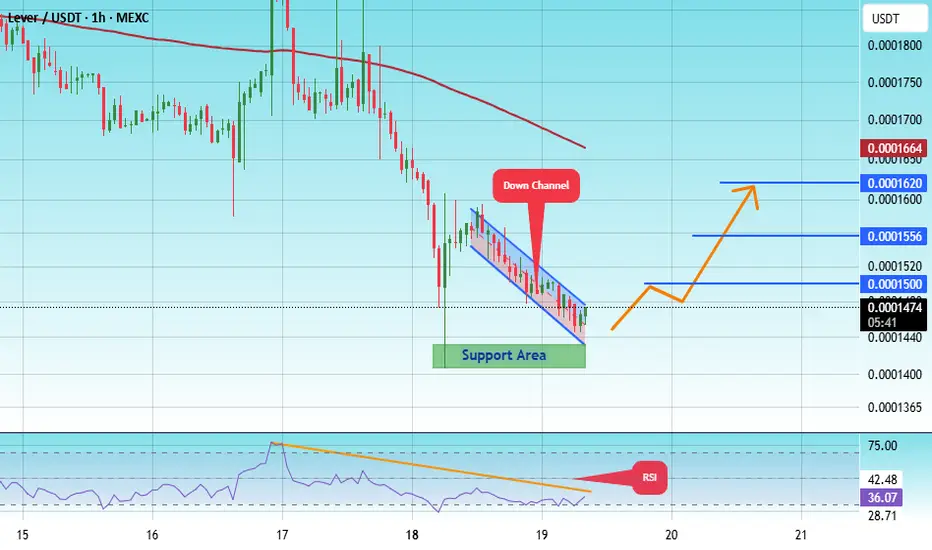
#LEVER/USDT Forming Strong Falling Wedge#LEVER
The price is moving within an ascending channel on the 1-hour frame, adhering well to it, and is poised to break it strongly upwards and retest it.
We have support from the lower boundary of the ascending channel, at 0.0001435.
We have a downtrend on the RSI indicator that is about to break and retest, supporting the upward trend.
There is a key support area in green at 0.0001412, which represents a strong basis for the upward trend.
Don't forget one simple thing: ease and capital.
When you reach the first target, save some money and then change your stop-loss order to an entry order.
For inquiries, please leave a comment.
We have a trend of stability above the Moving Average 100.
Entry price: 0.0001459
First target: 0.0001500
Second target: 0.0001556
Third target: 0.0001620
Don't forget one simple thing: ease and capital.
When you reach the first target, save some money and then change your stop-loss order to an entry order.
For inquiries, please leave a comment.
Thank you.
#LEVER/USDT#LEVER
The price is moving within an ascending channel on the 1-hour frame, adhering well to it, and is poised to break it strongly upwards and retest it.
We have support from the lower boundary of the ascending channel, at 0.0001800.
We have a downtrend on the RSI indicator that is about to break and retest, supporting the upward trend.
There is a key support area in green at 0.0001780, which represents a strong basis for the upward trend.
Don't forget one simple thing: ease and capital.
When you reach the first target, save some money and then change your stop-loss order to an entry order.
For inquiries, please leave a comment.
We have a trend of stability above the Moving Average 100.
Entry price: 0.0001877
First target: 0.0001938
Second target: 0.0002026
Third target: 0.0002110
Don't forget one simple thing: ease and capital.
When you reach the first target, save some money and then change your stop-loss order to an entry order.
For inquiries, please leave a comment.
Thank you.

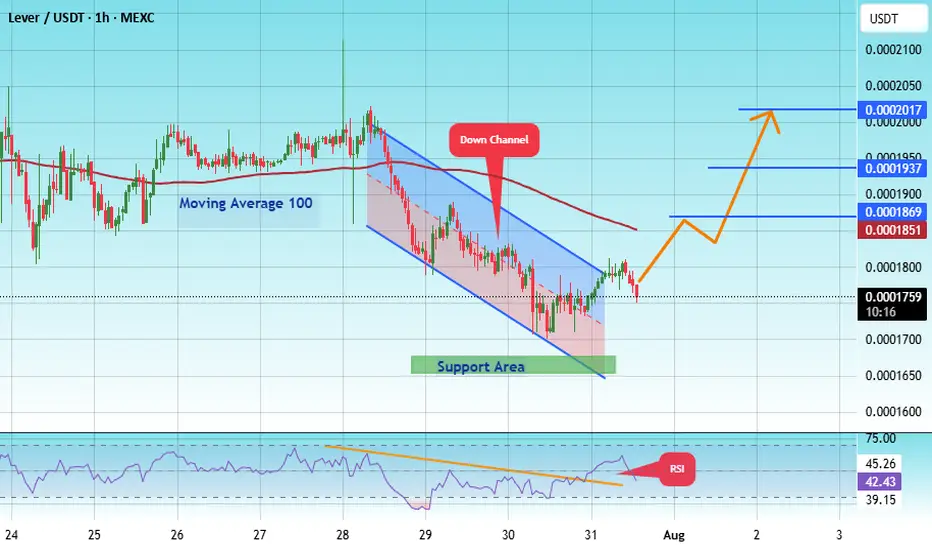
#LEVER/USDT#LEVER
The price is moving within an ascending channel on the 1-hour frame, adhering well to it, and is poised to break it strongly upwards and retest it.
We have support from the lower boundary of the ascending channel, at 0.0001664.
We have a downtrend on the RSI indicator that is about to break and retest, supporting the upward trend.
There is a key support area (in green) at 0.0001673, which represents a strong basis for the upward trend.
Don't forget one simple thing: ease and capital.
When you reach the first target, save some money and then change your stop-loss order to an entry order.
For inquiries, please leave a comment.
We have a trend of stability above the Moving Average 100.
Entry price: 0.0001757
First target: 0.0001870
Second target: 0.0001937
Third target: 0.0002017
Don't forget one simple thing: ease and capital.
When you reach the first target, save some money and then change your stop-loss order to an entry order.
For inquiries, please leave a comment.
Thank you.
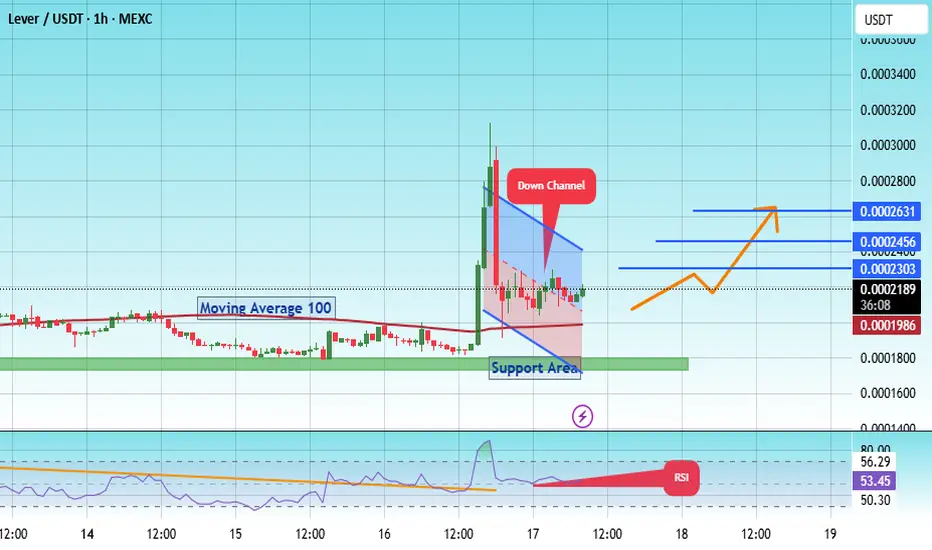
#LEVER/USDT #LEVER#LEVER
The price is moving within a descending channel on the 1-hour frame, adhering well to it, and is on its way to breaking it strongly upwards and retesting it.
We have support from the lower boundary of the descending channel, at 0.0001650.
We have a downtrend on the RSI indicator that is about to break and retest, supporting the upward trend.
There is a key support area (in green) at 0.0001764, which represents a strong basis for the upward trend.
Don't forget one simple thing: ease and capital.
When you reach the first target, save some money and then change your stop-loss order to an entry order.
For inquiries, please leave a comment.
We have a trend of stability above the Moving Average 100.
Entry price: 0.0002196
First target: 0.0002303
Second target: 0.0002456
Third target: 0.0002630
Don't forget one simple thing: ease and capital.
When you reach the first target, save some money and then change your stop-loss order to an entry order.
For inquiries, please leave a comment.
Thank you.
#LEVER/USDT Forming Strong Falling Wedge#LEVER
The price is moving within a descending channel on the 1-hour frame and is expected to break and continue upward.
We have a trend to stabilize above the 100 moving average once again.
We have a downtrend on the RSI indicator that supports the upward move with a breakout.
We have a support area at the lower boundary of the channel at 0.0001915, acting as a strong support from which the price can rebound.
We have a major support area in green that pushed the price upward at 0.0001672.
Entry price: 0.0001955.
First target: 0.0002087.
Second target: 0.0002283.
Third target: 0.0002472.
To manage risk, don't forget stop loss and capital management.
When you reach the first target, save some profits and then change the stop order to an entry order.
For inquiries, please comment.
Thank you.

#LEVER/USDT#LEVER
The price is moving within a descending channel on the 1-hour frame, adhering well to it, and is on its way to breaking it strongly upwards and retesting it.
We have a bounce from the lower boundary of the descending channel. This support is at 0.00016000.
We have a downtrend on the RSI indicator that is about to break and retest, supporting the upward trend.
There is a key support area in green at 0.0001500, which represents a strong basis for the upward trend.
Don't forget one simple thing: ease and capital.
When you reach the first target, save some money and then change your stop-loss order to an entry order.
For inquiries, please leave a comment.
We have a trend of stability above the Moving Average 100.
Entry price: 0.0001750
First target: 0.0001880
Second target: 0.0002163
Third target: 0.0002427
Don't forget one simple thing: ease and capital.
When you reach the first target, save some money and then change your stop-loss order to an entry order.
For inquiries, please leave a comment.
Thank you.

#LEVER/USDT#LEVER
The price is moving within a descending channel on the 1-hour frame and is expected to break and continue upward.
We have a trend to stabilize above the 100 moving average once again.
We have a downtrend on the RSI indicator that supports the upward break.
We have a support area at the lower boundary of the channel at 0.0001404, acting as strong support from which the price can rebound.
Entry price: 0.0001529
First target: 0.0001795
Second target: 0.0002040
Third target: 0.0002333
To manage risk, don't forget stop loss and capital management.
When you reach the first target, save some profits and then change the stop order to an entry order.
For inquiries, please comment.
Thank you.

#LEVER/USDT Bullish ?#LEVER
The price is moving within a descending channel on the 1-hour frame and is expected to break and continue upward.
We have a trend to stabilize above the 100 moving average once again.
We have a downtrend on the RSI indicator that supports the upward break.
We have a support area at the lower boundary of the channel at 0.000270, acting as a strong support from which the price can rebound.
We have a major support area in green that pushed the price upward at 0.000268.
Entry price: 0.000276.
First target: 0.000295.
Second target: 0.000315.
Third target: 0.000336.
To manage risk, don't forget stop loss and capital management.
When you reach the first target, save some profits and then change the stop order to an entry order.
For inquiries, please comment.
Thank you.

LEVERUSDT Forming Falling WedgeLEVERUSDT is showing a highly promising setup that’s generating buzz among traders and investors alike. The crypto pair is forming a classic Falling Wedge Pattern, which is widely recognized as a bullish reversal signal in technical analysis. This pattern often indicates that selling pressure is weakening and a breakout to the upside could be imminent. With volume picking up steadily, there is growing optimism that LEVERUSDT could deliver a significant price surge once it confirms a clean breakout above the wedge’s resistance line.
Many traders are particularly excited about LEVERUSDT because the expected gain for this setup is an impressive 160% to 170%+. This projection, combined with the clear technical pattern and rising investor interest, suggests that LEVERUSDT may soon become one of the standout performers in the altcoin market. The recent accumulation phase, reflected in steady volume inflows, hints that savvy traders are positioning themselves early ahead of a larger move.
Another important factor supporting this bullish outlook is the broader sentiment in the crypto market. As traders look for undervalued opportunities with high breakout potential, coins like LEVERUSDT that show strong bullish patterns and healthy trading activity become attractive bets. If the breakout confirms on the daily or 4H timeframe with sustained volume, it could trigger momentum-driven buying and push prices towards the projected targets.
For traders looking to diversify their crypto portfolio with high-potential setups, keeping a close watch on LEVERUSDT is definitely worthwhile. Remember to wait for a clear breakout confirmation before entering and manage your risk accordingly to make the most of this potential reversal.
✅ Show your support by hitting the like button and
✅ Leaving a comment below! (What is You opinion about this Coin)
Your feedback and engagement keep me inspired to share more insightful market analysis with you!

LEVERUSDT Forming Strong Falling WedgeLEVERUSDT is currently showing a strong Falling Wedge Pattern, a bullish reversal formation that often precedes sharp upward movements. The recent price structure suggests consolidation is ending, and buyers are preparing for a breakout. This setup, coupled with increasing volume, indicates accumulation at the lower end of the wedge and points toward a potential gain of 140% to 150%+ if the breakout confirms and momentum sustains.
LeverFi (LEVER) has gained traction among DeFi enthusiasts due to its innovative decentralized leverage trading platform. As more investors look to decentralized finance solutions, LEVER’s real-world utility is driving both user interest and investor confidence. This rise in engagement is reflected in recent price action, where bullish divergence and buying interest are becoming more evident on the charts.
The current chart pattern suggests the pair has formed a solid base, with decreasing selling pressure and a tightening range, which often leads to explosive moves once a breakout occurs. Traders will be watching key resistance levels above the wedge for breakout confirmation, and once surpassed, LEVERUSDT could trigger a rapid bullish continuation, attracting swing and momentum traders alike.
With strong fundamentals, rising community engagement, and a technically bullish chart, LEVERUSDT stands out as a potential outperformer in the current market phase. It's an ideal time for crypto traders to keep a close watch on this breakout opportunity.
✅ Show your support by hitting the like button and
✅ Leaving a comment below! (What is You opinion about this Coin)
Your feedback and engagement keep me inspired to share more insightful market analysis with you!

LEVERUSDT 1D AnalysisLEVER ~ 1D Analysis
#LEVER This trade is very risky. Buy if you still have confidence in this coin with a short term target of at least 15%+ from this support.

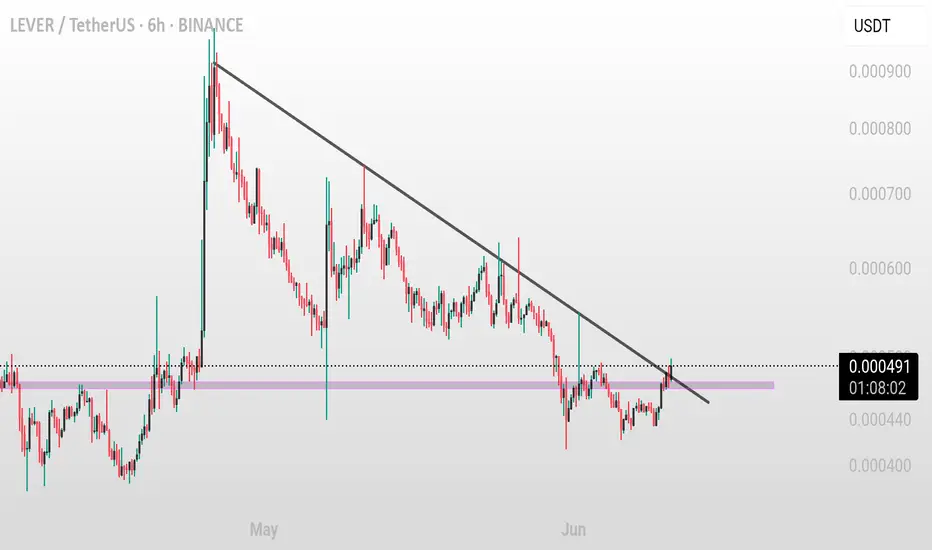
LEVER/USDT (6H) – Trendline Breakout in Progress LEVER/USDT (6H) – Trendline Breakout in Progress
Pattern: Descending Trendline Breakout
Timeframe: 6-Hour ⏱️
Pair: LEVER/USDT 💱
Published: June 10, 2025 📅
Technical Overview:
LEVER/USDT has been trading under a consistent downward trendline, making lower highs over several weeks. Price is now attempting a breakout above this resistance, showing signs of reversal and bullish momentum 📈
Potential Trade Setup:
Bullish Scenario ✅
Entry: On breakout and 6H candle close above 0.000520–0.000530
Targets:
* TP1: 0.000650–0.000680 🎯
* TP2: 0.000750–0.000800 🎯
Stop-loss: Below 0.000450–0.000460 🛑
Risk Management ⚠️
Wait for confirmation with strong candle close and volume to avoid fakeouts. If rejected, price may resume its downtrend or consolidate further.
Conclusion:
LEVER is testing a key resistance zone. Break and hold above trendline may confirm a trend reversal with upside potential 📊🔍
LEVER Looks Bullish (4H)The structure of the Lever symbol has turned bullish.
Within the internal substructure, we are looking for buy/long opportunities.
We have identified and marked two optimized entry points on the chart. These are the levels where we plan to open positions.
Target levels have been set.
A daily candle closing below the invalidation level will invalidate this analysis.
Do not enter the position without capital management and stop setting
Comment if you have any questions
thank you

LEVERUSDT 5DLEVER ~ 5D Analysis
#LEVER Buy gradually from here with a short -term target of at least 20%+.
