LICI (NSE: LICI) – Strong Earnings Surprise & Key Levels AheadTechnical Outlook (Daily)
Current Price: ₹924.15
Support Zones:
🟩 ₹890 – ₹875 (strong demand zone)
🟩 ₹850 (swing low support)
Resistance Zones:
🟥 ₹950 – ₹965 (immediate supply zone)
🏦 LICI (NSE: LICI) – Strong Earnings Surprise & Key Levels Ahead
Earnings Snapshot (Q2 FY25)
📅 Reported on: Nov 6, 2025
Earnings per share (EPS): ₹15.97
Estimate: ₹12.98
Surprise: +₹2.99 (+23.04%)
Revenue Estimate: ₹1.27T
LICI delivered a strong earnings beat, signaling solid operational performance and improved margins. The positive surprise has triggered renewed bullish sentiment in the stock.
⚙️ Possible Scenarios
Bullish Case:
If price sustains above ₹925 and breaks ₹965, we could see momentum toward ₹980 and eventually ₹1,040+. Strong earnings support the bullish bias.
Bearish Case:
A close below ₹890 could invite selling pressure, with next support near ₹850.
Licindia

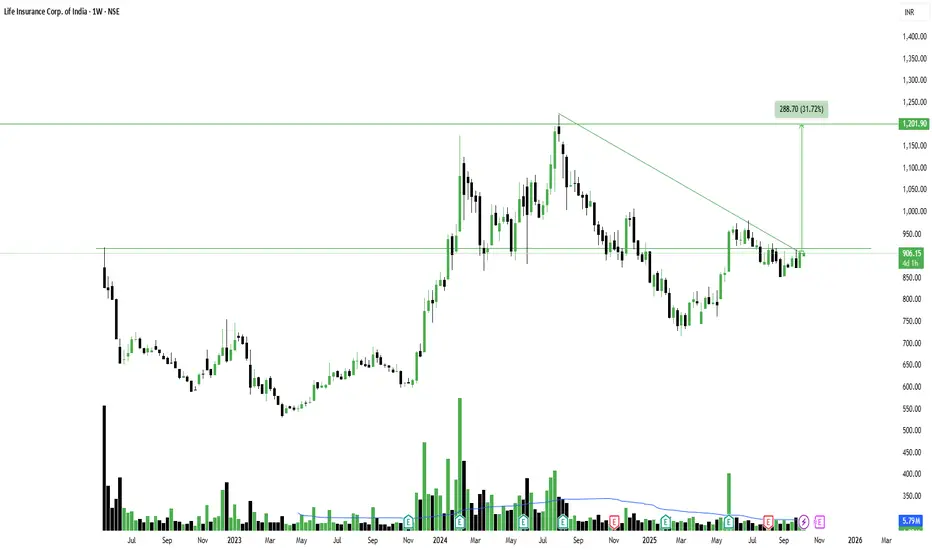
LICI - Weekly Chart Trendline BreakoutBreakout from Falling Trendline on Weekly Chart in LIC India
NSE:LICI
📈Pattern & Setup:
Life Insurance Corporation of India (LIC) is showing a potential breakout from a long-term falling trendline on the weekly chart. The stock has been consolidating just below the 900–920 zone, which has acted as a key resistance area multiple times in the past.
The current structure indicates that bulls are gradually gaining control, with price attempting to sustain above the trendline. Volume has started picking up, suggesting early accumulation before a possible breakout continuation.
📝 Trade Plan:
Entry: Accumulate between 900–910 levels (preferably on weekly closing confirmation above 915).
🚩Stop-Loss: 850 (below recent consolidation base).
🎯Targets:
Target 1 → 1040 (intermediate resistance).
Target 2 → 1200 (measured move target, 30% upside).
💡Pyramiding Strategy:
1. Enter first lot around 900–910.
2. Add above 940 on confirmed breakout with volume, trail SL to 880.
3. Add final lot above 1040 breakout, trail SL to 940.
🧠Logic Behind Selecting this Trade:
This setup is a clean example of a long-term trendline breakout after a prolonged correction phase. The price is forming higher lows with rising volume — a sign that the downtrend is weakening. Once it sustains above 915 on a weekly basis, the momentum could accelerate sharply towards 1200.
Keep Learning. Keep Earning.
Let's grow together 📚🎯
🔴Disclaimer:
This is not an investment advice. Always do your own due diligence before making any trading or investment decision.
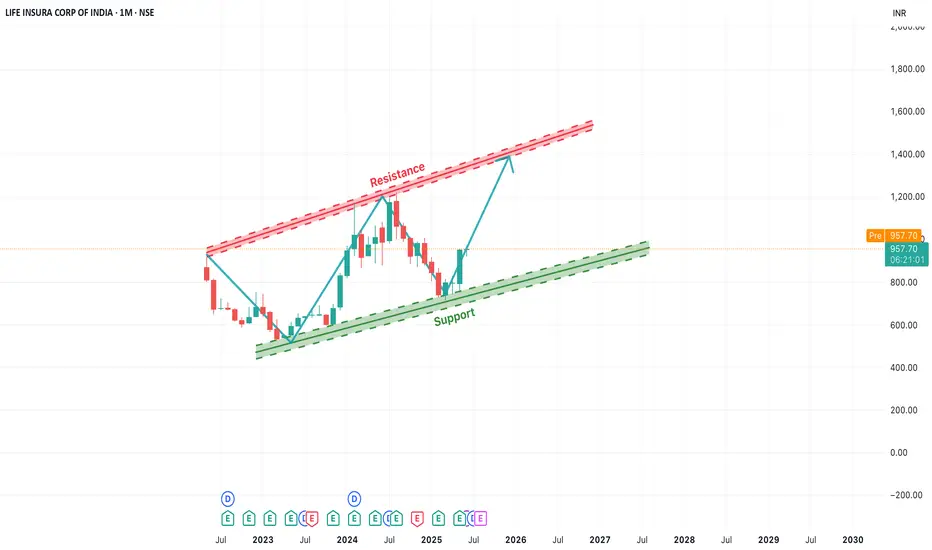
[Long-Term]LICI Rising Channel Pattern Indicates Bullish OutlookIn this monthly chart of LICI, we observe a clear ascending channel pattern forming over the past two years. The price has consistently respected both the support and resistance trendlines, creating a strong bullish structure.
Currently, the stock is bouncing off the lower support trendline, indicating a potential upward move towards the upper resistance zone. This offers a positive long-term outlook, especially if the momentum sustains. The key levels to watch are:
Support Zone: Around ₹850–₹900
Resistance Zone: ₹1250–₹1300
Traders and investors can monitor for a gradual rise toward the resistance level. A breakout beyond this channel may open up new highs, while a breakdown below the support trendline would invalidate the pattern.
LICI Trading Within Fresh Demand ZoneLICI is currently trading at ₹860.95, within a fresh demand zone ranging from ₹862.4 to ₹841.95, identified on 16th January 2024. This untested zone might attract buyer interest, offering a potential opportunity for investors.
Disclaimer: This analysis is for informational purposes only and should not be considered as financial advice. Please conduct your own research or consult a financial advisor before making any investment or trading decisions.

LICI Daily timeframe analysis for long
NSE:LICI has given strong breakout after bouncing from strong support zone.
Can add more till 925 only with SL 900.
Major Targets Highlighted in Blue lines, sub targets in grey lines.

LIC of India trying to make a comeback after consolidation.Life Insurance Corporation of India is the largest multinational insurance corporation and an institutional investor with an asset under management of more than 45 trillion INR. The company offers insurance plans, pension plans, unit linked plans, withdrawn plans and health plans with many other group schemes.
Life Insurance Corporation CMP is 635.75. Negative aspects of the company are declining cash from operations and MFs are decreasing stake. Positive aspects of the company are improving annual net profits, no debt and zero promoter pledge.
Entry after closing above 643. Target of the call will be 653 and 666. Long term targets in the stock will be 681 and 704. Stop loss in the stock should be maintained at closing below 595.

