Extreme Bearsish Divergence - LIGHT🐻 SHORT – LIGHT
LIGHT is showing clear overbought conditions across multiple timeframes. On the 1H chart, the combination of extreme overbought RSI and a rare bearish divergence signals momentum exhaustion. Price is rising and holding in an unnatural, unstable manner, which significantly increases the risk of a sharp sell-off.
🎯 TP: 0.2881
🛡️ SL: 2.5894
📊 RR: 1 : 6.5
A high-conviction short setup: multi-timeframe overbought + strong bearish divergence → elevated probability of a fast downside move.
LIGHTUSDT

Scalp SHORT – LIGHT🐻 Scalp SHORT – LIGHT
A textbook setup: a strong bearish divergence on the 15-minute timeframe while price has accelerated excessively into overbought territory. This parabolic advance reflects unhealthy price action and weakening momentum, a classic precursor to a sharp distribution phase. Probability favors a downside correction.
🎯 TP: 1.409
🛡️ SL: 3.28
📊 RR: 1 : 3.7
A clean short thesis: 15m bearish divergence + extreme overbought conditions → elevated risk of a sell-off with favorable risk-to-reward.

LIGHT / USDT remains Bullish above $1.34 - $1.16As long as LIGHT / USDT holds above the marked support zone of $1.34–$1.16, the structure remains bullish. These levels are key to watch, and any breakdown below this zone will invalidate the setup. Manage risk wisely and wait for confirmation.

LIGHT— Head & Shoulders Breakdown + Bear Flag TargetsA clear Head and Shoulders pattern has fully formed on the chart:
Left Shoulder
Head
Right Shoulder
After forming the right shoulder, the price created a bear flag , which is now breaking down — confirming bearish continuation.
This setup gives two downside targets:
1️⃣ Bear Flag Target: $0.55–0.47
The breakdown from the local rising structure (right shoulder flag) points to the first liquidity zone in the $0.55–0.47 range.
This is the nearest area where a reaction or short-term bounce may appear.
2️⃣ Head & Shoulders Target: $0.32–0.27
If the selloff continues and the full H&S pattern plays out, the measured move leads toward the deeper $0.32–0.27 zone — the main macro support area.
This confluence of a completed reversal pattern + a local bearish continuation structure significantly increases the probability of downward expansion.
Key Points:
Head & Shoulders fully formed
Bear flag breakdown on the right shoulder
First target: $0.55–0.47
Second target: $0.32–0.27

LIGHT is Bearish (4H)It seems that a large structure, which was a triangle, has completed, and we are now at the end of wave E. Look for a trigger for a sell/short position and enter the trade at the right point with proper risk management.
If the wave count is correct, LIGHTUSDT will remain in a corrective phase for a long time.
The short-term targets are marked on the chart.
A 4-hour candle closing above the invalidation level will invalidate this analysis.
For risk management, please don't forget stop loss and capital management
When we reach the first target, save some profit and then change the stop to entry
Comment if you have any questions
Thank You

Scalp SHORT – LIGHT🐻 Scalp SHORT – LIGHT
RSI on the 15m timeframe is extremely overbought and has formed a clear bearish divergence, signaling exhaustion in the current uptrend. Weakening volume confirms fading buying pressure. Price action is showing topping behavior, reinforcing the likelihood of a short-term correction.
🎯 TP: 1.2086
🛑 SL: 2.4231
📊 RR: 1 : 3.21

LIGHT VIEW HOW THE BREAKS CAN HAPPEN FROM BELOW $0,85 TO UP $2Licht is currently trading below $0.85. Based on trend data, once a low is confirmed, there is an 85% chance of a breakout. This analysis is supported by similar patterns observed in MYX and other coins that followed the same trajectory, as well as insights from the wallet DCA perspective.
The coin at this moment is below $0,85

FINALLY LIGHT CONFIRMS THE LOW TIME FRAME - BREAK UP $1.40Based on trend analysis, the chart shows a confirmed low-timeframe activation. This setup suggests that ALPINE could, with time, break above the $1.40 level and potentially move toward the main target around $2.
The trend is going in waves, we expect there will come a moment when this token will go out the normal trend of waves and against BTC to break up the $1.40

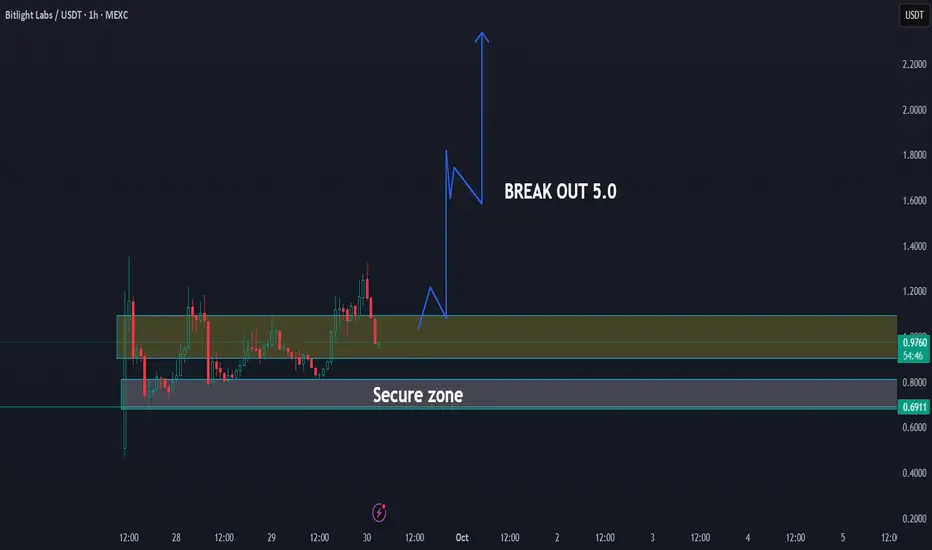
LIGHT CAN BREAKOUT AS MYX did before - UPDATE 30-09-2025LIGHT / USDT Trading Update
🔹 The coin is currently consolidating inside the secure zone, showing strong accumulation signs.
📊 As long as price holds this area, the probability of a major breakout remains high.
🚀 Similar to MYX, once momentum builds, this setup has the potential to break out toward the $2.00 level.
🔑 Key breakout confirmation will come once price clears the resistance zone.
📌 Summary:
Light is forming a strong base, and as long as the secure zone holds, the chart suggests a high chance for breakout, with the first major target set at $2.00.