ETH 1H Analysis - Key Triggers Ahead | Day 29❄️ Welcome to the cryptos winter , I hope you’ve started your day well.
⏰ We’re analyzing ETH on the 1-Hour timeframe .
👀 On the 1-hour chart , After breaking lower resistance zones, ETH started a strong bullish leg toward higher resistance. It reacted to these levels but moved upward with micro-buyer support. Currently at $4323, a key seller ticker zone—breaking this could push ETH higher. Note: Trend shows some weakness; sell candles are engulfed but smaller. Over 90% of holders are in profit, causing frequent stop-hunts on selling pressure.
🧮 RSI: After moving from near oversold to overbought, RSI is cooling near the 70 level. With increased long volatility, multiple buy positions could form, but rejection here may lead to a correction. Key static resistance is 70; swing support is at 50.
🕯 Volume & Candles: Recent candle size and volume surged as buyers entered, but approaching $4300 resistance shows trend weakness. Candle size decreased; profit-taking and minor pullbacks are possible. For trend continuation, higher volume and repeated buying pushing ETH toward overbought are needed.
📊 Liquidation Heatmap : Unlike BTC, long and short orders cluster sparsely, forming max-pain zones. ETH approaching $4380 could trigger a short squeeze and remove the seller ticker, pushing toward $4500. Next long max-pain is $4246, with lower support around $4100. ETH is in a near-decision zone with one bullish leg.
💸 ETHBTC Pair Currently in a trading range; the floor is Maker Buyer Zone , the ceiling is Taker Seller Zone. Price bounced well from the floor. High concentration of longs and shorts makes range boundaries critical—breaking either could trigger a sharp move. Price is near 0.037 resistance, RSI close to swing resistance. Buyer and whale support could enable another bullish leg; rejection may slightly increase risk of range breakdown.
🧠 Focus on BINANCE:ETHBTC wait for exit from the trading range, then check ETH/USDT. Often aligns with BTC dominance drops. Selling volume in ETHBTC is decent; if whales add volume, this setup provides optimal trade duration.
↗️ Risky Long Scenario: Break 0.037 resistance ETHBTC, BTC dominance drop, breaking ETH/USDT seller ticker, RSI stabilizes in overbought. Small stop-loss; trade is risky but viable.
📉 High-Risky Short Scenario: Rejection from current zone, ETH/BTC rejection, swing rejections, indecision candles multi-timeframe, SMA7 touch, and rising sell volume could signal short positions.
❤️ Disclaimer : This analysis is purely based on my personal opinion and I only trade if the stated triggers are activated .
Liquidationheatmap

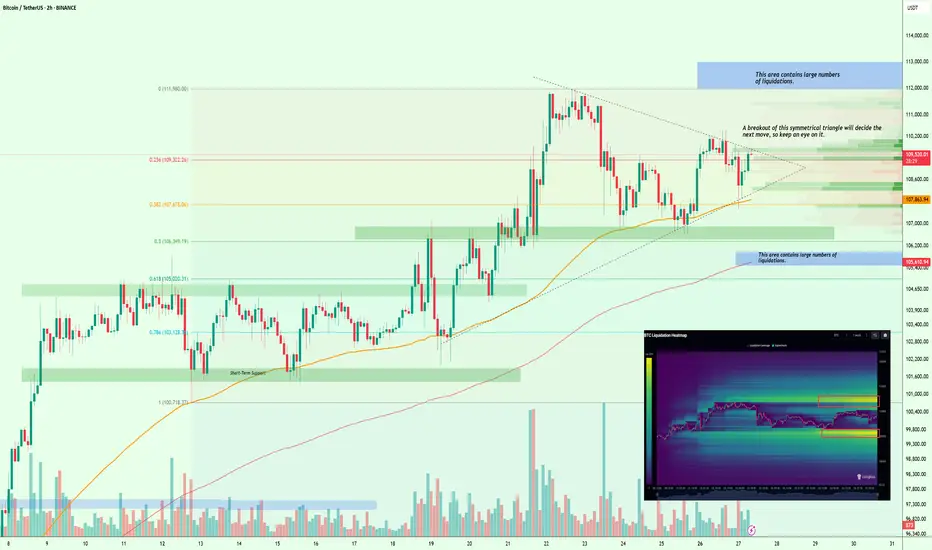
$BTC Liquidity Squeeze Incoming – Breakout or Breakdown?#Bitcoin
According to the liquidation heat map, CRYPTOCAP:BTC is building a large cluster of liquidations on both the upside and downside, creating some confusion in the market. However, the nearest major liquidation zone is around $112K–$113K, which increases the chances of a move toward that range.
Technically, BTC is forming a symmetrical triangle, and the breakout from this pattern will likely determine the next major move.
So keep a close eye on it.
I’ll keep you posted as things unfold.
If you find my updates helpful, don’t forget to like and follow for more!
Bitcoin LiquidationBitcoin Liquidation
there is Short & Long Liquidation price on binance
I look about the liquidity prices there is a huge liquidity
Long Liquidation red line's
59300
55600
Short Liquidation long line's
73650
67500

Bitcoin LiquidationBitcoin Liquidation
there is Short & Long Liquidation price on binance
I look about the liquidity prices there is a huge liquidity
Long Liquidation red line's
64200
62650
Short Liquidation long line's
71750
67700

Bitcoin LiquidationBitcoin Liquidation
there is Short & Long Liquidation price on binance
I look about the liquidity prices there is a huge liquidity
Long Liquidation red line's
62650
55700
Short Liquidation long line's
71800
70450

Bitcoin LiquidationBitcoin Liquidation
there is Short & Long Liquidation price on binance
I look about the liquidity prices there is a huge liquidity
Long Liquidation red line's
64150
62800
Short Liquidation long line's
73550
70500

Bitcoin LiquidationBitcoin Liquidation
there is Short & Long Liquidation price on binance
I look about the liquidity prices there is a huge liquidity
Long Liquidation red line's
66900
64150
Short Liquidation long line's
72350
70500

Bitcoin LiquidationBitcoin Liquidation
there is Short & Long Liquidation price on binance
I look about the liquidity prices there is a huge liquidity
Long Liquidation red line's
69850
68350
Short Liquidation long line's
77800
73550

Bitcoin LiquidationBitcoin Liquidation
there is Short & Long Liquidation price on binance
I look about the liquidity prices there is a huge liquidity
Long Liquidation red line's
68350
66650
Short Liquidation long line's
81000
74100

SingularityNET (AGIX): Sell-off far from overOn the 12-hour chart for AGIX, we’ve observed a significant rise from $0.22 at the beginning of the year to $1.47. Following this peak, the coin experienced a notable sell-off, testing but failing to break above the previous high. This decline brought us to our assumed Wave II, which stabilized around the level of Wave (4). Wave (4) is situated at approximately $0.594, which also coincides with the level of Wave (1) further left on the chart. This area has proven to be a strong support level. Since stabilizing, AGIX has been trading within a trend channel.
We see a potential scenario where AGIX might lose the support of the trend channel, leading to a retest of the High Volume Node Edge and the Point of Control. This retest could provide a foundation before any significant move towards $1.47.
Given the current market structure, we do not anticipate an easy breakout above $1.47 for AGIX without a retest. Therefore, we expect a pullback to between $0.75 and $0.67. After this retest, our target remains $1.47, but we will conduct a more detailed entry once the trend channel is broken.
The Liquidation Heatmap for AGIX provides additional insights into potential market movements. The heatmap reveals significant liquidation levels around the $0.748 mark. This concentration of liquidations suggests that the market might dip to this level to clear out these positions.
The presence of these liquidations adds weight to our expectation of a pullback to the $0.75 to $0.67 range. Clearing out these liquidations can provide a stronger foundation for an upward move.
In addition to the previously mentioned support levels, the heatmap reinforces the importance of these areas. The market often targets zones with high liquidation levels to reset positions and gather momentum for the next significant move. Therefore, we should be prepared for a potential dip to these levels before any substantial upward trend resumes.
On the quarterly VWAP chart, AGIX is trading within the range between the 2024 Q1 VAH (Volume-Weighted Average Price High) and the 2024 Q1 VWAP. We have tested the 2024 Q1 VAH multiple times, even briefly exceeding it twice, but we have consistently fallen back below this level.
The key question now is whether we will test this level again. If we do, it is possible that we might retest it. However, we believe the momentum and volume might be too strong to sustain another push above this level. Simultaneously, we are holding and respecting the current quarter's VAL (Volume-Weighted Average Price Low).
If we lose this support, it would likely be significant, potentially leading to a drop to the 2024 Q1 VWAP at around $0.72. This scenario aligns with our analysis from the liquidation heatmap and the 12-hour chart, supporting the idea of a pullback to lower levels before any substantial upward move.
In summary, while the possibility of retesting the 2024 Q1 VAH exists, losing the current quarter's VAL would likely confirm a move down to the $0.72 level.
On the 4-hour chart for AGIX, we have been trading in a range between the High-Volume Node Edge at $0.85 and $1.12 since mid-April. The Point-of-Control (POC) at $0.97 has frequently acted as both support and resistance. We expect this range-bound movement to continue. The key question is whether we will retest the supply level or the High-Volume Node Edge. This will require breaking above the POC.
Another possibility is losing the demand level and using it as a demand breaker to fulfill our future limit orders before moving higher. If we flip the supply level, our bearish scenario would be invalidated. However, if the supply holds, we might see another drop before any significant upward movement.
In summary, we expect continued ranging between $0.85 and $1.12. The next move will depend on whether we break above the POC or lose the demand level. Flipping the supply level would invalidate the bearish outlook, while holding the supply could lead to another dip.

Bitcoin LiquidationBitcoin Liquidation
there is Short & Long Liquidation price on binance
I look about the liquidity prices there is a huge liquidity
Long Liquidation red line's
66150
61850
Short Liquidation long line's
74950
70900

Bitcoin LiquidationBitcoin Liquidation
there is Short & Long Liquidation price on binance
I look about the liquidity prices there is a huge liquidity
Long Liquidation red line's
65450
61350
Short Liquidation long line's
81100
74450

Bitcoin LiquidationBitcoin Liquidation
there is Short & Long Liquidation price on binance
I look about the liquidity prices there is a huge liquidity
Long Liquidation red line's
65750
64450
Short Liquidation long line's
73600
72550

Bitcoin LiquidationBitcoin Liquidation
there is Short & Long Liquidation price on binance
I look about the liquidity prices there is a huge liquidity
Long Liquidation red line's
64350
60600
Short Liquidation long line's
80100
72350

#Bitcoin [ Inverted Head And Shoulders - Short Squeeze Combo ] BTCUSD has printed an allbeit slanted yet very nice inverted head and shoulders that has retested and played out perfectly so far. The measured move coincides with multiple high time frame short liquidation levels (Not marked on this chart) with the biggest level being a 6 MONTH high volume liquidation level at $74,045. This strong of a #shortsqueeze could easily amplify the measured move, which I have extended, using the 150%-161.8% fib levels. The extension also lines right up with where all short liquidation levels end on the Coinglass heat map.

Bitcoin LiquidationBitcoin Liquidation
there is Short & Long Liquidation price on binance
I look about the liquidity prices there is a huge liquidity
Long Liquidation red line's
60050
55150
Short Liquidation long line's
66850
63750

Bitcoin LiquidationBitcoin Liquidation
there is Short & Long Liquidation price on binance
I look about the liquidity prices there is a huge liquidity
Long Liquidation red line's
59900
55150
Short Liquidation long line's
66900
64600

Bitcoin LiquidationBitcoin Liquidation
there is Short & Long Liquidation price on binance
I look about the liquidity prices there is a huge liquidity
Long Liquidation red line's
60050
57700
Short Liquidation long line's
66150
64600

Bitcoin LiquidationBitcoin Liquidation
there is Short & Long Liquidation price on binance
I look about the liquidity prices there is a huge liquidity
Long Liquidation red line's
60700
56900
Short Liquidation long line's
69000
66150

Bitcoin LiquidationBitcoin Liquidation
there is Short & Long Liquidation price on binance
I look about the liquidity prices there is a huge liquidity
Long Liquidation red line's
60700
56900
Short Liquidation long line's
69700
66100

Bitcoin LiquidationBitcoin Liquidation
there is Short & Long Liquidation price on binance
I look about the liquidity prices there is a huge liquidity
Long Liquidation red line's
60700
56250
Short Liquidation long line's
69700
65000

Bitcoin LiquidationBitcoin Liquidation
there is Short & Long Liquidation price on binance
I look about the liquidity prices there is a huge liquidity
Long Liquidation red line's
56100
51550
Short Liquidation long line's
68850
65350

Bitcoin LiquidationBitcoin Liquidation
there is Short & Long Liquidation price on binance
I look about the liquidity prices there is a huge liquidity
Long Liquidation red line's
57800
51350
Short Liquidation long line's
69050
65400
