EUR/JPY Sell Momentum BuildsEUR/JPY has officially transitioned into a sell-side trend following clear exhaustion of its previous bullish cycle. The market structure shows consecutive lower highs and strong downside displacement, confirming that sellers are now in control of short-term momentum.
Recent liquidity sweeps above prior highs were quickly rejected, signaling institutional distribution and profit-taking. Order flow dynamics continue to favor the downside, with bearish impulses showing higher efficiency than any corrective rebounds.
Momentum and sentiment both align with sustained selling pressure. The pair is operating within a redistribution phase, and the market tone remains defensive as participants seek lower value zones.
Overall outlook: Bearish bias remains dominant. The market is expected to extend lower while maintaining controlled volatility until meaningful demand re-enters the market.
Liquiditysweep

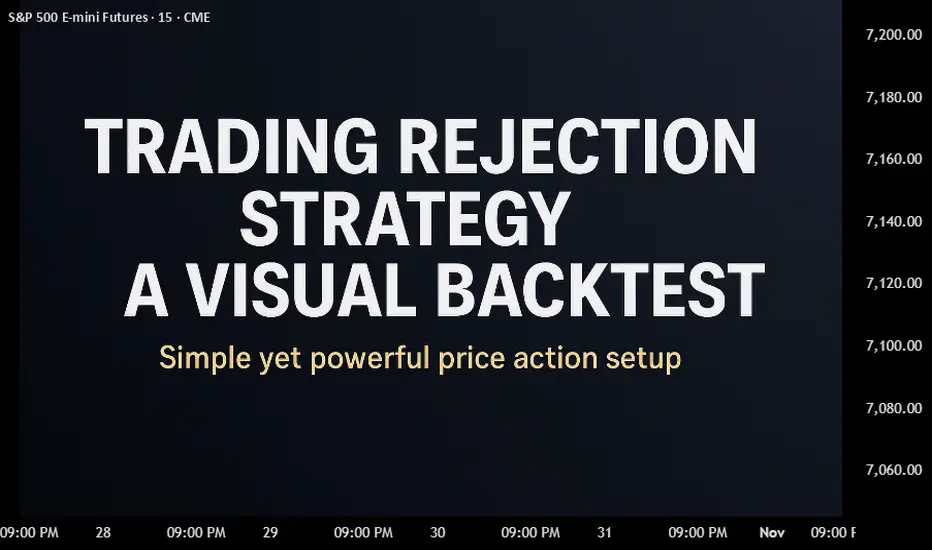
Trading Rejection Strategy- A Visual Backtest💡 Overview
Here is everything you need to know about the strategy. But before you study it any further, all the visuals are at the end of this post- so don't miss that part.
This setup is built upon simple beliefs:
▶Price always remembers its key levels- Previous Day’s High (PDH), Previous Day’s Low (PDL)
▶Strong support/resistance zones often act as liquidity magnets.
▶When price revisits these areas and fails to break through, it gives us a clear rejection and that’s where the edge lies.
⚙️ Core Conditions
➡Price rejects PDH or PDL
➡Price retests a breakout / breakdown zone
➡Price rejects a tested support / resistance level
➡Timeframe: 15-Minute
➡Type of trade: Intraday only
➡Only one trade per day
🎯 Trade Plan
🔘Entry: One tick above/below the Pin Bar or reversal candle close
🔘Stop Loss: Just beyond the high/low of the rejection candle
🔘Target: Next liquidity zone (recent 15m swing or PDH/PDL)
🚫 Avoid Trading When:
➡No rejection at liquidity levels
➡Risk > 20 points
📊 October Backtest Results
(1 trade per day, tested manually)
Total trades taken= 14
Winners= 6
Losers= 8
Total points made out of winner= 263
Total points lost in losers= 75
Net points made= 188
🧠 Takeaway
Even though the backtest covers only October, the results are encouraging.
The logic is built on price behavior around institutional levels, and that tends to hold steady across time.
📈 Try extending the backtest further:
If results remain consistent, this could become a reliable rejection-based intraday setup worth adding to your toolkit.
Here is a visual to guide to all the Entries, Exits and about how it went.
Enjoy the charts and do let me know what you think about this strategy or if I missed an opportunity ;)
📣Disclaimer:
Everything shared here is meant for education and general awareness only. It’s not financial advice, nor a recommendation to buy, sell, or hold any asset. Do your own research, manage your risk, and make sure you understand what you’re getting into.
EUR/GBP – Corrective C Wave in PlayPrice already tapped the black BC, suggesting the first correction leg is done.
Now, the pink wave’s C target aligns perfectly with both the descending trendline and the order block — a strong confluence zone likely to induce liquidity before a deeper retracement of the black wave.
Setup remains valid as long as the black B isn’t broken. A break above B would invalidate the sequence and shift market structure bullish.
Strengths:
Trendline + order block + C target alignment
Internal correction forming cleanly within larger structure
Clear invalidation and strong confluence logic
Weaknesses:
Liquidity sweeps may occur before confirmation
Requires patience for MSS confirmation before entry

BTCUSD — New York Cleans London Highs
🧭 Context
New York came in aggressive and swept the London highs — a clean stop-hunt above the morning range.
After the sweep, price slipped back inside structure, confirming it was liquidity collection, not breakout continuation.
Same playbook we’ve seen all week: clean liquidity, reset the board, and wait for direction.
📐 Technical Map
Structure: Still inside a bearish daily range, rotating between 116,077.51 – 103,516.75.
Geometry: We remain in an internal bullish bias as long as price holds above 114,128.30.
If we close below 114,128.30, that’s the first sign of weakness in price action — an early signal the range may start to roll over.
Confirmation: A decisive close below 112,885.20 confirms breakdown; holding above keeps the range intact.
Bias: Neutral-to-bearish unless we see strong volume confirmation to either side.
🌐 Fundamental Pulse
Dollar strength persists after Monday’s yield rebound — the 10-year Treasury hovers near 4.58%.
CPI miss remains in play and crypto liquidity stays tight.
Risk tone across markets leans defensive — institutions hedging more, speculating less.
📊 Volume & Order Flow Map
The sweep showed a clear volume burst but no continuation.
Footprint data suggests liquidity taken from the highs and absorbed back into range — a controlled event, not momentum-driven.
🎯 Plan
No need to rush trades after a sweep.
Let price confirm with a clean close — below 114,128.30 signals early weakness; below 112,885.20 opens range extension lower.
Above 114,128.30, we stay inside the current rotation.
Patience here protects capital.
🧠 CORE5 Note — For Traders
Sweeps are designed to pull emotion.
Your edge is to let them happen, then read what survives after.
Stay patient — control builds confidence.
— CORE5DAN
Institutional Logic. Modern Technology. Real Freedom.

ASTER — OB Tap → WCL Retrace → Macro DownASTER is forming a clean ABC correction within a larger bearish structure. Price hasn’t yet tapped the order block — I expect a final dip to complete the C-leg before retracing toward the WCL zone. From there, the broader bearish wave should resume.
However, if Bitcoin continues its upward expansion, correlations could invalidate this structure and pull ASTER higher, overriding the current wave bias.
High-timeframe trend stays bearish, but intent always belongs to the present.
Strengths:
• Fractal alignment between macro and micro waves.
• Logical liquidity flow between OB and WCL.
• Flexible bias — corrective long, then macro short continuation.
Weaknesses:
• Requires precise OB tap and strong reaction.
• Bitcoin-driven expansion could neutralize bearish context.
• LTF volatility may distort confirmation signals.
SmellyTaz — decoding chaos

GOLD RETRACEMENT BEFORE NEXT LEG DOWN 🧭 DAILY TRADING PLAN – GOLD (XAU/USD)
Date: Oct 27, 2025
Main timeframe: M30 – H1
Strategy: SMC + Fibo Zone Reaction + OB/Trendline Confluence
1️⃣ MARKET CONTEXT
Price is consolidating after a sharp drop from 4186 → 4058.
Currently, price is trading inside a support trendline + OB BUY ZONE (4058 - 4061), showing signs of demand reaction.
Above, multiple supply zones are stacked (4093 - 4095 / 4114 - 4116 / 4135 - 4137), creating strong short-term resistance layers.
Structure remains bearish, but a corrective leg toward premium zones is likely before any continuation down.
2️⃣ BIAS
Short-term bullish retracement, then sell continuation from premium supply zones.
3️⃣ SCENARIO 1 — BUY SETUP (Short-term retracement)
Entry: 4061 – 4059
SL: 4055
TP1: 4093
TP2: 4114
RR: ≈ 1:4
Note: Only buy if price forms bullish BOS / engulf on M15 from this OB zone (confluence with Fibo 0.786).
4️⃣ SCENARIO 2 — SELL SETUP (Main setup)
Option 1:
Entry: 4093 – 4095
SL: 4100
TP1: 4061
TP2: 4002
RR: ≈ 1:5
Option 2:
Entry: 4114 – 4116
SL: 4120
TP1: 4061
TP2: 4002
RR: ≈ 1:5
If price reaches 4135 – 4137, this is an extreme premium zone (reactive Fibo + previous double top). Expect strong reaction and liquidity sweep before a larger sell-off.
5️⃣ KEY LEVELS
OB BUY ZONE: 4058 – 4061
SELL ZONE 1: 4093 – 4095
SELL ZONE 2: 4114 – 4116
SELL ZONE 3: 4135 – 4137
Liquidity Target: 4002 – 3930
6️⃣ SUMMARY
Wait for reaction at 4058 zone for short-term buy retracement.
Main idea: Sell from premium → Target liquidity below 4000.

GOLD (XAU/USD) – Liquidity Sweep and Bullish Reversal from Disco🧭 DAILY TRADING PLAN – GOLD (XAU/USD)
Date: Oct 25, 2025
Main Timeframe: M30 – H1
Strategy: Smart Money Concepts + Liquidity Sweep + OB Confirmation
1. MARKET CONTEXT
Price has completed a liquidity sweep around 4059 – 4061, triggering stop losses of early buyers before a strong bullish reaction occurred. The structure then shifted from bearish to bullish, confirming a potential short-term uptrend.
2. SETUPS
BUY SCENARIO
Entry Zone: 4061 – 4059 (OB + Liquidity Sweep area)
Stoploss: 4054 (6-point SL)
Take Profit 1: 4067
Take Profit 2: 4097
Bias: Bullish continuation if price respects OB and closes above 4110
SELL SCENARIO
Entry Zone: 4136 – 4138 (Premium Zone + Supply OB)
Stoploss: 4144 (6-point SL)
Take Profit 1: 4125
Take Profit 2: 4067
Bias: Rejection from premium area with clear bearish engulfing candle
3. NOTES
Wait for confirmation candle on M15 before executing.
Avoid entries during high-impact USD news.
Price currently trades in the mid-range; ideal to wait for either discount (buy) or premium (sell) reaction.

GOLD (XAU/USD) – Rejection from Supply, Pullback Plan🧭 DAILY TRADING PLAN – GOLD (XAU/USD) | Rejection from Supply & Pullback Opportunities
Date: Oct 23, 2025
Main timeframe: M30 – H1
Strategy: SMC + CHoCH + Liquidity + Supply/Demand
1. Market Context
Price has confirmed a bullish CHoCH at 4071 → 4094 and then broke structure upward (BOS), indicating short-term bullish intent.
However, on H1, price is reacting to the 4124–4126 supply zone, aligning with higher-timeframe resistance (4,210–4,180 area).
We may expect a short-term pullback toward discount zones before continuation or reversal confirmation.
2. Key Levels
SELL Zone: 4124 – 4126 → Active supply area (short-term rejection zone)
BUY Zone 1: 4094 – 4092 → First mitigation zone
BUY Zone 2: 4084 – 4082 → Discount re-entry
BUY Zone 3: 4073 – 4071 → Extreme liquidity sweep area
Support zone (H1): 4,090 – 4,045
Resistance zone (H1): 4,210 – 4,180
3. Trading Scenarios
A. Short-term SELL
Entry: 4124 – 4126
Stop loss: 4132
Take profit 1: 4105
Take profit 2: 4090
→ Targeting pullback to demand zones before potential rebound.
B. BUY (Reversal Setup at Discount Zone)
Entry: 4084 – 4082
Stop loss: 4078
Take profit 1: 4108
Take profit 2: 4124
Take profit 3: 4145
→ Look for bullish confirmation at mitigation or liquidity sweep below 4080.
4. Bias
🔁 Neutral-to-Bullish:
Expecting short-term retracement from supply zone before continuation upward.
A close above 4126 would confirm bullish continuation toward 4180–4210.
A break below 4070 invalidates bullish bias.

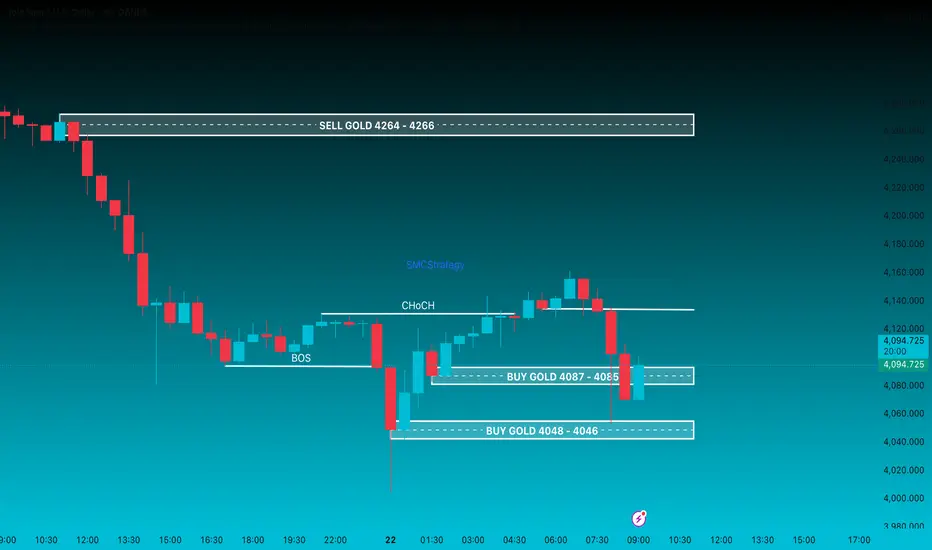
Gold Setup: Bullish CHoCH From Discount Zone (Oct 22, 2025)🧭 DAILY TRADING PLAN – GOLD (XAU/USD) | Bullish CHoCH & Discount Entry Zones
Date: Oct 22, 2025
Main timeframe: M30 – H1
Strategy: SMC + CHoCH + Imbalance
1. Market Context
After a strong bearish leg, price formed a BOS at 4070 and a clear CHoCH confirming short-term bullish intent.
Current retracement is tapping into discount areas (40.87–40.46) for potential continuation to the upside.
As long as price holds above 4046, bullish bias remains valid.
2. Key Levels
BUY Zone 1: 4087 – 4085 → First mitigation area after CHoCH
BUY Zone 2: 4048 – 4046 → Extreme discount zone (potential sweep)
SELL Zone: 4264 – 4266 → Major supply zone from previous imbalance
3. Trading Plan
BUY SCENARIO
Entry: 4087 – 4085
Stop loss: 4079
Take profit 1: 4108
Take profit 2: 4128
Take profit 3: 4150
→ Look for bullish confirmation around 4085 zone. If invalidated, re-entry at 4048–4046.
BUY SCENARIO (Deeper Discount Entry)
Entry: 4048 – 4046
Stop loss: 4040
Take profit 1: 4085
Take profit 2: 4108
Take profit 3: 4128
→ Ideal entry for those waiting liquidity sweep before strong push.
4. Bias
🟢 Short-term bullish, aiming for continuation above 4120 while price stays above 4046
BITCOIN UpdateHeavy order-flow blowback hitting the tape — looks like a sharp internal range liquidity sweep, not a clean reversal.
Price just hunting early shorts near 113 672.
As long as the daily structure stays bearish, any upside should be viewed as liquidity engineering, not trend change.
We’re likely seeing the market clear first-round sellers before resetting positioning.
If the sweep holds and volume fades on the bounce, bias remains short-side.
If we reclaim structure highs with conviction, then — and only then — we reassess.
Structure first. Emotion second.

BTC → Correction phase before bullish expansionBTC/USD Report-Based Analysis
Bitcoin is currently in a corrective phase following a structured upward delivery. After showing strength early in the cycle, the market transitioned into a redistribution and consolidation zone, allowing liquidity to rebalance across both sides. This shift suggests that price is undergoing a short-term reaccumulation before the next impulsive move. The recent break of structure (BOS) indicates a temporary bearish delivery, designed to sweep liquidity below prior demand zones. Smart money appears to be collecting positions in discounted price areas, absorbing sell-side liquidity as volatility expands. The clean liquidity pockets under 116,000–114,000 levels highlight potential mitigation zones where larger participants may seek re-entry. The overall structure remains bullish on the higher timeframe. Once the current correction finalizes and liquidity is efficiently collected, BTC may resume its upward expansion, targeting premium zones near 125,000 and above. Momentum confirmation from volume and market flow will be essential for validating this transition back into a bullish delivery phase. In short, BTC is in a controlled correction, aiming to refine liquidity before reinitiating its bullish macro delivery cycle.

GBPJPY | Daily Sweep to 15M Supply ReactionDaily liquidity swept. 1H CHOCH confirms bearish shift — if price reacts instantly at 15M supply, that’s not luck, it’s smart money execution.
Watch for the retest to ride GBPJPY into the 179-pip inefficiency zone. 🩶
After a daily liquidity sweep, price printed a clear 1H CHOCH, confirming a bearish shift in market structure.
We refined our POI to the 15-minute supply zone, where displacement originated.
Now, if price taps this POI and drops immediately without forming a lower-timeframe CHOCH, that’s not invalid — it simply signals smart-money execution at origin.
When all higher-timeframe confluences (Daily Sweep ✅, 1H CHOCH ✅, 15M Supply ✅) align, the first tap can be the move.
That impulsive drop = institutional confirmation.
From here, we watch for:
🔹 Retest of 50–61% of the first impulsive leg for refined entry.
🔹 Targeting PDL (201.20) and extended inefficiency zone (200.0–199.8).
🔹 SL above the M15 POI high (~203.10).
“When the higher-timeframe story is complete, the market doesn’t ask for your confirmation — it just moves.”
— BFU-FX MARKETS
Bias: Bearish
Key Levels: 202.75
Target: 179-pip inefficiency fill

USDCHF – Liquidity Sweep + FVG Entry (Counter-Trend Long to PDH)Idea:
Price swept previous day’s low (PDL), tapping into an Extreme Daily POI.
We then saw a CHOCH on LTF, confirming rejection.
A clean 5M FVG entry formed, giving a precise long setup.
Bias: Intraday bullish (HTF still bearish).
Entry: 5M FVG inside Daily POI.
SL: Below swept low.
TP1: 2R (partial exit).
TP2: Previous Day High (PDH liquidity magnet).
Notes:
This is a buy-to-sell setup — valid for intraday longs up into PDH, but watch for shorts if HTF structure rejects at PDH.

USDJPY – Dual POI Short Setup🧠 Market Context
Previous Day High swept → liquidity grab complete.
CHoCH → Bearish Intent confirmed → directional bias is short.
Price is now retracing into supply zones for potential continuation lower.
🎯 Key Points of Interest (POIs)
Refined 1H POI
Aligned with highest previous day volume.
Strong institutional confluence.
Extreme 5M FVG (sweep origin)
Cleaner entry with tighter risk.
Aligns with the extreme point of interest logic from liquidity models.
⚖️ Execution Plan
Option A: Scale Entries
Partial entry at 1H POI.
Add position at 5M extreme FVG if price sweeps deeper.
Option B: Confirmation Entries
Wait for LTF BOS / rejection candle inside either POI before execution.
🔽 Bearish Targets
147.037 → Previous Daily Low (Liquidity Zone).
146.582 – 146.600 → Deeper liquidity + imbalance fill.
⚠️ Risk Management
Risk 0.5–1% per setup, split across zones.
Move SL to breakeven once 2R is achieved.
Trail stop following bearish structure.
📊 Summary
USDJPY has shifted to bearish intent after the PDH sweep. Two valid POIs are in play — a volume-backed 1H supply and an extreme 5M FVG.
Best approach: scale into both for higher probability while keeping risk controlled.
💬 What do you think? Would you take the refined 1H POI or wait for the extreme 5M FVG?

USDJPY – Liquidity Sweep & CHoCH → Short SetupUSDJPY shows a clean liquidity play under MY Liquidity MM Trading System:
Price swept liquidity above Friday’s High, triggering buy-side stops.
CHoCH confirmed a bearish shift in orderflow.
Retest into the Supply Zone (OB + Highest Volume Area) offers a short entry.
Targeting liquidity resting at Previous Day’s Low (PDL).
Execution Plan:
Entry: Supply zone retest
Stop: Above Friday’s High for
R:R: 1:2
For tighter stops: Refine entry at top of OB wick + add buffer of 2–3 pips
TP: PDL liquidity pool
R:R ≈ 1:4

XAUUSD Update – Resistance Rejection and Market Structure Shift"XAUUSD Update – Resistance Rejection and Market Structure Shift
Price Action: Gold has recently tested the 3550 – 3600 resistance zone, where the market showed signs of rejection. This level represents a significant supply area formed by previous liquidity grabs.
Market Structure: After a strong bullish impulse, the current price behavior suggests a possible correction phase. The rally left behind areas of imbalance that could attract price back downward.
Key Observation:
The first reaction zone sits around 3480, which aligns with a structural support level from past consolidation.
A deeper correction may extend toward the 3330 – 3320 support region, a critical level where historical demand has been observed.
Context: Liquidity above recent highs has been taken, and the chart now shows potential for retracement to restore balance before determining the next directional move.

XAUUSD Alert | Liquidity Grab or Trend Reversal?”XAUUSD Alert 🚨 | Liquidity Grab or Trend Reversal?”
Gold has recently pushed into the 3525 – 3550 rejection zone, a level that has historically acted as strong supply. After this extended bullish rally, price is now showing early signs of exhaustion. This could be a liquidity grab above resistance before the market corrects lower.
My expectation here is a short-term pullback. The first key area I’ll be watching is around 3450, which lines up with a smaller demand zone and could act as a temporary support. If buyers fail to defend that level, then I expect continuation toward the 3330 – 3320 zone, which is my final target and also a major higher-timeframe support point.
This level is very important because it was previously a strong base for accumulation, and if tested again, it could provide a potential long opportunity. However, if price breaks below 3320 decisively, it would open the door for a much deeper correction.
Overall, my short-term outlook is bearish retracement, but I’ll be closely watching how price reacts once we reach the deeper support levels.

“XAUUSD – Strong Sell Setup from All-Time High Resistance “XAUUSD – Strong Sell Setup from All-Time High Resistance 🚨📉”
Currently, gold has reached a strong resistance zone around 3575 – 3600, where price is showing signs of exhaustion after a strong bullish rally. This area is a key supply zone and could trigger profit-taking or fresh short entries.
From here, I am expecting a potential correction move.
1st Target: Around 3480 – 3450, where we can see a clear demand zone and previous consolidation.
If bearish pressure continues, the price may extend towards the final target at 3330 – 3320, which is also a key support point aligned with previous market structure.
Market structure shows a clear higher low formation earlier, which fueled this rally, but after tapping into resistance, a short-term pullback seems highly likely.
📌 Overall, short-term bias = bearish correction, while long-term trend remains bullish unless price breaks below the 3320 support zone.

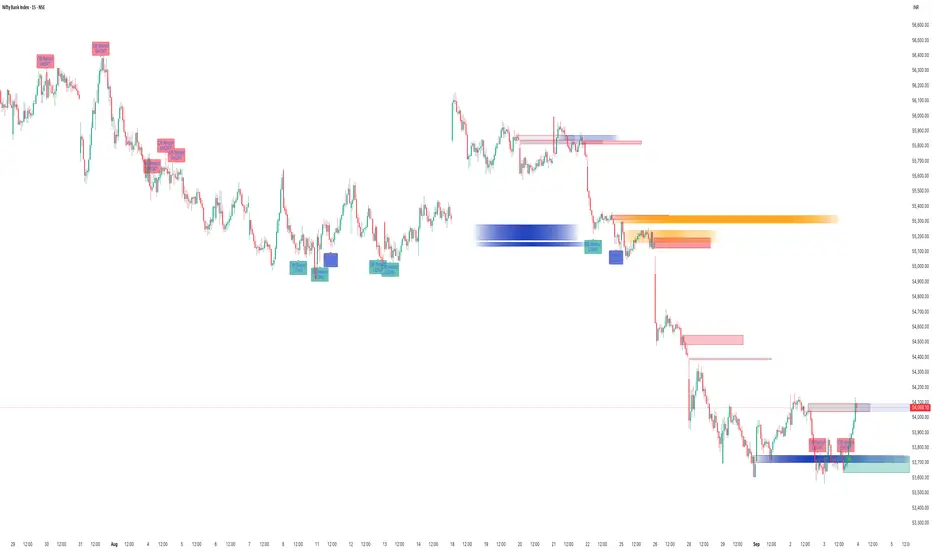
How To Capture Market Moves With SMC Suite Indicator?📊 SMC Suite Capturing Market Moves — Order Blocks • Breakers • Liquidity Sweeps • FVG
The chart above shows how the SMC Suite works in live market conditions on BankNifty. By combining Order Blocks, Breaker flips, Liquidity Sweeps, and Fair Value Gaps, the tool highlights where smart money is entering and where reversals are likely to occur.
🔹 Key Highlights from This Chart
1. Order Blocks — Bullish and bearish OBs correctly marked institutional footprints before price reversals.
2. Breaker Blocks — Invalidated OBs flipped into Breakers, giving continuation entries in trend direction.
3. Liquidity Sweeps — Several highs/lows were taken out, followed by reversals back into structure. These sweeps acted as confirmation for later setups.
4. Fair Value Gaps (FVGs) — The script marked imbalances that later served as retracement zones. Price respected these gaps, providing clean reversal opportunities.
5. Retest Alerts — Each zone was validated only on retests with optional wick rejection, reducing noise and improving signal quality.
⸻
🔹 Why It Matters
This chart shows that SMC Suite is not just drawing zones randomly — it creates a workflow:
• Sweep liquidity ➝ impulsive displacement ➝ zone creation (OB/Breaker/FVG) ➝ retest confirmation.
This makes it easier to follow institutional logic and align entries with high-probability setups.
📌 Conclusion
From strong downside moves to clean bounces, the SMC Suite captured both continuation setups (Breakers) and reversal setups (OB/FVG retests). The integration of liquidity logic makes it a practical trading tool across indices, forex, and crypto.
Liquidity: The Trap That Powers the Market“The market doesn’t move to reward you.
It moves to hunt those who move without awareness.”
Every beginner asks: “Why did price stop me out before going in my direction?”
The answer is usually one word: Liquidity .
What is Liquidity?
Liquidity is simply where orders are waiting:
Buy stops above a recent high
Sell stops below a recent low
Pending orders around round numbers (like 3400, 3350 in Gold)
These areas are pools of money.
The market needs these pools to fill large institutional orders.
Why Traders Get Trapped
Price breaks above a high → retail traders buy the breakout.
Price dips below a low → retail traders sell the breakdown.
But instead of continuing, price often snaps back .
Why? Because the market just collected those stops — the liquidity it needed — before reversing.
This is why beginners often say:
“Every time I enter, the market goes the other way.”
Sweep vs Grab
Sweep = Price pushes above/below a key level to collect stops. This alone doesn’t mean reversal.
Grab = After the sweep, price rejects and shifts structure (ChoCH/BOS). This confirms intent and often leads to the true move.
Practical Example (Gold)
Suppose Gold makes a high at 3395.
Many traders place buy stops above 3395, expecting a breakout.
Price pushes to 3397 (this is the sweep ), then falls back under 3395.
If structure shifts bearish after that, it becomes a liquidity grab .
The smart entry isn’t the breakout.
It’s after the sweep, when the grab confirms direction.
Trading isn’t about being the first one in.
It’s about being the last one trapped.
Patience protects you from becoming liquidity yourself.
📘 Shared by @ChartIsMirror

SUI — Where Liquidity Turns Into OpportunitySUI has been trading sideways for the past 40 days, offering solid swing opportunities both long and short. At the moment, there is one long setup that stands out → the $3.33 zone, where multiple layers of confluence align.
🧩 Confluence Factors: 5
1.0 Trend-Based Fib Extension: $3.3319
Prior Low: $3.3272 → potential liquidity sweep (SSL)
Anchored VWAP: Supporting the zone
Weekly 21 EMA / SMA: Acting as dynamic support
40d Range Context: Range low positioning
🟢 Long Trade Setup
Entry Zone: ~$3.33 (liquidity sweep into support)
Stop-Loss: Below $3.25
Target: Range highs near $4.20
R:R Potential: 1:10+
Note: Wait for bullish confirmation (order flow or strong reaction) before entering.
Technical Insight
The $3.33 level combines liquidity, fib projection, VWAP support, and the weekly 21 EMA/SMA → all pointing to a high-probability reaction zone. In sideways environments, such confluence at range lows often defines pivot points for the next swing move. If defended, upside targets remain the range high around $4.20.
🔍 Indicators used
Multi Timeframe 8x MA Support Resistance Zones → to identify support and resistance zones such as the weekly 21 EMA/SMA.
➡️ Available for free. You can find it on my profile under “Scripts” and apply it directly to your charts for extra confluence when planning your trades.
_________________________________
💬 If you found this helpful, drop a like and comment!

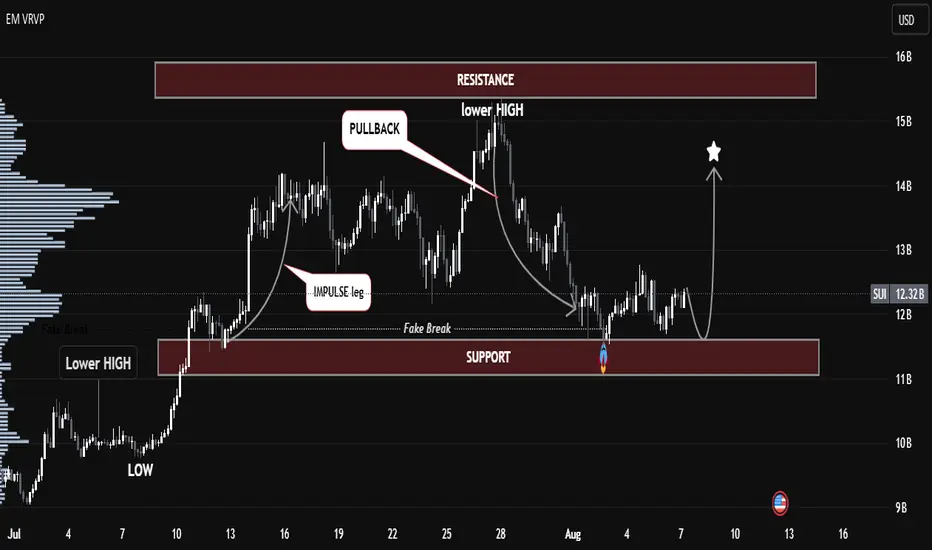
SUI/USDT – Smart Money Accumulation at Key Demand Zone📊 SUI/USDT – Smart Money Accumulation at Key Demand Zone | Bullish Outlook Ahead 🚀
The current SUI/USDT structure highlights a textbook Smart Money accumulation phase playing out at a key support zone, following a clear impulse–pullback–lower high formation.
🔍 Key Technical Insights:
🔻 Lower Highs Formation: A strong bearish structure led price back into the previous demand zone, sweeping liquidity below the support.
🎭 Fake Break Identified: Price action broke below the support briefly, indicating a liquidity grab (stop-hunt), often a precursor to bullish reversals.
🌀 Volume Node Alignment: Strong volume interest is building at the current support area, adding confluence for potential accumulation.
⚡ Projection Path: If the demand holds, expect a potential bullish reversal, targeting the previous resistance zone between 14–15B.
🧠 SMC Concepts in Play:
Fake Breakout = Liquidity Sweep
Impulse Leg = Institutional Activity
Pullback = Re-Entry for Smart Money
📈 Bullish Scenario:
Watch for confirmation around the support zone (~11B). A higher low or bullish engulfing pattern could trigger a rally toward 14B–15B resistance.
🛑 Bearish Invalidator:
A clean break and close below the 11B zone would invalidate the current bullish thesis.
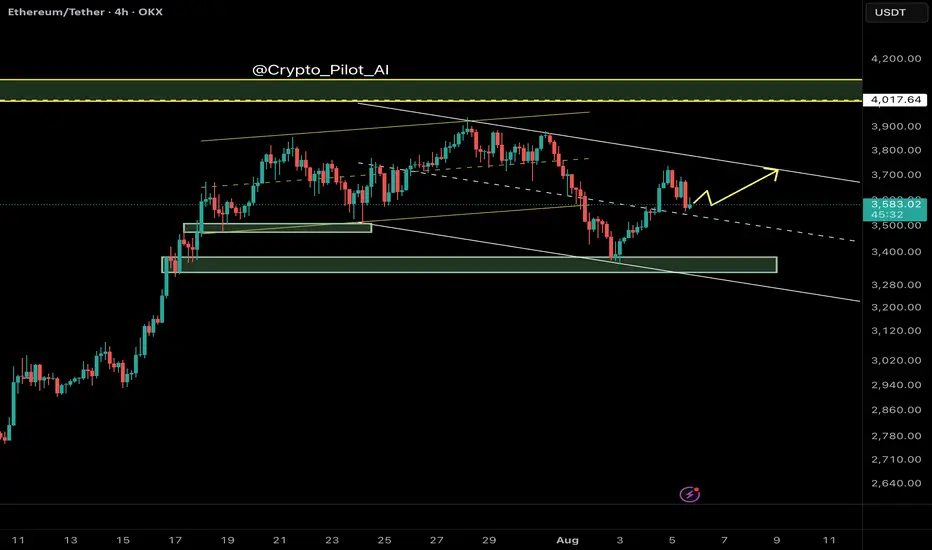
Ethereum (ETH/USDT) – Midline Break Retest and Channel Top in Si🔍 Technical Overview
Ethereum has recently broken above the midline of its descending channel, indicating a potential bullish shift within the short-term corrective structure. The price action suggests that we are currently witnessing a retest of the broken midline, which is now acting as dynamic support.
This behavior is consistent with smart money principles — where a previously broken internal structure gets tested before continuation.
⸻
🧠 NEoWave Context
Structurally, ETH appears to be developing a Contracting Corrective pattern, with the current leg likely evolving as Wave D. This wave typically exhibits strength and complexity, often stretching toward the channel top while still respecting broader consolidation boundaries.
⸻
💡 Smart Money Insights
• ✅ BOS already confirmed on LTF (1H, 4H) with higher lows
• 🔄 Price has reclaimed the internal broken structure (midline) and is retesting it
• 🔋 Bullish OB around $3,480–$3,510 acted as a launch zone for current leg
• 📍 Next resistance is the channel top near $3,740
⸻
📊 Trade Scenarios
🟩 Bullish Scenario (Preferred):
If the retest of the midline holds, ETH is likely to continue its move toward the upper boundary of the descending channel (~$3,730–$3,750). This aligns with Wave D expectations in complex corrections.
🟥 Bearish Invalidations:
A breakdown back below $3,520 and loss of the internal bullish structure would negate this short-term bullish scenario and reopen downside potential toward $3,350.
⸻
⚠️ Trader Tip:
Retests of internal structures like midlines or internal trendlines often provide low-risk continuation setups — if confirmed by bullish internal BOS.
⸻
✅ Conclusion
Ethereum remains technically corrective but with bullish momentum building within the channel. As long as the midline holds, we expect continuation toward the channel top, completing Wave D structure before potential reversal.
💬 Drop your alt counts or thoughts in the comments.