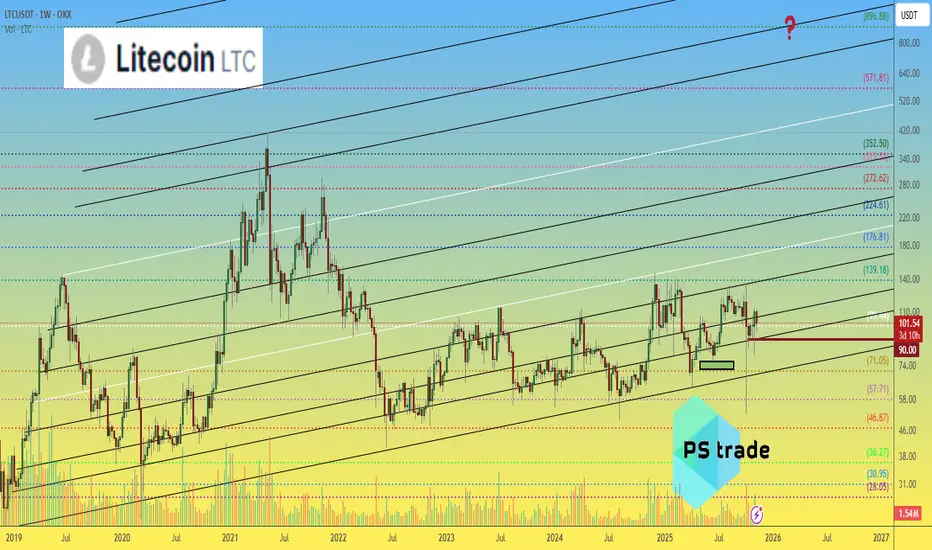
Litecoin LTC price analysis📉 For weeks, OKX:LTCUSDT has been holding strong
And guess what — this consolidation has lasted over 3.5 years! 😮
💭 The last real pump was back in early 2021... feels like it’s time for a sequel, right? 😉
Now, here’s the interesting part:
🔹 Litecoin has the same tokenomics and mining method as Bitcoin ( CRYPTOCAP:BTC ) and
🔹 Recently, another “old school” coin — CRYPTOCAP:ZEC — just pumped hard 💥
🔹 And there are rumors about a potential LTC ETF 😏
With a current market cap of only $7.7B, there’s plenty of room to grow.
So maybe... just maybe... CRYPTOCAP:LTC at $900 isn’t that crazy after all? 🚀
What do you think — are we on the verge of a new #Litecoin era? 👇
______________
◆ Follow us ❤️ for daily crypto insights & updates!
🚀 Don’t miss out on important market moves
🧠 DYOR | This is not financial advice, just thinking out loud
Litecoin (Cryptocurrency)
LTC is shaping a global bullish flagLTC is forming a global bull flag pattern, and the asset has remained in the accumulation phase since 2022. At a more local level, a butterfly pattern formed but did not complete its move to point D. Afterward, the price entered a local descending channel, which often forms part of a bull flag formation. It's highly likely that after breaking out of the local pattern, the movement will continue as a local ascending channel within the global structure.
If the global pattern's boundaries are broken, the highs formed since 2024 may be renewed.
A resistance zone (purple area) is also highlighted on the chart, where increased LTC buying activity is observed.
Dropping the price below 70 and holding it there doesn't make much sense, as the accumulation zone has formed above.
More detailed analysis, additional charts, and key levels to watch are available on our site

LTC/USD Market Flow Blueprint – Bearish Bias Confirmed!🎯 LTC/USD: The Great Support Heist 🏴☠️ | Bearish Breakdown Blueprint
📊 Market Overview
Asset: LTC/USD (Litecoin vs. U.S. Dollar)
Market: Cryptocurrency
Trade Type: Swing Trade (Bearish Setup)
Strategy Style: "Thief Method" - Multi-Layer Limit Orders
🔍 Technical Analysis
Litecoin has officially broken through its STRONG SUPPORT ZONE, confirming a bearish market structure. This isn't just a casual dip—we're looking at a genuine breakdown that's validated by price action closing below critical support levels. The bears are in control, and the path of least resistance is pointing south. 🐻📉
What's Happening?
✅ Support zone broken with conviction
✅ Market structure showing lower highs forming
✅ Momentum shifting to the downside
✅ Volume confirming the breakdown
🎯 Trade Plan Breakdown
📍 Entry Strategy: "The Thief Layer Method"
Instead of going all-in at one price (rookie move 😅), we're using a multi-layer limit order strategy to build our position as price moves. Think of it as setting multiple traps along the way down.
Suggested Sell Limit Layers:
🎪 Layer 1: $92.00
🎪 Layer 2: $90.00
🎪 Layer 3: $88.00
Pro Tip: You can add more layers based on your risk appetite and position sizing strategy. Scale in, don't gamble in! 🎲
🛑 Stop Loss: $96.00
This stop is placed at the previous market structure's nearest higher high wick. Why? Because if price reclaims this level, it invalidates our bearish thesis and tells us the breakdown was fake news. 🚫
⚠️ IMPORTANT DISCLAIMER: This is MY stop loss based on MY analysis and risk tolerance. You should ALWAYS determine your own stop loss based on YOUR risk management rules. Trade your own plan, not mine! Your money, your rules. 💰
🎁 Target: $75.00
Our profit target sits at a confluence zone where we're expecting:
💎 Strong historical support
💎 Oversold conditions (RSI likely stretched)
💎 Bull trap potential zone
💎 Possible trend reversal area
This is where smart bears become bulls and take profits off the table. Don't be greedy—secure the bag! 💼
⚠️ IMPORTANT DISCLAIMER: This target is based on MY analysis. You should set YOUR OWN take profit levels based on YOUR trading plan and risk management. Lock in profits when YOU feel comfortable. Your capital, your decision! 🎯
🔗 Related Pairs to Watch
Keep an eye on these correlated assets for confluence:
BITSTAMP:BTCUSD - The king leads, alts follow. If Bitcoin dumps, LTC usually amplifies the move 👑
BITSTAMP:ETHUSD - Major alt indicator. Ethereum weakness = altcoin pain 🌊
BINANCE:LTCBTC - Shows LTC's relative strength against Bitcoin. Watch for breakdown here too 📊
TVC:DXY (Dollar Index) - Strong dollar = crypto weakness typically 💵
Correlation Play: Crypto markets move as a herd. When Bitcoin sneezes, Litecoin catches pneumonia. Watch BTC dominance and overall market sentiment. If BTC is showing weakness at key levels, it adds conviction to this LTC short setup. 🧩
📝 Key Takeaways
Confirmation is King - We're not guessing; the support break is confirmed ✅
Layer Your Entries - Don't blow your load at one price. Build the position strategically 🎯
Respect Your Risk - Stop loss is there for a reason. Use it. Love it. Don't delete it. 🛡️
Take Profits - The market doesn't care about your feelings. When you hit target, TAKE THE MONEY 💰
Stay Flexible - Markets change. If the setup invalidates, move on. No ego in trading 🧘
⚡ The Thief Philosophy
This isn't financial advice—it's a treasure map. 🗺️ You still have to dig, avoid the traps, and know when to run. The "Thief Method" is all about stealth entries, calculated risk, and knowing when to escape with the loot before the guards (market reversal) catch you.
We're not gambling; we're executing a heist. Plan the job, execute with discipline, and don't get caught holding bags. 🏴☠️💼
🎬 Final Words
Markets don't reward hope; they reward preparation and execution. This setup offers a solid risk-reward if you manage it properly. Remember: Your trade, your risk, your responsibility. I'm just sharing what I see and how I'm playing it.
Stay sharp, trade safe, and may your stop losses never get hit. 🎯🚀
✨ If you find value in my analysis, a 👍 and 🚀 boost is much appreciated — it helps me share more setups with the community!
#LTCUSD #Litecoin #CryptoTrading #BearishSetup #SwingTrade #TechnicalAnalysis #ThiefMethod #CryptoAnalysis #TradingStrategy #ShortSetup #CryptoTA #LTC #SupportBreakdown #LayeredEntry #RiskManagement

LTC/USDT | Litecoin Up Over 35%! Can It Keep Climbing?By analyzing the #Litecoin chart on the weekly timeframe, we can see that after the last analysis, the price continued its rally from $88, hitting the targets of $97 and $106, and even reaching up to $114, coming close to the third target.
Currently, LTC is trading around $101, and it’s important to see if the price can hold above $100. If it does, we can expect further upside, with the next targets at $113, $118, and $136.
The overall gain from this analysis has been over 35%, and I hope you’ve made the most of it!
Please support me with your likes and comments to motivate me to share more analysis with you and share your opinion about the possible trend of this chart with me !
Best Regards , Arman Shaban

LTCUSDT - Time to wake up for this Monster!As usual, any popular coin like LTC tends to make you lose hope right before a major rally — it usually forms a bearish-looking triangle, breaks downward, and makes everyone think a bear market has started.
Here’s how you know it’s actually preparing to pump:
It gives a very bearish signal on the chart — spot traders panic sell at a loss, long traders get liquidated or trapped, and short traders start feeling confident right before price reverses and pumps hard.
When everyone’s losing, that’s when the path upward becomes clear and safe.
I believe a 100% move from here is the minimum we’ll see.
Best Regards:
Ceciliones🎯
TC and ICP · The Quiet Storm Before the BreakoutMarkets are buzzing again after Trump mentioned a possible “tariff dividend” – a $2,000 payout per person funded by tariffs. It reminds many of 2020’s stimulus wave that pushed Bitcoin from $4K to $69K. If liquidity returns, older assets like Litecoin COINBASE:LTCUSD and Internet Computer BINANCE:ICPUSDT could be the next to move.
LTC: The Silent Giant
Litecoin is showing one of the cleanest technical setups in the market. The monthly chart forms a massive symmetrical triangle that’s been tightening since 2018. LTC just reclaimed the $108–$110 zone, sitting right below resistance. A monthly close above it could confirm a breakout toward $175 or more.
Historically, LTC rallies begin in November – right before broader altcoin seasons. The pattern from 2017 and 2020 looks set to repeat. If it does, the next rally could align perfectly with the 2025 halving cycle.
LTC Trading Plan:
- Breakout: $135
- Resistance: $160–$170
- Cut Loss: $70
- Targets: $240 / $400 / $600 / $1000
ICP: Rising Scarcity, New Narrative
Coinbase reserves of ICP have hit record lows. Only ~284,000 tokens remain on the exchange, while Binance’s reserves grow. This shift hints at growing demand.
Coinbase’s CEO recently talked about taking the exchange onchain, and ICP’s tech is one of the few ready for that move. With 44% of its supply locked, ICP’s real market cap is smaller than it looks, making it ripe for repricing.
ICP Trading Plan:
- Entry: $6.0–$7.0
- Stop: $5.0
- Targets: $11 / $12.5 / $14 / $20
Both LTC and ICP show strong asymmetry. One stands on historical cycles, the other on real scarcity and narrative growth. The setup looks familiar – quiet now, but maybe not for long.
TheCryptoFire

$LTC LONG IDEAThe coin has fully formed an ABCDE pattern.
To confirm it, we need a break above wave D.
Potential: $300–500.
Possible risks: if wave D is broken and the price moves to capture wave E (or immediately forms wave C), the scenario becomes invalidated.
For now, the setup remains active and valid.

LTC at the Edge? — Hold $100 and We May Have a Ride to $300+ 📊 LTC Price Update | Major Level on Watch
Litecoin (LTCUSDT) is currently holding the $100 support — a crucial psychological and technical level.
If buyers manage to hold above $100, momentum could build toward the next key resistance zone near $135.
🔹 Key Levels:
Support: $100 (must hold for bullish structure)
Resistance: $135 – breakout here confirms mid-term reversal
Upside Target: $300+ possible if $135 breaks with volume
🔸 Market Outlook:
Price consolidation above $100 is showing early signs of accumulation.
A strong breakout above $135 could mark the beginning of a long-term uptrend, targeting the $250–$300 region.
Failure to defend $100, however, would risk revisiting lower demand zones around $85.
🧭 Strategy:
Watch for daily closes above $135 for trend confirmation. Until then, $100 remains the line in the sand for bulls.

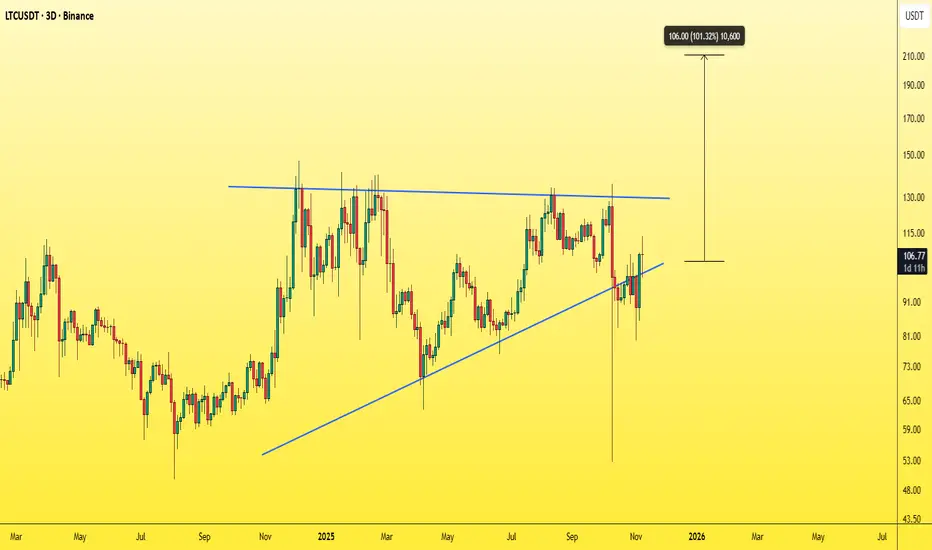
LTC/USDT — The Calm Before The Storm: A Major Move Is Brewing!Litecoin is currently trading inside an extended Symmetrical Triangle formation that has been developing since mid-2021.
Each price swing is tightening between two major trendlines, compressing volatility like a coiled spring ready to snap.
📊 At around $104, LTC is sitting right at a decision point, where the battle between bulls and bears is approaching its climax.
The next confirmed breakout — either up or down — will likely define Litecoin’s macro trend for the months ahead.
---
Pattern & Technical Structure
Main Pattern: Symmetrical Triangle (neutral → directional bias confirmed only after breakout)
Upper Resistance Zone: $110–$120 (descending trendline)
Horizontal Resistance: $134 (key pivot level), followed by $281–$295 (major historical resistance)
Support Zone: rising trendline around $85–$90, with strong historical supports at $69 and $40
Volatility: extremely compressed, suggesting an imminent expansion phase
---
Bullish Scenario
If LTC manages to break and close weekly above $120–$134 with solid volume, a macro trend reversal could ignite.
🎯 Initial Target: $134 (confirmation zone)
🎯 Mid-term Target: $200
🎯 Major Target: $281–$295
🛡️ Invalidation: weekly close back below the upper trendline
Such breakouts after long compressions often lead to explosive upside moves, as months of built-up energy get unleashed in one direction.
---
Bearish Scenario
If sellers take control and LTC breaks below $85, a significant downside move could unfold.
⚠️ First Target: $69
⚠️ Next Target: $46–$40 (major liquidity zone)
🛡️ Invalidation: price reclaims the broken support on a weekly close
A clean breakdown would likely trigger a capitulation flush, but could also offer long-term accumulation opportunities near historical lows.
---
Market Outlook & Conclusion
Litecoin is now sitting at the tip of a multi-year triangle — a structure that rarely stays quiet for long.
When such formations appear on the weekly timeframe, the next expansion phase usually brings a major directional shift.
Both sides are on alert — one decisive candle could rewrite the chart entirely.
📈 Key takeaway: Stay patient, stay prepared.
The volatility storm is loading — and it’s only a matter of time before it erupts.
---
#LTCUSDT #Litecoin #CryptoAnalysis #BreakoutAlert #SymmetricalTriangle #TechnicalAnalysis #CryptoTA #MarketStructure #SwingTrading

LTC/USDT | LTC Holding Steady Above $76 – Bulls Eye $136!By analyzing the #Litecoin chart on the weekly timeframe, we can see that after correcting to $79, the price has started to rise again and is now trading around $88.5.
If Litecoin manages to stay above $76, we can expect further upside momentum. The next potential targets are $97, $106, $118, and $136.
Please support me with your likes and comments to motivate me to share more analysis with you and share your opinion about the possible trend of this chart with me !
Best Regards , Arman Shaban

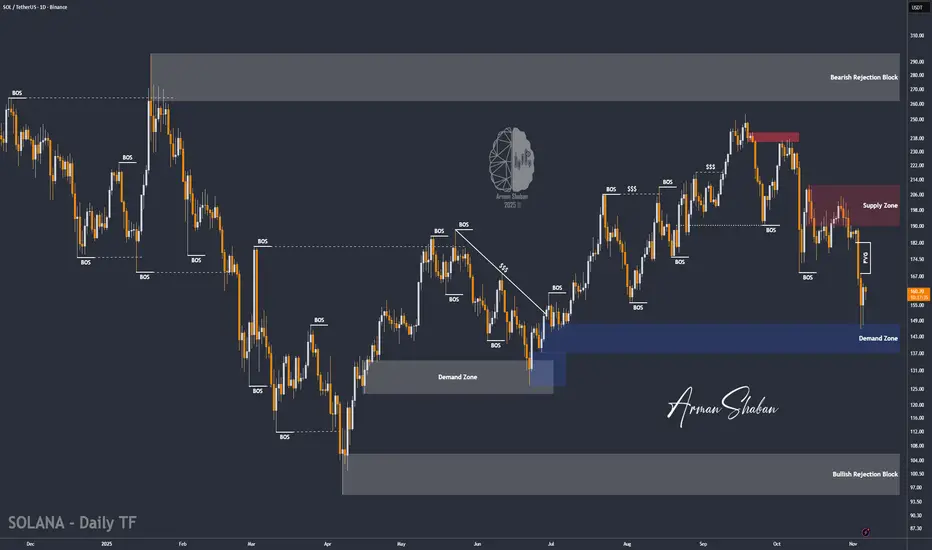
SOL/USDT | Solana Rebounds From $146 – Bulls Back in Control!By analyzing the #Solana chart on the daily timeframe, we can see that after correcting to $146, the price found strong demand and is now trading around $160.
If Solana manages to hold above the key demand zone of $137–$147, we can expect further upside movement. The medium-term targets are $168, $182, and $196. This analysis will be updated soon.
Please support me with your likes and comments to motivate me to share more analysis with you and share your opinion about the possible trend of this chart with me !
Best Regards , Arman Shaban
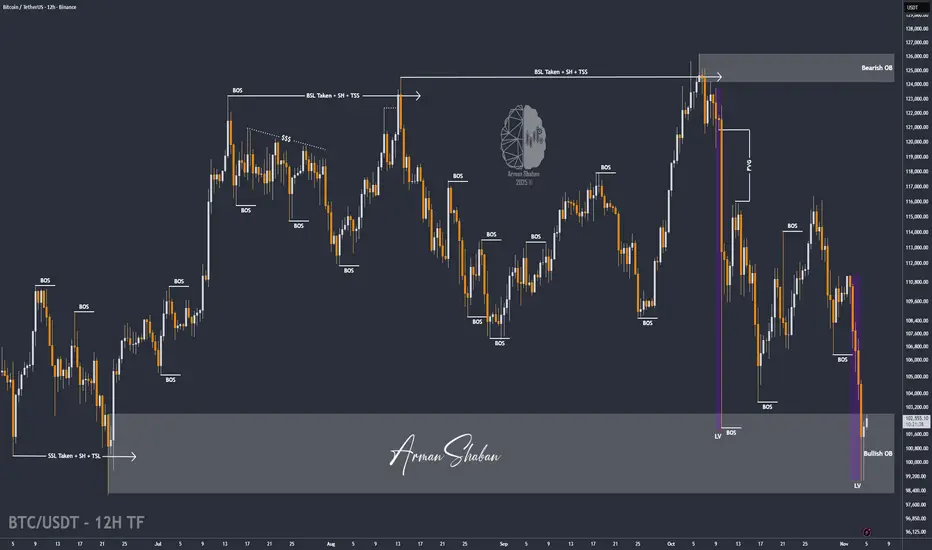
BTC/USDT | Bitcoin Drops 15% in 8 Days – Is Recovery Next?By analyzing the Bitcoin chart on the 12-hour timeframe, we can see that Bitcoin has faced a strong correction over the past few days — dropping nearly 15% from $116,400 to $98,940 in less than eight days.
After sweeping liquidity below $102,000, buying pressure returned, and BTC is now trading around $102,400.
If price manages to break and hold above $104,700, we could see a rebound toward $110K+. Otherwise, Bitcoin may continue its decline toward $95,000.
Please support me with your likes and comments to motivate me to share more analysis with you and share your opinion about the possible trend of this chart with me !
Best Regards , Arman Shaban
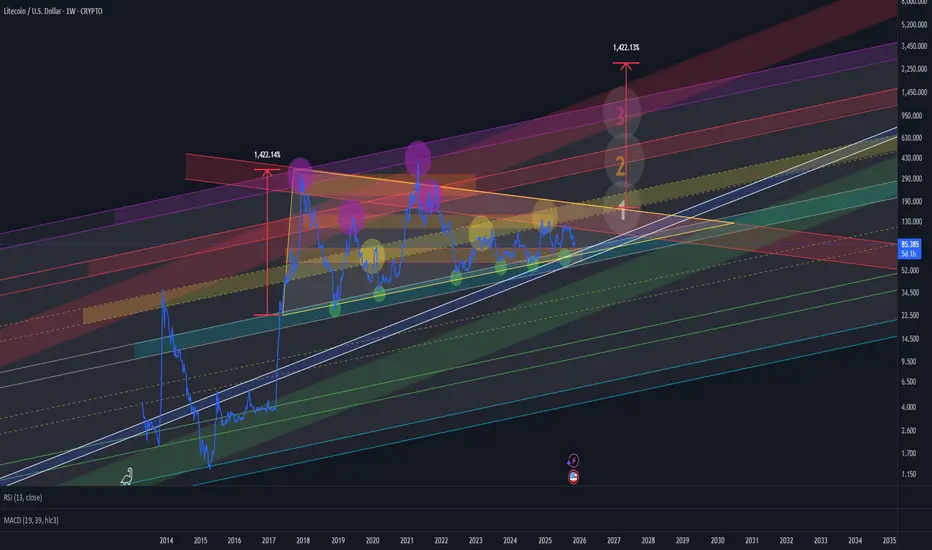
Litecoin — Long-Term Accumulation and Breakout Setup (1W Chart)We have a blue horizontal accumulation zone, which has been acting as the cycle bottom area since 2018.
From this zone, long-term positions can be built with partial profit-taking targets at the yellow, red, and violet zones — each representing stages of distribution and de-risking from the accumulated position.
Additionally, we can observe a massive triangle formation.
If this pattern plays out, the breakout target zones are clearly indicated on the chart.
At the bottom, the blue line inside the white frame marks an additional support level, which may serve as a final retest zone before the next upward cycle.
LTC - NEUTRAL VIBESSome compared NASDAQ:DASH to ... But; #LTC price looks clearly bearish under the 105$ mark! 🔴
Current price looks stuck between the 105$ resistance and 90$ support. Nothing to do with yet.
🟩Bull plan:
Daily candle close above 102$ --> 117 - 120$ pump likely 🎯
🟥Bear plan:
H4 candle break under 89$ --> 83 - 80$ support 🎯

HOME/USDT | $HOME Rebounds Strongly – Bulls Aiming for More GainBy analyzing the #HOME chart on the 1-hour timeframe, we can see that after a pullback to $0.02050, the price started to rise again and successfully hit all three targets — $0.02350, $0.02375, and $0.02410 — delivering over 18% profit.
Currently, #HOME is trading around $0.022, and as long as it holds above $0.0215, we can expect further bullish movement. Hope you made the most out of this setup!
Please support me with your likes and comments to motivate me to share more analysis with you and share your opinion about the possible trend of this chart with me !
Best Regards , Arman Shaban

LTC - GREAT Potential : ALT for 2026Hello Traders 📈
LTC / Litecoin may still present great opportunities for 2026.
From a bigger perspective, it may seem like LTC doesn't move much. But if we zoom in, we see massive bounces over the course of 3-4 weeks which presents big opportunities if you can buy in low:
From a technical indicator perspective, in the 4h LTC is still trading UNDER< showing that bears are still in control:
In the daily, we still see the same story however there seems to be a bullish W pattern appearing. As soon as the price reclaims the MA in the DAILY timeframe , that would be the first positive indicator of more upside:
For the short term, we need to see LTC trade ABOVE ALL the 4h moving averages in order to begin anticipating a bigger move up.

BTC/USDT | Bitcoin Bounces Back — Bulls Eyeing $112K Next!By analyzing the #BTC chart on the 12-hour timeframe, we can see that after a healthy correction down to $106,350, Bitcoin has regained its footing and is once again trading near the $110,000 zone. This recovery shows that buyers are still stepping in aggressively to defend key supports and maintain bullish momentum.
As long as BTC stays above $108,600, the bullish outlook remains valid. The next upside target sits around $112,000, where we might see some short-term reaction before another potential correction — likely a setup before the next major bullish wave.

ETH/USDT | Ethereum Rebounds Strongly – Eyes on $5K Next!By analyzing the #Ethereum chart on the weekly timeframe, we can see that after our previous analysis, price continued to rise and reached as high as $4,200. It is currently trading around $3,800, and if it can hold above this level, we could expect further upside movement.
The next potential bullish targets are $4,300, $4,500, $5,000, and $5,500.
Please support me with your likes and comments to motivate me to share more analysis with you and share your opinion about the possible trend of this chart with me !
Best Regards , Arman Shaban

LTC : ETFHello friends
Due to the US government shutdown and the Lit coin ETF request that has been raised and is being reviewed, when the government and relevant institutions reopen, it is most likely that the ETF will be approved and expected. Now that the price has corrected and the good decline we had, there is a good opportunity to buy in steps in the specified areas with capital and risk management and move with it to the specified goals.
*Trade safely with us*

LTCUSD H4 | Bullish Bounce Off Pullback SupportLTC/USD has bounced off the buy entry which is a pullback support that aligns with he 50% Fibonacci retracemnt and could rise from this level to the upside.
Buy entry is at 96.09, which is a pullback support that aligns with he 50% Fibonacci retracemnt.
Stop loss is at 84.76, which is a swing low support.
Take profit is at 115.31, whichis a pullback resistance that aligns with the 61.8% Fibonacci retracemnt.
Stratos Markets Limited (tradu.com ):
CFDs are complex instruments and come with a high risk of losing money rapidly due to leverage. 68% of retail investor accounts lose money when trading CFDs with this provider. You should consider whether you understand how CFDs work and whether you can afford to take the high risk of losing your money.
Stratos Europe Ltd (tradu.com ):
CFDs are complex instruments and come with a high risk of losing money rapidly due to leverage. 70% of retail investor accounts lose money when trading CFDs with this provider. You should consider whether you understand how CFDs work and whether you can afford to take the high risk of losing your money.

Can LITECOIN copy ZEC's enormous rally?Zcash (ZECUSD) marginally broke its May 10 2021 Cycle Top (orange trend-line) this week, rising by more than +800% in just 2 months.
Throughout its trading history, it has been tightly correlated with Litecoin (LTCUSD). It's not uncommon to see ZEC lead the way and then LTC (purple) follow. As this chart shows, whenever the two diverged, the one always caught up with the other and converged again.
Does this mean that LTC will eventually catch up to this enormous rally? If it does indeed, the Top of the previous Cycle that it 'has to' fill is at $415.
-------------------------------------------------------------------------------
** Please LIKE 👍, FOLLOW ✅, SHARE 🙌 and COMMENT ✍ if you enjoy this idea! Also share your ideas and charts in the comments section below! This is best way to keep it relevant, support us, keep the content here free and allow the idea to reach as many people as possible. **
-------------------------------------------------------------------------------
💸💸💸💸💸💸
👇 👇 👇 👇 👇 👇

Litecoin is primed for a massive price explosionI’m thinking we’ll see a big pump on Litecoin. I love this multi-year accumulation pattern. A lot of people don’t realize how held back this coin has been—when it starts pumping, it will be insane.
As always, stay profitable.
- Dalin Anderson

Litecoin: Rally Stays on TrackLitecoin (LTC) has continued its steady upward climb. Under our primary scenario, the ongoing magenta wave is expected to sustain this momentum and push price above the resistance level at $147.06. However, if price falls below support at $50.22, our alternative scenario will come into play (probability: 40%), signaling the potential for further selling pressure.
