Litecoin: Target Zone Within ReachLTC has recently continued its decline, leading us to believe that the high for green wave B is likely already in place. Price is now just a short distance from our green Target Zone, which ranges from $78.52 to $64.53. Within this zone, we expect to see the low of orange wave ii. Afterward, orange wave iii should drive price above the resistance levels at $118.71 and $147.06.
Litecoinanalysis

Litecoin Slides Toward Key Support LevelsFenzoFx—Litecoin remains in a bear market, down 2.00% today and trading near $93.00 within the bullish fair value gap. Key support lies at $89.30. A break below this level could accelerate the downtrend, potentially driving the price toward $78.60.
If selling pressure continues, the next support zone is $71.70, aligned with the lower band of the bearish channel.

Litecoin: Bearish Setup Builds Below $101.00FenzoFx—Litecoin is up 1.60% today, trading near $101.00. The price declined after tapping the liquidity void at $112.30, aligned with the upper band of the bearish channel. Immediate support lies at $98.00. A close below this level could resume the downtrend, targeting $93.70.
If selling pressure persists, LTC may fill the bullish fair value gap with support at $89.30. The current momentum remains vulnerable to reversal.

LTC/USD Market Flow Blueprint – Bearish Bias Confirmed!🎯 LTC/USD: The Great Support Heist 🏴☠️ | Bearish Breakdown Blueprint
📊 Market Overview
Asset: LTC/USD (Litecoin vs. U.S. Dollar)
Market: Cryptocurrency
Trade Type: Swing Trade (Bearish Setup)
Strategy Style: "Thief Method" - Multi-Layer Limit Orders
🔍 Technical Analysis
Litecoin has officially broken through its STRONG SUPPORT ZONE, confirming a bearish market structure. This isn't just a casual dip—we're looking at a genuine breakdown that's validated by price action closing below critical support levels. The bears are in control, and the path of least resistance is pointing south. 🐻📉
What's Happening?
✅ Support zone broken with conviction
✅ Market structure showing lower highs forming
✅ Momentum shifting to the downside
✅ Volume confirming the breakdown
🎯 Trade Plan Breakdown
📍 Entry Strategy: "The Thief Layer Method"
Instead of going all-in at one price (rookie move 😅), we're using a multi-layer limit order strategy to build our position as price moves. Think of it as setting multiple traps along the way down.
Suggested Sell Limit Layers:
🎪 Layer 1: $92.00
🎪 Layer 2: $90.00
🎪 Layer 3: $88.00
Pro Tip: You can add more layers based on your risk appetite and position sizing strategy. Scale in, don't gamble in! 🎲
🛑 Stop Loss: $96.00
This stop is placed at the previous market structure's nearest higher high wick. Why? Because if price reclaims this level, it invalidates our bearish thesis and tells us the breakdown was fake news. 🚫
⚠️ IMPORTANT DISCLAIMER: This is MY stop loss based on MY analysis and risk tolerance. You should ALWAYS determine your own stop loss based on YOUR risk management rules. Trade your own plan, not mine! Your money, your rules. 💰
🎁 Target: $75.00
Our profit target sits at a confluence zone where we're expecting:
💎 Strong historical support
💎 Oversold conditions (RSI likely stretched)
💎 Bull trap potential zone
💎 Possible trend reversal area
This is where smart bears become bulls and take profits off the table. Don't be greedy—secure the bag! 💼
⚠️ IMPORTANT DISCLAIMER: This target is based on MY analysis. You should set YOUR OWN take profit levels based on YOUR trading plan and risk management. Lock in profits when YOU feel comfortable. Your capital, your decision! 🎯
🔗 Related Pairs to Watch
Keep an eye on these correlated assets for confluence:
BITSTAMP:BTCUSD - The king leads, alts follow. If Bitcoin dumps, LTC usually amplifies the move 👑
BITSTAMP:ETHUSD - Major alt indicator. Ethereum weakness = altcoin pain 🌊
BINANCE:LTCBTC - Shows LTC's relative strength against Bitcoin. Watch for breakdown here too 📊
TVC:DXY (Dollar Index) - Strong dollar = crypto weakness typically 💵
Correlation Play: Crypto markets move as a herd. When Bitcoin sneezes, Litecoin catches pneumonia. Watch BTC dominance and overall market sentiment. If BTC is showing weakness at key levels, it adds conviction to this LTC short setup. 🧩
📝 Key Takeaways
Confirmation is King - We're not guessing; the support break is confirmed ✅
Layer Your Entries - Don't blow your load at one price. Build the position strategically 🎯
Respect Your Risk - Stop loss is there for a reason. Use it. Love it. Don't delete it. 🛡️
Take Profits - The market doesn't care about your feelings. When you hit target, TAKE THE MONEY 💰
Stay Flexible - Markets change. If the setup invalidates, move on. No ego in trading 🧘
⚡ The Thief Philosophy
This isn't financial advice—it's a treasure map. 🗺️ You still have to dig, avoid the traps, and know when to run. The "Thief Method" is all about stealth entries, calculated risk, and knowing when to escape with the loot before the guards (market reversal) catch you.
We're not gambling; we're executing a heist. Plan the job, execute with discipline, and don't get caught holding bags. 🏴☠️💼
🎬 Final Words
Markets don't reward hope; they reward preparation and execution. This setup offers a solid risk-reward if you manage it properly. Remember: Your trade, your risk, your responsibility. I'm just sharing what I see and how I'm playing it.
Stay sharp, trade safe, and may your stop losses never get hit. 🎯🚀
✨ If you find value in my analysis, a 👍 and 🚀 boost is much appreciated — it helps me share more setups with the community!
#LTCUSD #Litecoin #CryptoTrading #BearishSetup #SwingTrade #TechnicalAnalysis #ThiefMethod #CryptoAnalysis #TradingStrategy #ShortSetup #CryptoTA #LTC #SupportBreakdown #LayeredEntry #RiskManagement

Bearish Engulfing Signals Downside for LitecoinFenzoFx—Litecoin filled 25% of the bearish fair value gap from Friday’s selloff, tapping into the $106.00 liquidity zone. The last candle is a bearish engulfing, signaling potential downside as both buyside and sell side liquidities were swept.
Resistance sits at $106.00. If this level holds, the downtrend may extend toward $85.50 and $78.60. The bearish outlook remains valid unless LTC/USD closes above $106.00 on the daily chart. A break above this level could trigger a move toward the upper line of the bearish channel.

Litecoin: Rally Stays on TrackLitecoin (LTC) has continued its steady upward climb. Under our primary scenario, the ongoing magenta wave is expected to sustain this momentum and push price above the resistance level at $147.06. However, if price falls below support at $50.22, our alternative scenario will come into play (probability: 40%), signaling the potential for further selling pressure.

No Bullish Setup for Litecoin YetFenzoFx—Litecoin is trading sideways near $98.3 after Friday’s sharp selloff. The 1-hour chart shows price respect at $92.40 minor support, but declining cumulative volume delta signals weakening buyer interest.
The overall trend remains bearish, with resistance at $102.4. LTC may tap into buyside liquidity above $102.9, but failure to hold could extend the downtrend toward $85.5 and $78.6. There’s no bullish setup at the time of writing. Traders should remain cautious, as the market is volatile and prone to erratic swings. Happy trading, everyone.

LTC: Sell Volume Is Being Absorbed, Bullish Run in FocusFenzoFx—LTC sits in the upper quadrant of the bullish fair value gap, aligned with anchored VWAP. Selling volume is rising, but price remains stable—suggesting absorption by large buyers.
Litecoin is currently at a premium, making it less ideal for new entries. We recommend monitoring the $109.3 support zone, backed by a low volume node, for a better entry.
If this level holds, LTC may rally toward $128.60 and $134.10. A break below $109.3 would invalidate the bullish outlook.

LTC/USD May Tap $110.5 Before DropFenzoFx—Litecoin is trading sideways. We expect LTC/USD to tick higher toward $110.5 before resuming its downtrend. If this scenario unfolds, the next bearish target is the $88.00 support area.
Please note, the bearish outlook remains valid unless price closes and stabilizes above the fair value gap near $114.00.

Litecoin: Bearish Outlook Holds Below $114FenzoFx—Litecoin dipped below $103.10 liquidity and rebounded, now trading around $105.9. The trend remains bearish, supported by lower lows and volume profile.
Following the sweep, LTC/USD may consolidate toward resistance, targeting the daily FVG mean threshold near $110.5. If buying pressure continues, the gap could be filled up to $114.00.
The bearish outlook remains valid below $114.00, with potential downside targeting liquidity at the $88.00 area. A close above $114.00 would invalidate this view.

Litecoin: Liquidity Sweep Signals ConsolidationFenzoFx—Litecoin dipped to $103.0, its lowest in 40 trading days, and now trades near $106.5, recovering 0.70% today. Support remains at $103.00. Liquidity below this level has been swept, suggesting an inside candle formation. The sharp decline left a fair value gap with a mean threshold at $110.3.
Technically, Litecoin stays bearish below $112.0. However, the recent liquidity sweep points to a possible consolidation toward $110.3. Note: The bearish outlook is invalidated if LTC/USD exceeds $112.0.

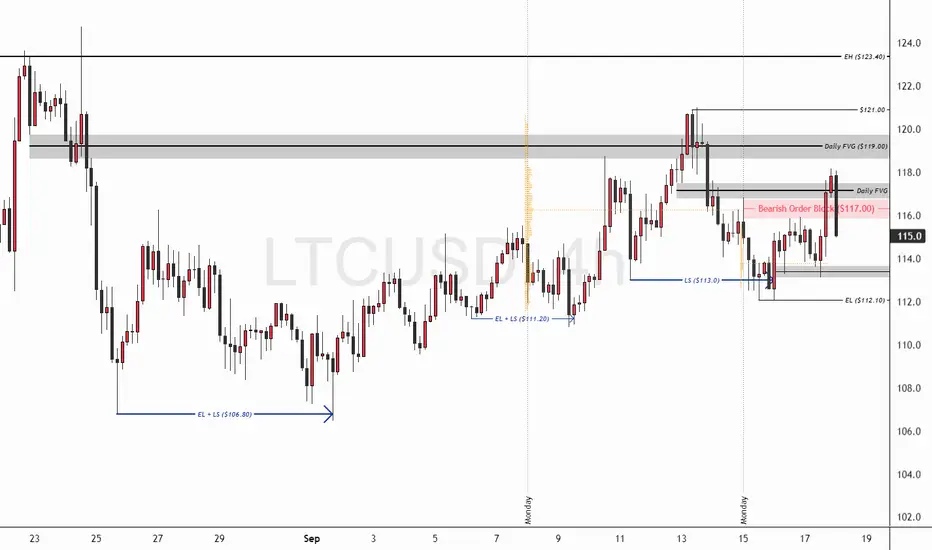
Litecoin: Support at $112.10 Key to ContinuationFenzoFx—Litecoin continues its bullish structure, trading around $116.4 after forming a double bottom below $113.00. This move led to a close above the bearish order block at $117.00, reinforcing bullish sentiment.
Immediate support is at $112.10. If this level holds, LTC/USD may resume its uptrend, targeting the equal highs at $123.40.
However, if price declines and stabilizes below $112.10, the bullish outlook will be invalidated. In that case, Litecoin could consolidate toward the next support at $106.80.
Litecoin Stabilizes After Liquidity SweepFenzoFx—Litecoin trades sideways, up nearly 1.0% today, currently around $113.80. The recent momentum may stem from the liquidity sweep below $106.80 on September 1st. However, RSI hovers above 70.0, indicating overbought conditions.
Immediate resistance stands at $116.30. Technically, Litecoin hasn’t cleared significant buy-side liquidity, so we remain neutral until price reaches this level. The resistance appears to be the next target following the sell-side liquidity sweep.

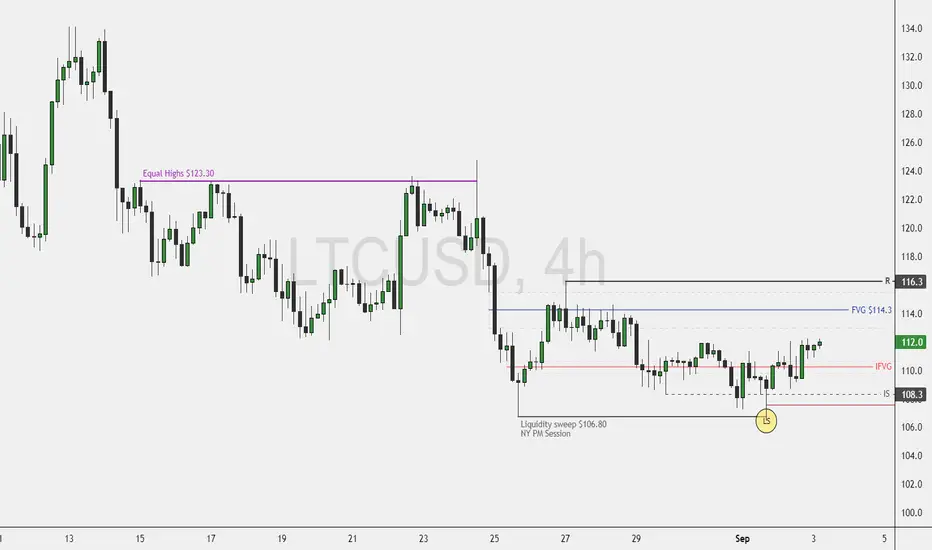
Litecoin Eyes Higher ResistanceFenzoFx—Litecoin’s bearish momentum eased after sweeping the $106.80 low in New York’s late PM session. The price is now stabilizing above the inverted fair value gap at $111.90.
While BCH and XRP surged yesterday, Litecoin lagged. However, equal highs at $114.30 and $123.30 suggest potential upside. LTC/USD could reach $116.30, and if buying pressure continues, a rally toward $123.30 is likely.
Note: The bullish outlook is invalidated if the price dips below $106.80.
Litecoin Eyes Reversal from $112.5 SupportFenzoFx—Litecoin currently trades near $115.5, having swept last week's low liquidity. This level is supported by a bullish fair value gap, with key support at $112.5, offering a potential reversal point.
Immediate resistance stands at $117.4. A close above this level could trigger a bullish wave toward the next supply zone at $123.3.

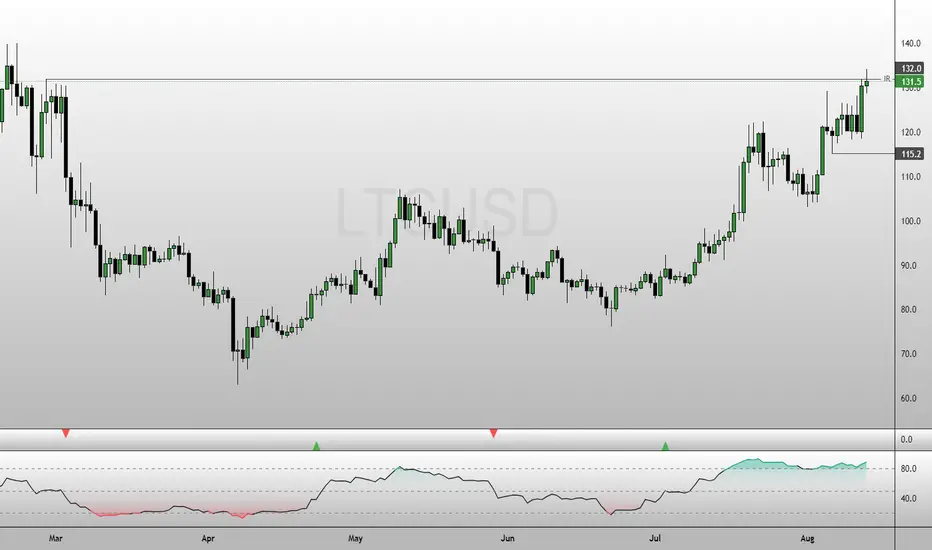
Litecoin Pulls Back After Sweeping February HighsFenzoFx—Litecoin swept liquidity above February’s highs. The market is currently overbought, suggesting potential consolidation. Entering at current levels may be risky, so waiting for a pullback toward lower support zones is advised.
If consolidation unfolds, LTC could target liquidity near the $115.2 support level.
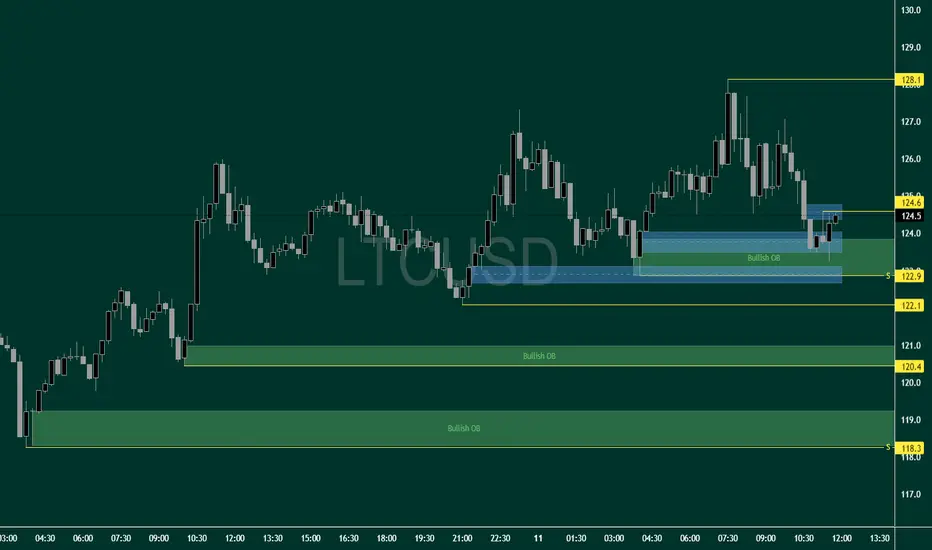
Litecoin Tests Bullish Order BlockFenzoFx—Litecoin dipped to the bullish order block. A close above $124.6 with a fair value gap could trigger the uptrend, targeting recent highs at $128.1.
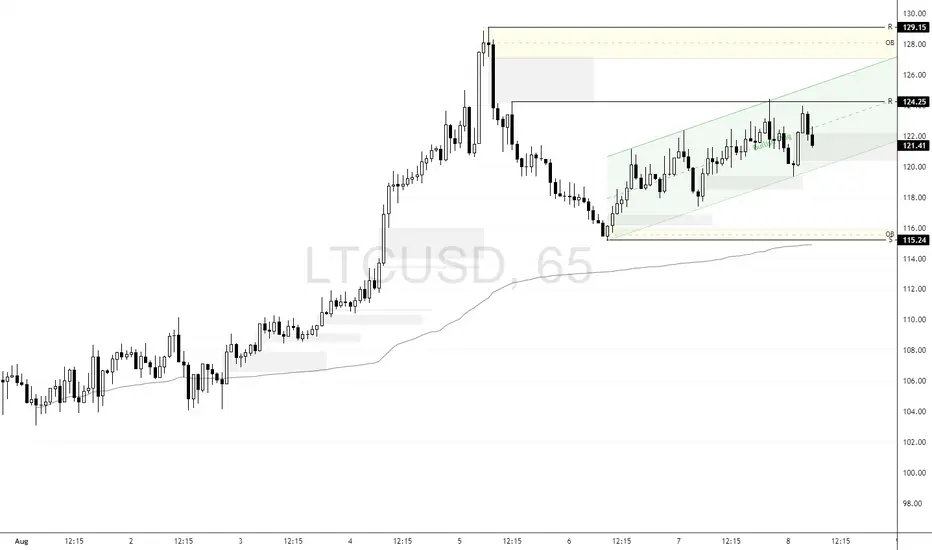
Litecoin Eyes Buy Side Liquidity Shift After $124.2 SweepFenzoFx—Litecoin remains in a bullish channel, with the current wave originating from the order block at $115.2. LTC now trades around $121.7.
Yesterday, it swept liquidity above the $124.2 resistance, signaling a potential shift toward bearish pressure. If momentum fades, price may revisit the $115.2 support zone.
However, if LTC/USD closes above $124.2, this bearish outlook is invalidated. In that case, the next target is the order block with resistance at $129.1.
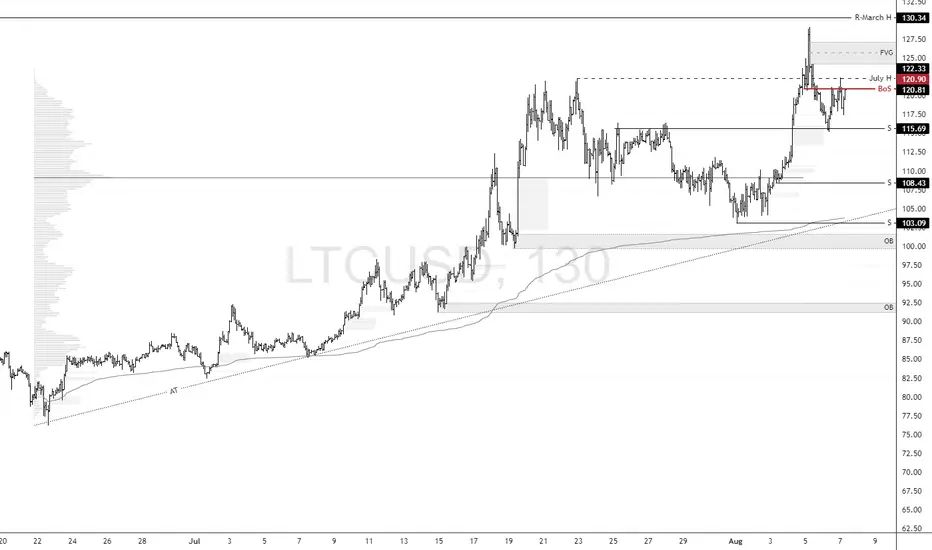
Litecoin: Eyeing Discount Entry Near $108FenzoFx—Litecoin's uptrend stalled near March’s peak at $130.3, a strong resistance level. The price now trades at $120.7, below July’s high, breaking the bullish structure.
Immediate support lies at $115.6. A bearish close below this level could trigger further downside toward $108.4. This zone is backed by a volume point of interest, offering a potential discount entry aligned with the broader bullish trend.
LTC: Bullish Structure Intact Above $104.3 SupportFenzoFx—Litecoin swept liquidity below $107.0 during today’s session and is currently trading near $110.0, supported by a descending trendline.
Technically, key support stands at $104.3. As long as this level holds, the bullish outlook is preserved. A break above the descending trendline could propel LTC toward the previous highs at $116.4 and potentially $122.3.
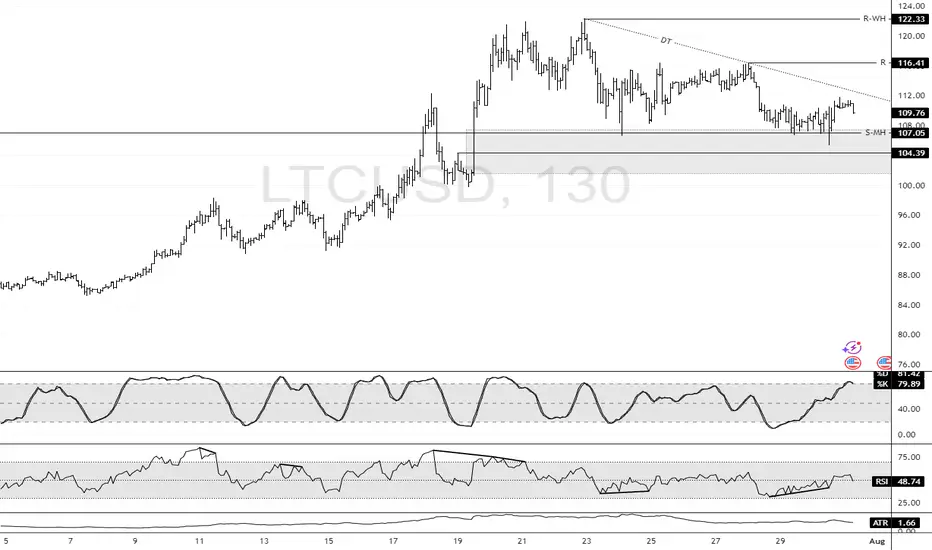
Litecoin: VWAP and Oversold Signal Potential BounceFenzoFx—Litecoin formed a double top at $116.4, causing a price dip. Currently, LTC trades near $110.1 after forming a double bottom. The Stochastic Oscillator is in oversold territory, suggesting a potential bounce, supported by VWAP from July 15.
Technically, if LTC holds above $110.1 and key support at $104.0, the uptrend could resume. In this scenario, the bullish targets would be $116.4 and $122.3.

Litecoin Rebounds Off Trendline in Bullish Continuation SetupFenzoFx—Litecoin rebounded from the ascending trendline, a demand zone supported by the VWAP from July 25th.
Immediate resistance stands at $114.3. A close above this level may resume the bullish trend, potentially targeting previous highs near $114.3.

Litecoin - Expecting Bullish Continuation In The Short TermH4 - We have a clean bullish trend with the price creating a series of higher highs, higher lows structure.
This strong bullish momentum is followed by a pullback.
No opposite signs.
Until the two Fibonacci support zones hold I expect the price to move higher further.
If you enjoy this idea, don’t forget to LIKE 👍, FOLLOW ✅, SHARE 🙌, and COMMENT ✍! Drop your thoughts and charts below to keep the discussion going. Your support helps keep this content free and reach more people! 🚀
--------------------------------------------------------------------------------------------------------------------
