Canary Litecoin ETF | LTCC | Long at $16.90Litecoin's price has returned nearly to my original $65 entry in 2024 . With Litecoin's halving scheduled in 2027, I am bullish long-term. Short-term could be volatile. Instead of the coin, I'm going into the ETF at $16.90 for less fees and easier management.
Targets into 2029
$21.00 (+24.3%)
$25.50 (+50.9%)
Litecoinforecast

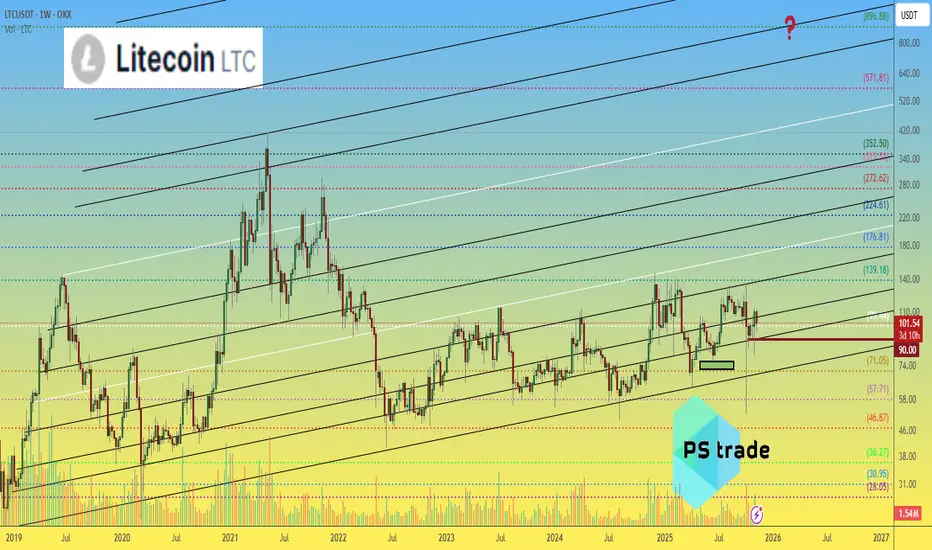
Litecoin LTC price analysis📉 For weeks, OKX:LTCUSDT has been holding strong
And guess what — this consolidation has lasted over 3.5 years! 😮
💭 The last real pump was back in early 2021... feels like it’s time for a sequel, right? 😉
Now, here’s the interesting part:
🔹 Litecoin has the same tokenomics and mining method as Bitcoin ( CRYPTOCAP:BTC ) and
🔹 Recently, another “old school” coin — CRYPTOCAP:ZEC — just pumped hard 💥
🔹 And there are rumors about a potential LTC ETF 😏
With a current market cap of only $7.7B, there’s plenty of room to grow.
So maybe... just maybe... CRYPTOCAP:LTC at $900 isn’t that crazy after all? 🚀
What do you think — are we on the verge of a new #Litecoin era? 👇
______________
◆ Follow us ❤️ for daily crypto insights & updates!
🚀 Don’t miss out on important market moves
🧠 DYOR | This is not financial advice, just thinking out loud
LTCUSDT Bullish Structure – Is This the Next Expansion Leg?📊 LTC/USDT "DIGITAL SILVER" BULLISH BREAKOUT 🚀 | Swing Trade Profit Setup
🎯 TRADE OVERVIEW
Asset: Litecoin vs Tether (LTC/USDT)
Timeframe: 4H / Daily
Current Price: $77.32 USDT
Strategy Type: Swing Trade (Bullish Recovery)
Market Condition: Oversold with Bullish Divergence ⚡
Fear & Greed Index: 21 (Extreme Fear) 👻 = BUY OPPORTUNITY
📈 TECHNICAL CONFIRMATION (Real Market Data - Jan 2, 2026)
✅ 200-Day Simple Moving Average: $99.38 USDT (Strong Resistance Zone)
✅ 50-Day SMA: $83.76 USDT (Critical Breakout Level)
✅ 20-Day SMA: $78.90 USDT (Current Support)
✅ MACD Histogram: +0.3048 (BULLISH DIVERGENCE FORMING) 🔥
✅ RSI (14): 43.16 (Neutral - Room for Upside Movement)
✅ 24H Volume: $14.9M - $273.6M (Healthy Liquidity)
✅ Bollinger Bands: Mid-band at $80.74 (Target Zone)
🎪 ENTRY STRATEGY: "LAYERING METHOD" (Thief OG Style)
Entry Approach: Multiple Limit Orders / Scale-In Method
Layer 1️⃣ (Accumulation Zone)
Entry Point: $76.00 - $76.50 USDT
Risk Reward: Solid Foundation Builder
Size: 35% of position
Layer 2️⃣ (Breakout Confirmation)
Entry Point: $78.00 - $78.50 USDT
Risk Reward: Post-Consolidation Entry
Size: 35% of position
Layer 3️⃣ (Momentum Confirmation)
Entry Point: $80.00 - $81.00 USDT
Risk Reward: Strong Momentum Signal
Size: 30% of position
💡 PRO TIP: Scale into positions gradually. This reduces panic selling and locks in better average entry prices during volatility.
🛑 STOP LOSS PLACEMENT (Risk Management is KING 👑)
Recommended Stop Loss: $74.00 USDT
Hard SL Breakdown: $72.64 USDT (Technical Support)
Emergency SL: $70.00 USDT (Psychological Level)
Risk Calculation:
From Entry at $78.00 → SL at $74.00 = 5.1% Risk Per Trade
Position Size = 1-2% of Portfolio Risk (Suggested)
⚠️ IMPORTANT DISCLAIMER: This is YOUR decision. Adjust SL based on YOUR risk tolerance and account size. Never risk more than you can afford to lose!
🎯 PROFIT TARGETS (Cascading Exit Strategy)
🥉 Target 1 (Initial Profit Take) - 50% Position
TP1: $82.00 - $84.59 USDT
Gain: +5% to +8.3% from entry
Action: Lock in early profits, reduce risk to zero
🥈 Target 2 (Mid-Range Resistance) - 30% Position
TP2: $87.00 - $88.00 USDT (Key Analyst Consensus)
Gain: +11.5% to +12.8% from entry
Action: Trail stop-loss to breakeven
🥇 Target 3 (Major Resistance Break) - 20% Position
TP3: $95.00 - $100.00 USDT (Extended Target)
Gain: +21.8% to +28% from entry
Action: Ride momentum with trailing stop
🚀 STRETCH TARGET (Q1 2026)
Extended Target: $113.71 - $115.00 USDT
Gain: +45% to +47.2%
Condition: Sustained break above $87 with volume confirmation
⚠️ IMPORTANT DISCLAIMER: TP targets are based on technical analysis. Market conditions change. Your profit-taking strategy is YOUR choice. Manage position size wisely!
📊 TECHNICAL ANALYSIS BREAKDOWN
Bullish Signals 🟢
✅ MACD Histogram turning positive (Early momentum shift)
✅ Price above 7-day & 20-day SMA (Short-term uptrend)
✅ RSI in neutral zone (Not overbought = room to run)
✅ Recent consolidation at $74.66 support (Buyers defending)
✅ Oversold conditions (Often precede reversals)
✅ 24H Change: +3.29% (Momentum building)
Bearish Headwinds ⚠️
🔴 Price below 50-day SMA ($83.76) - Medium-term bearish
🔴 Price below 200-day SMA ($99.38) - Long-term bearish
🔴 Weekly Technical Rating: SELL (Mixed signals persist)
🔴 Volatility: 1.91% (Potential sharp moves both directions)
Verdict: Mixed setup = Wait for confirmation before scaling in!
🔗 CORRELATED PAIRS TO MONITOR
Direct Correlation 0.58-0.76
BTC/USDT (Bitcoin) 🔗
Correlation: 0.76 (Very High)
Why Important: LTC follows BTC dominance closely
Action: Monitor BTC chart for macro direction
Current BTC: Trading sideways (Neutral Signal for LTC)
Related Altcoins to Watch 📍
ETH/USDT (Ethereum) 📊
Correlation: 0.559 (Moderate-High)
Significance: Broader altcoin momentum
DOGE/USDT (Dogecoin) 🐕
LTC Weekly Correlation: +0.472
Signal: When alts pump together, LTC often leads
SEI, RENDER, DASH (Sector Leaders) ⭐
7-Day Correlation: +0.50-0.60
Importance: Monitor these for LTC breakout confirmation
💼 FUNDAMENTAL & MACRO FACTORS AFFECTING LTC (Jan 2026)
BULLISH CATALYSTS 🟢
1️⃣ LitecoinVM Layer-2 Launch (Q1 2026 Mainnet)
Status: Testnet Active (Dec 25, 2025)
Impact: Transforms LTC from "Digital Silver" → Programmable Web3 Hub
Details: EVM-compatible smart contracts via Polygon CDK
Significance: Attracts DeFi developers, increases utility
Timeline: Mainnet expected Q1 2026 (Could trigger rally)
2️⃣ MWEB Privacy Upgrade Adoption
Current Status: 90%+ of nodes validating MimbleWimble transactions
Volume Locked: 245,000+ LTC in private transactions
Impact: Enhanced fungibility without sacrificing speed
Implication: Increased demand from privacy-conscious users
3️⃣ Spot ETF Approval Prospects
Status: 3 US ETFs Under SEC Review (Grayscale, Canary, CoinShares)
Approval Odds: 68-90% by end-2025/early-2026
Potential Inflows: $400M-$500M if approved
Historical Precedent: Bitcoin ETF approval drove massive rallies
4️⃣ Institutional Accumulation
Latest Data: Lite Strategy (NASDAQ: LITS) holds 929,548 LTC (~$73M)
Signal: Corporate treasuries adding LTC like Bitcoin playbook
Market Impact: Reduces available supply for retail
5️⃣ Block Reward Halving Cycle ⏰
Last Halving: August 2023
Next Halving: 2027 (Scarcity narrative building)
Max Supply: 84 Million LTC (Fixed cap = deflationary)
BEARISH RISKS 🔴
⚠️ Binance Delisting Alert
Issue: 7 LTC margin pairs delisting Jan 6, 2026
Impact: Reduced leverage trading volume
Severity: Moderate (Spot trading unaffected)
⚠️ BTC Dominance at 59%
Concern: High BTC dominance leaves less capital for altcoins
Watch Level: If BTC dominance drops below 55% = Altcoin season
Current Status: Neutral-bearish for LTC
⚠️ Regulatory Uncertainty
MWEB Privacy Risk: Increased privacy use may attract regulatory scrutiny
Impact: Potential compliance challenges ahead
⚠️ Economic Data Releases
Upcoming: Fed Policy (Jan 29), Unemployment (Feb 7)
Risk: Hawkish signals could trigger broad crypto selloff
Monitor: Fed futures market for rate probability changes
🎬 ACTION PLAN FOR TRADERS
Before Entry ✅
Confirm support holding above $74.66
Wait for MACD histogram to cross above signal line
Check BTC chart for macro direction (critical!)
Scan news for ETF announcements or LitVM updates
During Entry 📍
Scale in using layer method (Don't FOMO all-in)
Set stop-loss FIRST before market order
Use limit orders for better entry prices
Document your entry prices for reference
After Entry 🚀
Take 50% profit at $82-84 level
Move stop to breakeven ($78.00)
Trail stop on remaining position
Monitor related pairs (BTC, ETH, DOGE) for confluence
Watch for ETF approval news (Major catalyst!)
Exit Strategy 🏁
Never hold through major economic news without reason
If LitVM news is negative = exit immediately
If BTC breaks below $85K = reduce position
Q1 2026 ETF decision = major milestone target
📌 KEY LEVELS SUMMARY (Cheat Sheet)
RESISTANCE ZONES:
🔴 $100.00 ← Psychological + Long-term target
🟠 $95.00 ← Analyst consensus (Short-term TP)
🟠 $87.00 ← Major resistance zone
🟡 $84.59 ← Immediate breakout level
🟡 $82.00 ← First profit-taking zone
CURRENT PRICE: $77.32 USDT
SUPPORT ZONES:
🟢 $76.00 ← Layer entry zone
🟢 $74.66 ← Critical support (Hard stop here!)
🔵 $72.64 ← Emergency support level
⚖️ RISK ASSESSMENT & DISCLOSURE
Trade Confidence Level: MEDIUM (60%)
Key Risk: Depends on support holding + BTC correlation
Reward Potential: +21-47% (Medium-term)
Volatility Expected: Moderate to High
🎓 FOR LEARNERS
Study: Litecoin's correlation with Bitcoin (0.76)
Practice: Identify support/resistance zones on your charts
Remember: Technical analysis is probability, not certainty
Execute: Small position sizes while building skill
Improve: Keep a trading journal for every decision
Good luck Thief OG's! Remember: "The best trade is the one where you keep your capital." 💰

Litecoin Below 70$ Soon.#Litecoin Below 70$ Soon...
After that it'll go for exit liquidity .
Be Safe Guys.

LITECOIN IS FULLY CHARGEDHey traders! LTC has been quietly accumulating energy in this tight range for days — all the coils are compressed, and the spring is about to pop!
I’m expecting a strong impulsive move upward very soon.
My targets:
🎯 Target 1 — 89
🎯 Target 2 — 91.20 (main zone I’m watching)
❌Invalidation (plan cancelled): 85.89
If we break and hold above the recent highs, this thing can run fast. Watching it closely!
Who’s in? Smash the like & follow for updates 🔥

Litecoin: Target Zone Within ReachLTC has recently continued its decline, leading us to believe that the high for green wave B is likely already in place. Price is now just a short distance from our green Target Zone, which ranges from $78.52 to $64.53. Within this zone, we expect to see the low of orange wave ii. Afterward, orange wave iii should drive price above the resistance levels at $118.71 and $147.06.

Litecoin Slides Toward Key Support LevelsFenzoFx—Litecoin remains in a bear market, down 2.00% today and trading near $93.00 within the bullish fair value gap. Key support lies at $89.30. A break below this level could accelerate the downtrend, potentially driving the price toward $78.60.
If selling pressure continues, the next support zone is $71.70, aligned with the lower band of the bearish channel.

Litecoin: Bearish Setup Builds Below $101.00FenzoFx—Litecoin is up 1.60% today, trading near $101.00. The price declined after tapping the liquidity void at $112.30, aligned with the upper band of the bearish channel. Immediate support lies at $98.00. A close below this level could resume the downtrend, targeting $93.70.
If selling pressure persists, LTC may fill the bullish fair value gap with support at $89.30. The current momentum remains vulnerable to reversal.

LTCUSDT - Time to wake up for this Monster!As usual, any popular coin like LTC tends to make you lose hope right before a major rally — it usually forms a bearish-looking triangle, breaks downward, and makes everyone think a bear market has started.
Here’s how you know it’s actually preparing to pump:
It gives a very bearish signal on the chart — spot traders panic sell at a loss, long traders get liquidated or trapped, and short traders start feeling confident right before price reverses and pumps hard.
When everyone’s losing, that’s when the path upward becomes clear and safe.
I believe a 100% move from here is the minimum we’ll see.
Best Regards:
Ceciliones🎯
Bearish Engulfing Signals Downside for LitecoinFenzoFx—Litecoin filled 25% of the bearish fair value gap from Friday’s selloff, tapping into the $106.00 liquidity zone. The last candle is a bearish engulfing, signaling potential downside as both buyside and sell side liquidities were swept.
Resistance sits at $106.00. If this level holds, the downtrend may extend toward $85.50 and $78.60. The bearish outlook remains valid unless LTC/USD closes above $106.00 on the daily chart. A break above this level could trigger a move toward the upper line of the bearish channel.

Litecoin: Rally Stays on TrackLitecoin (LTC) has continued its steady upward climb. Under our primary scenario, the ongoing magenta wave is expected to sustain this momentum and push price above the resistance level at $147.06. However, if price falls below support at $50.22, our alternative scenario will come into play (probability: 40%), signaling the potential for further selling pressure.

No Bullish Setup for Litecoin YetFenzoFx—Litecoin is trading sideways near $98.3 after Friday’s sharp selloff. The 1-hour chart shows price respect at $92.40 minor support, but declining cumulative volume delta signals weakening buyer interest.
The overall trend remains bearish, with resistance at $102.4. LTC may tap into buyside liquidity above $102.9, but failure to hold could extend the downtrend toward $85.5 and $78.6. There’s no bullish setup at the time of writing. Traders should remain cautious, as the market is volatile and prone to erratic swings. Happy trading, everyone.

LTC: Sell Volume Is Being Absorbed, Bullish Run in FocusFenzoFx—LTC sits in the upper quadrant of the bullish fair value gap, aligned with anchored VWAP. Selling volume is rising, but price remains stable—suggesting absorption by large buyers.
Litecoin is currently at a premium, making it less ideal for new entries. We recommend monitoring the $109.3 support zone, backed by a low volume node, for a better entry.
If this level holds, LTC may rally toward $128.60 and $134.10. A break below $109.3 would invalidate the bullish outlook.

LTC/USD May Tap $110.5 Before DropFenzoFx—Litecoin is trading sideways. We expect LTC/USD to tick higher toward $110.5 before resuming its downtrend. If this scenario unfolds, the next bearish target is the $88.00 support area.
Please note, the bearish outlook remains valid unless price closes and stabilizes above the fair value gap near $114.00.

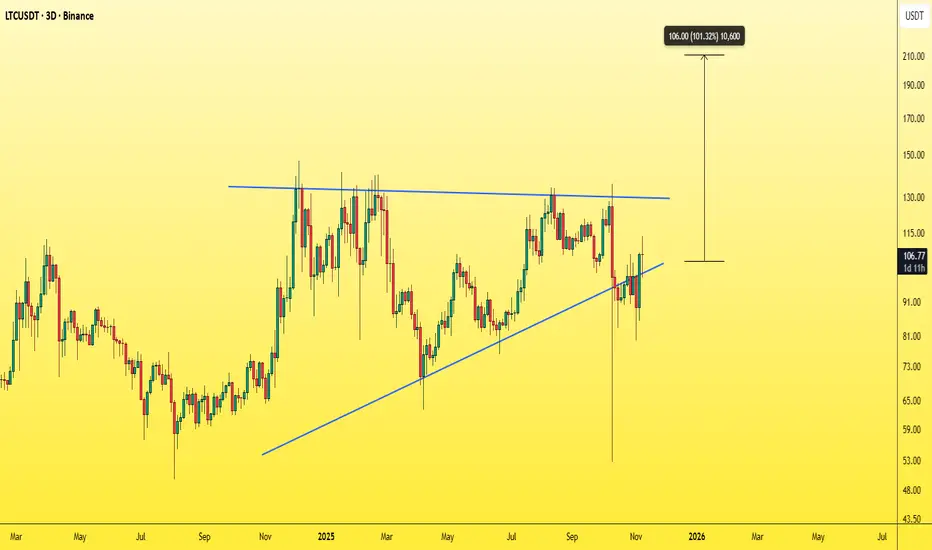
LTCUSD Is Breaking Out3Month Chart on this one
The RSI clearly shows a pivot upwards at this middle line
Price is also within a large triangle which could be considered a bullflag in my mind
I think price will break out of this triangle spectacularly.
Green circles are very similar price formations.
Very Good Long Choice as an altcoin.


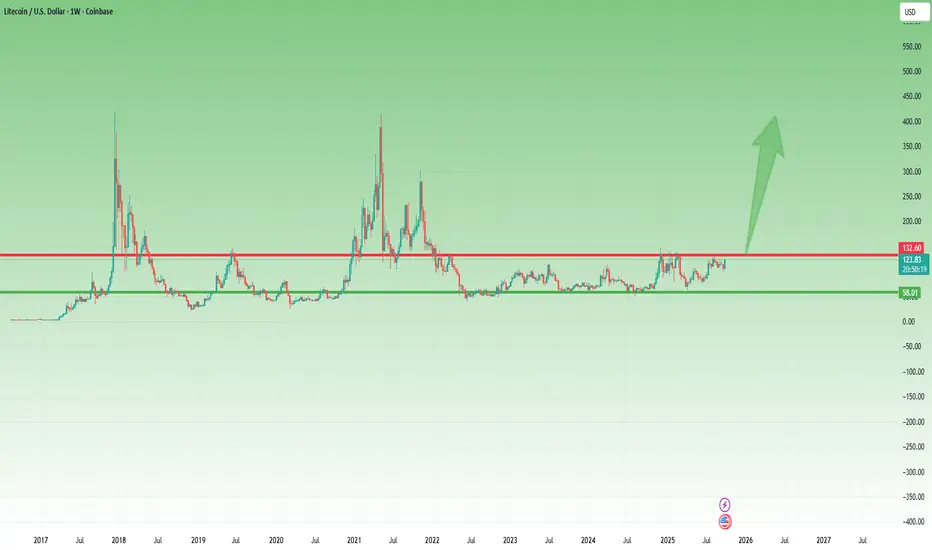
Litecoin Ready to Explode After 3 Years of SleepIn recent years, with the flood of new crypto projects, Litecoin has quietly faded into the background.
Since the local low in May 2022, the price action has been rather lethargic, contained within a well-defined range between 60 and 130 USD.
However, since April 2025, something interesting has been happening — Litecoin seems to be waking up, quietly and almost secretly, as if not to attract too much attention.
From that point onward, LTC/USD has been steadily printing higher lows, and if we zoom out to the longer-term chart, the structure looks remarkably clean — almost textbook — for a potential breakout setup.
Even recently, after another touch of the resistance zone, the correction that followed took the form of a bullish flag, and last week’s strong engulfing candle practically erased an entire month of pullback, now pressing once again against the key resistance level.
In my opinion, it’s time for this cryptocurrency to wake up.
A clear break above 130 would be a strong technical confirmation of that view.
While Litecoin might not deliver the “10x hype” potential that newer tokens promise, it has consistently proven to be one of the most stable and resilient assets in the crypto space.
After three years of accumulation, a breakout could easily trigger an explosive move to the upside.
📈 I’m personally buying Litecoin, with a target around 300 USD in the medium term.
Sometimes, the coins everyone forgets about are the ones that surprise the most. 🚀
Litecoin: Bearish Outlook Holds Below $114FenzoFx—Litecoin dipped below $103.10 liquidity and rebounded, now trading around $105.9. The trend remains bearish, supported by lower lows and volume profile.
Following the sweep, LTC/USD may consolidate toward resistance, targeting the daily FVG mean threshold near $110.5. If buying pressure continues, the gap could be filled up to $114.00.
The bearish outlook remains valid below $114.00, with potential downside targeting liquidity at the $88.00 area. A close above $114.00 would invalidate this view.

Litecoin: Liquidity Sweep Signals ConsolidationFenzoFx—Litecoin dipped to $103.0, its lowest in 40 trading days, and now trades near $106.5, recovering 0.70% today. Support remains at $103.00. Liquidity below this level has been swept, suggesting an inside candle formation. The sharp decline left a fair value gap with a mean threshold at $110.3.
Technically, Litecoin stays bearish below $112.0. However, the recent liquidity sweep points to a possible consolidation toward $110.3. Note: The bearish outlook is invalidated if LTC/USD exceeds $112.0.

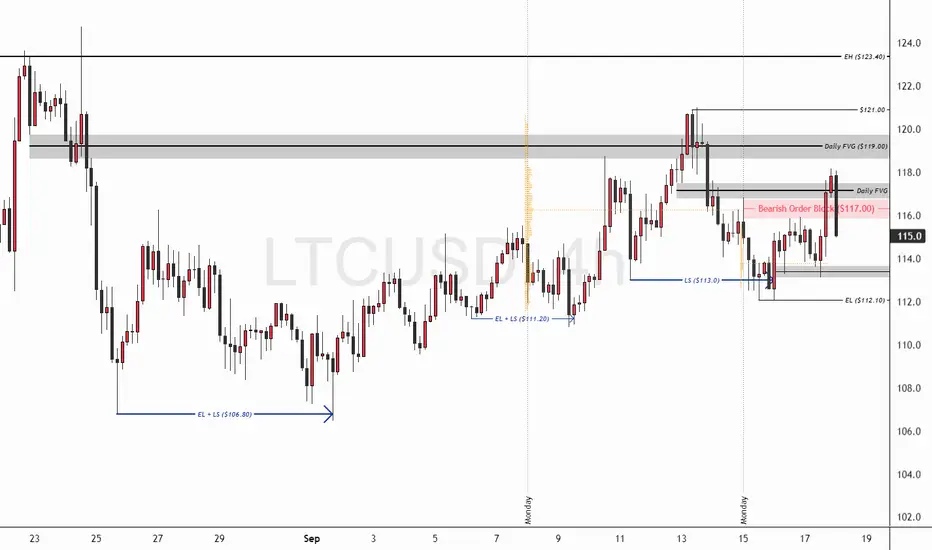
Litecoin: Support at $112.10 Key to ContinuationFenzoFx—Litecoin continues its bullish structure, trading around $116.4 after forming a double bottom below $113.00. This move led to a close above the bearish order block at $117.00, reinforcing bullish sentiment.
Immediate support is at $112.10. If this level holds, LTC/USD may resume its uptrend, targeting the equal highs at $123.40.
However, if price declines and stabilizes below $112.10, the bullish outlook will be invalidated. In that case, Litecoin could consolidate toward the next support at $106.80.
Litecoin Stabilizes After Liquidity SweepFenzoFx—Litecoin trades sideways, up nearly 1.0% today, currently around $113.80. The recent momentum may stem from the liquidity sweep below $106.80 on September 1st. However, RSI hovers above 70.0, indicating overbought conditions.
Immediate resistance stands at $116.30. Technically, Litecoin hasn’t cleared significant buy-side liquidity, so we remain neutral until price reaches this level. The resistance appears to be the next target following the sell-side liquidity sweep.

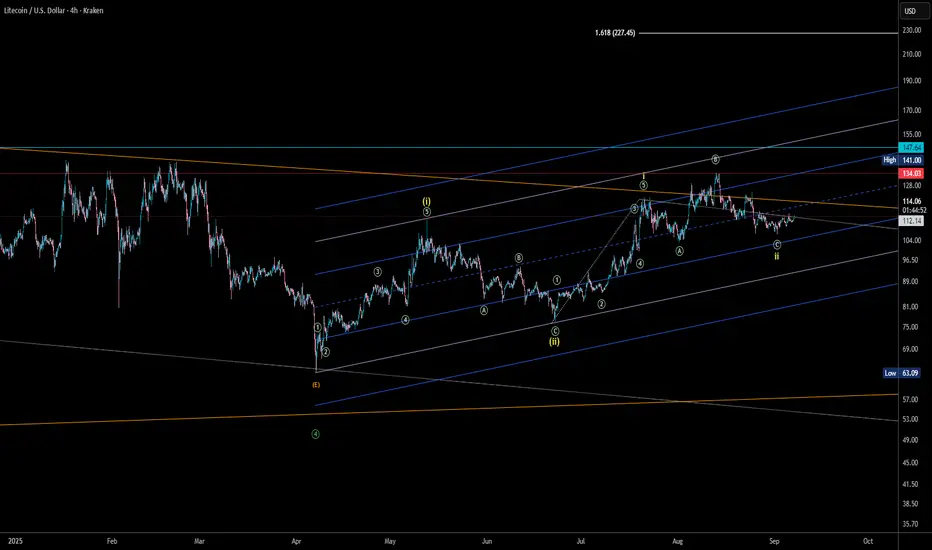
LTC 4H, 1-2 nestedLTC/USD pair seems to getting out of a running flat correction (the last ABC in light green), building a 1-2, 1-2 (nested 1-2). This structure shall give us some ripping candles to the upside very soon. The confirmation of the inner 1-2 is at the 1.6 = 227USD, if we don't build another 5 waves, 3 corrective to keep nesting.
Overall, if we pump, its a very bullish base to pump, if we make a 5 wave corrective and retrace, its just more bullish.
Historical tops where in November, just one time in May. Keep the eyes white open.
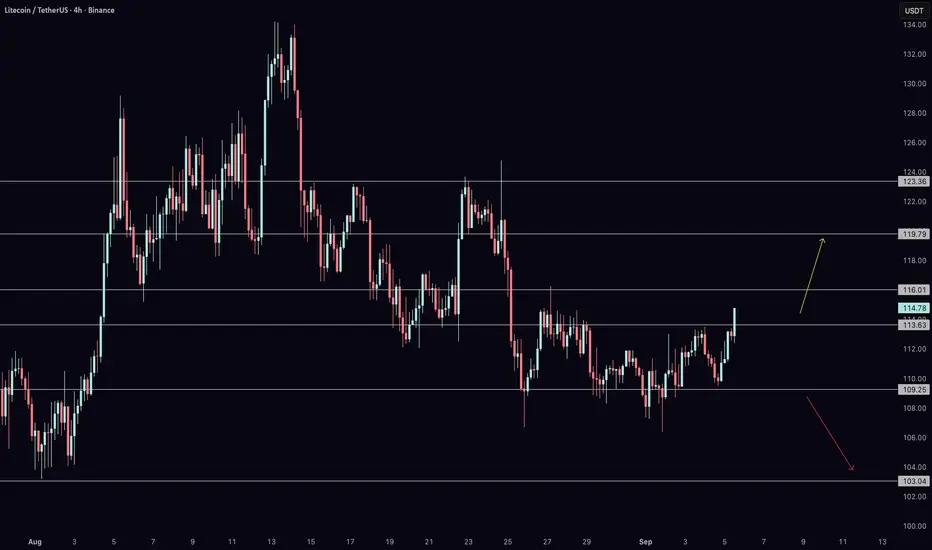
LTC reakout Loading? Targets $137 and Beyond After NFP Shock!Litecoin (LTC) continues to hold key support around $109 despite recent volatility, setting up for another upside push. With the Non-Farm Payrolls report coming in significantly weaker than expected, risk assets like crypto have gained a bullish backdrop as the Fed faces pressure to lean dovish. In this video, I break down LTC’s daily and 4-hour charts, highlighting the crucial demand and resistance levels that will shape the next move.
As long as LTC holds above $109, the structure remains constructive with targets toward $119.8, $123.4, and $137 in play. A breakout above those levels would open the path toward $168, aligning with the broader bullish setup across the crypto market. With Bitcoin showing resilience, Litecoin is well-positioned to continue its recovery in the sessions ahead.