LITECOIN can easily hit $43 in the next 10 months.Litecoin (LTCUSD) started its new Bear Cycle after a rejection on the 4-year Lower Highs trend-line. Now that it sits below its 1W MA200 (orange trend-line), which was formally a Resistance during the Bull Cycle, we can claim that the next stage should be targeting the Higher Lows 1 trend-line.
Given that all previous Bear Cycles lasted for at least a year and that the last one dropped less than the 2018, we can expect LTC's new Bear Cycle to last up until August 2026 at least. Even a 'modest' decline should still see it targeting Higher Lows trend-line 2, which by the end of August 2026 should have hit $43.00 at least.
---
** Please LIKE 👍, FOLLOW ✅, SHARE 🙌 and COMMENT ✍ if you enjoy this idea! Also share your ideas and charts in the comments section below! This is best way to keep it relevant, support us, keep the content here free and allow the idea to reach as many people as possible. **
---
💸💸💸💸💸💸
👇 👇 👇 👇 👇 👇
Litecoinsignals

Litecoin Slides Toward Key Support LevelsFenzoFx—Litecoin remains in a bear market, down 2.00% today and trading near $93.00 within the bullish fair value gap. Key support lies at $89.30. A break below this level could accelerate the downtrend, potentially driving the price toward $78.60.
If selling pressure continues, the next support zone is $71.70, aligned with the lower band of the bearish channel.

Litecoin: Bearish Setup Builds Below $101.00FenzoFx—Litecoin is up 1.60% today, trading near $101.00. The price declined after tapping the liquidity void at $112.30, aligned with the upper band of the bearish channel. Immediate support lies at $98.00. A close below this level could resume the downtrend, targeting $93.70.
If selling pressure persists, LTC may fill the bullish fair value gap with support at $89.30. The current momentum remains vulnerable to reversal.

Bearish Engulfing Signals Downside for LitecoinFenzoFx—Litecoin filled 25% of the bearish fair value gap from Friday’s selloff, tapping into the $106.00 liquidity zone. The last candle is a bearish engulfing, signaling potential downside as both buyside and sell side liquidities were swept.
Resistance sits at $106.00. If this level holds, the downtrend may extend toward $85.50 and $78.60. The bearish outlook remains valid unless LTC/USD closes above $106.00 on the daily chart. A break above this level could trigger a move toward the upper line of the bearish channel.

No Bullish Setup for Litecoin YetFenzoFx—Litecoin is trading sideways near $98.3 after Friday’s sharp selloff. The 1-hour chart shows price respect at $92.40 minor support, but declining cumulative volume delta signals weakening buyer interest.
The overall trend remains bearish, with resistance at $102.4. LTC may tap into buyside liquidity above $102.9, but failure to hold could extend the downtrend toward $85.5 and $78.6. There’s no bullish setup at the time of writing. Traders should remain cautious, as the market is volatile and prone to erratic swings. Happy trading, everyone.

LTC: Sell Volume Is Being Absorbed, Bullish Run in FocusFenzoFx—LTC sits in the upper quadrant of the bullish fair value gap, aligned with anchored VWAP. Selling volume is rising, but price remains stable—suggesting absorption by large buyers.
Litecoin is currently at a premium, making it less ideal for new entries. We recommend monitoring the $109.3 support zone, backed by a low volume node, for a better entry.
If this level holds, LTC may rally toward $128.60 and $134.10. A break below $109.3 would invalidate the bullish outlook.

LTC/USD May Tap $110.5 Before DropFenzoFx—Litecoin is trading sideways. We expect LTC/USD to tick higher toward $110.5 before resuming its downtrend. If this scenario unfolds, the next bearish target is the $88.00 support area.
Please note, the bearish outlook remains valid unless price closes and stabilizes above the fair value gap near $114.00.

Litecoin: Bearish Outlook Holds Below $114FenzoFx—Litecoin dipped below $103.10 liquidity and rebounded, now trading around $105.9. The trend remains bearish, supported by lower lows and volume profile.
Following the sweep, LTC/USD may consolidate toward resistance, targeting the daily FVG mean threshold near $110.5. If buying pressure continues, the gap could be filled up to $114.00.
The bearish outlook remains valid below $114.00, with potential downside targeting liquidity at the $88.00 area. A close above $114.00 would invalidate this view.

Litecoin: Liquidity Sweep Signals ConsolidationFenzoFx—Litecoin dipped to $103.0, its lowest in 40 trading days, and now trades near $106.5, recovering 0.70% today. Support remains at $103.00. Liquidity below this level has been swept, suggesting an inside candle formation. The sharp decline left a fair value gap with a mean threshold at $110.3.
Technically, Litecoin stays bearish below $112.0. However, the recent liquidity sweep points to a possible consolidation toward $110.3. Note: The bearish outlook is invalidated if LTC/USD exceeds $112.0.

Litecoin: Support at $112.10 Key to ContinuationFenzoFx—Litecoin continues its bullish structure, trading around $116.4 after forming a double bottom below $113.00. This move led to a close above the bearish order block at $117.00, reinforcing bullish sentiment.
Immediate support is at $112.10. If this level holds, LTC/USD may resume its uptrend, targeting the equal highs at $123.40.
However, if price declines and stabilizes below $112.10, the bullish outlook will be invalidated. In that case, Litecoin could consolidate toward the next support at $106.80.
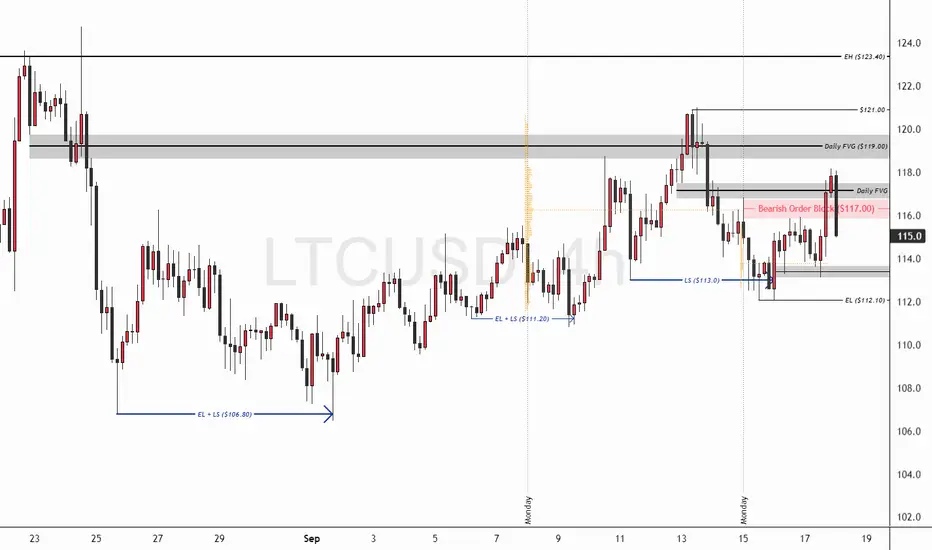
Litecoin Stabilizes After Liquidity SweepFenzoFx—Litecoin trades sideways, up nearly 1.0% today, currently around $113.80. The recent momentum may stem from the liquidity sweep below $106.80 on September 1st. However, RSI hovers above 70.0, indicating overbought conditions.
Immediate resistance stands at $116.30. Technically, Litecoin hasn’t cleared significant buy-side liquidity, so we remain neutral until price reaches this level. The resistance appears to be the next target following the sell-side liquidity sweep.

LTCUSD Will it resume the uptrend and hit $165?Litecoin (LTCUSD) has been trading within a Channel Up pattern since the April 07 Low and in the past two weeks has found itself declining, being on the new Bearish Leg of the pattern.
This decline has hit already the 1D MA50 (blue trend-line), where despite the break-out, the price is consolidating around it. Based on the previous Bearish Leg, which reached the 0.618 Fibonacci retracement level before making a Higher Low and rebound into the new Bullish Leg, LTC can reach 95.00 before initiated the next rally.
However, the 1D RSI just hit its 5-month Higher Lows trend-line, which indicates that the price might reverse now instead of lower. A sound strategy to account for both possibilities would be to split your normal position size into half and enter both now and if the RSI Higher Lows break, use the rest for one final buy lower.
In any case, our long-term Target is the -0.382 Fibonacci extension (like the previous Bullish Leg) at $165.00.
-------------------------------------------------------------------------------
** Please LIKE 👍, FOLLOW ✅, SHARE 🙌 and COMMENT ✍ if you enjoy this idea! Also share your ideas and charts in the comments section below! This is best way to keep it relevant, support us, keep the content here free and allow the idea to reach as many people as possible. **
-------------------------------------------------------------------------------
💸💸💸💸💸💸
👇 👇 👇 👇 👇 👇

Litecoin Eyes Reversal from $112.5 SupportFenzoFx—Litecoin currently trades near $115.5, having swept last week's low liquidity. This level is supported by a bullish fair value gap, with key support at $112.5, offering a potential reversal point.
Immediate resistance stands at $117.4. A close above this level could trigger a bullish wave toward the next supply zone at $123.3.

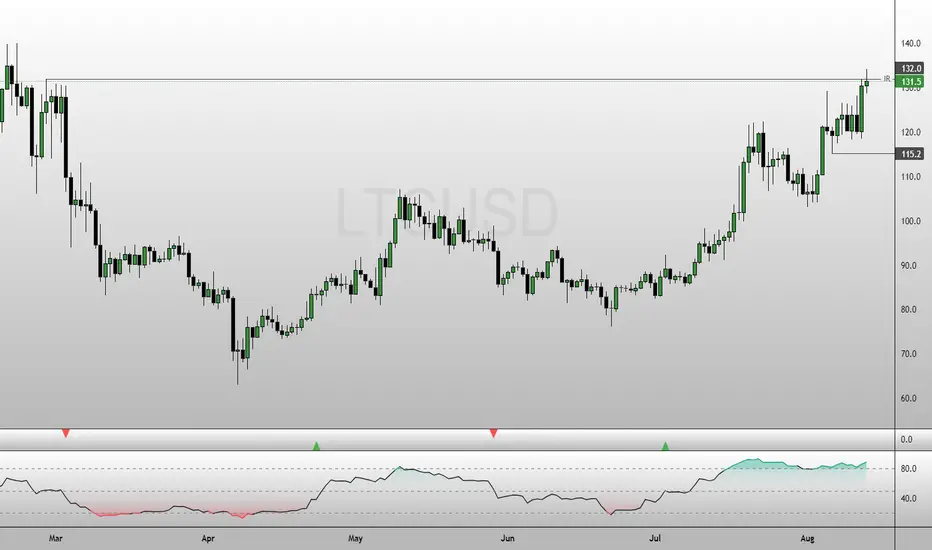
Litecoin Pulls Back After Sweeping February HighsFenzoFx—Litecoin swept liquidity above February’s highs. The market is currently overbought, suggesting potential consolidation. Entering at current levels may be risky, so waiting for a pullback toward lower support zones is advised.
If consolidation unfolds, LTC could target liquidity near the $115.2 support level.
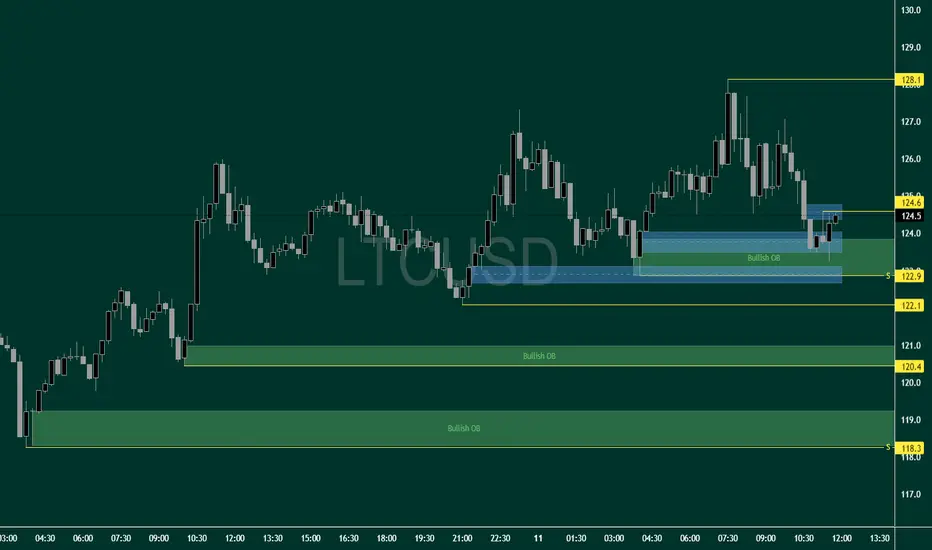
Litecoin Tests Bullish Order BlockFenzoFx—Litecoin dipped to the bullish order block. A close above $124.6 with a fair value gap could trigger the uptrend, targeting recent highs at $128.1.
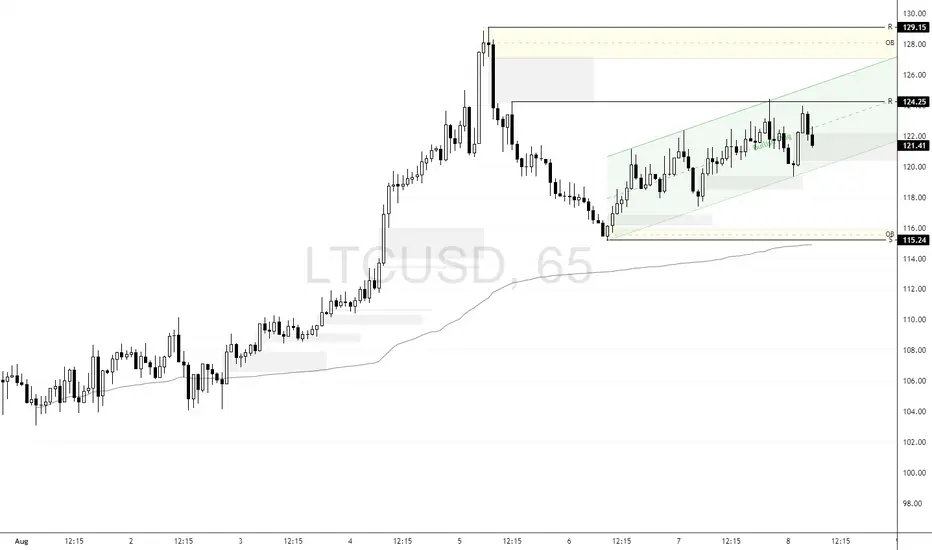
Litecoin Eyes Buy Side Liquidity Shift After $124.2 SweepFenzoFx—Litecoin remains in a bullish channel, with the current wave originating from the order block at $115.2. LTC now trades around $121.7.
Yesterday, it swept liquidity above the $124.2 resistance, signaling a potential shift toward bearish pressure. If momentum fades, price may revisit the $115.2 support zone.
However, if LTC/USD closes above $124.2, this bearish outlook is invalidated. In that case, the next target is the order block with resistance at $129.1.
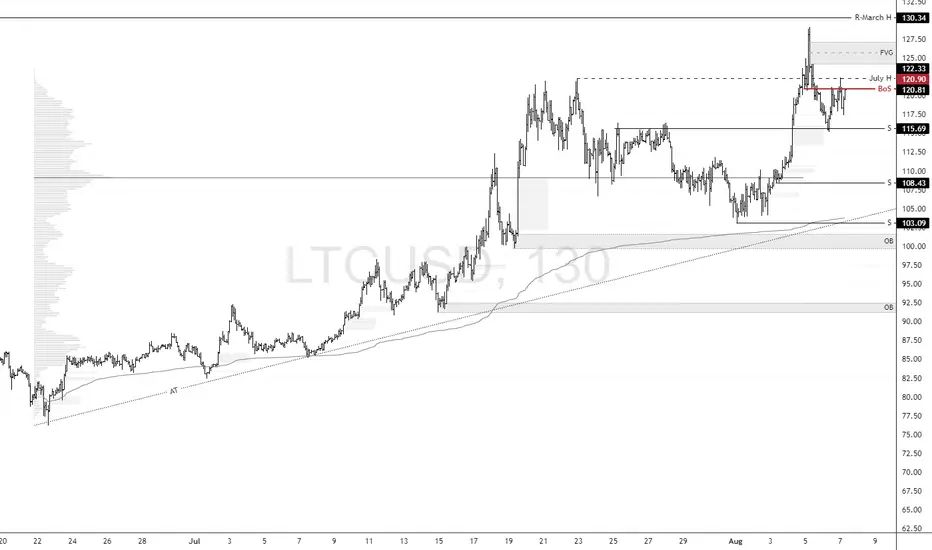
Litecoin: Eyeing Discount Entry Near $108FenzoFx—Litecoin's uptrend stalled near March’s peak at $130.3, a strong resistance level. The price now trades at $120.7, below July’s high, breaking the bullish structure.
Immediate support lies at $115.6. A bearish close below this level could trigger further downside toward $108.4. This zone is backed by a volume point of interest, offering a potential discount entry aligned with the broader bullish trend.
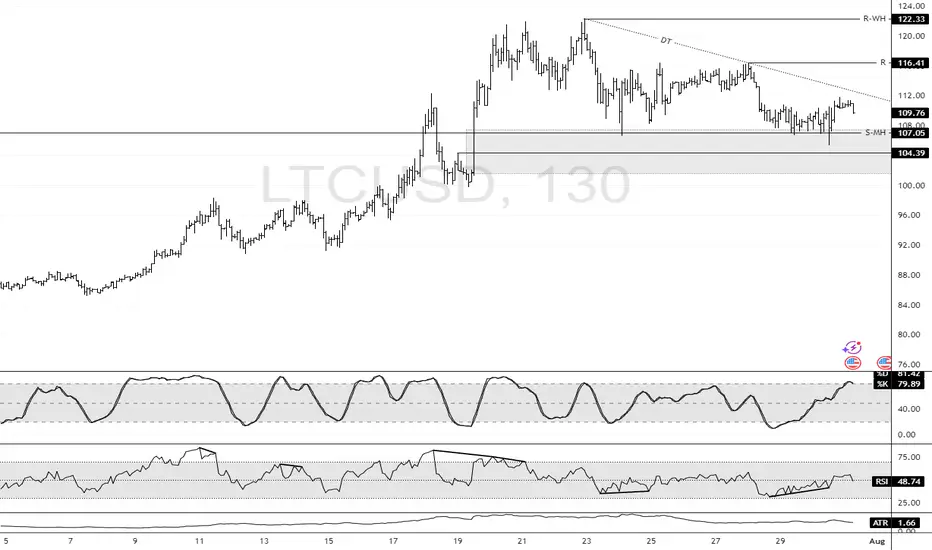
LTC: Bullish Structure Intact Above $104.3 SupportFenzoFx—Litecoin swept liquidity below $107.0 during today’s session and is currently trading near $110.0, supported by a descending trendline.
Technically, key support stands at $104.3. As long as this level holds, the bullish outlook is preserved. A break above the descending trendline could propel LTC toward the previous highs at $116.4 and potentially $122.3.
Litecoin: VWAP and Oversold Signal Potential BounceFenzoFx—Litecoin formed a double top at $116.4, causing a price dip. Currently, LTC trades near $110.1 after forming a double bottom. The Stochastic Oscillator is in oversold territory, suggesting a potential bounce, supported by VWAP from July 15.
Technically, if LTC holds above $110.1 and key support at $104.0, the uptrend could resume. In this scenario, the bullish targets would be $116.4 and $122.3.

Litecoin Retests $112.3 Support Amid Bullish MomentumLitecoin remains bullish above the 50-day SMA, supported by an ascending trendline. As of now, LTC trades near $113.0, retesting this area as support. A sustained hold above the trendline could initiate another bullish leg, targeting resistance at $130.3.
However, a close and stabilization below the trendline would invalidate this outlook and suggest increased selling pressure.

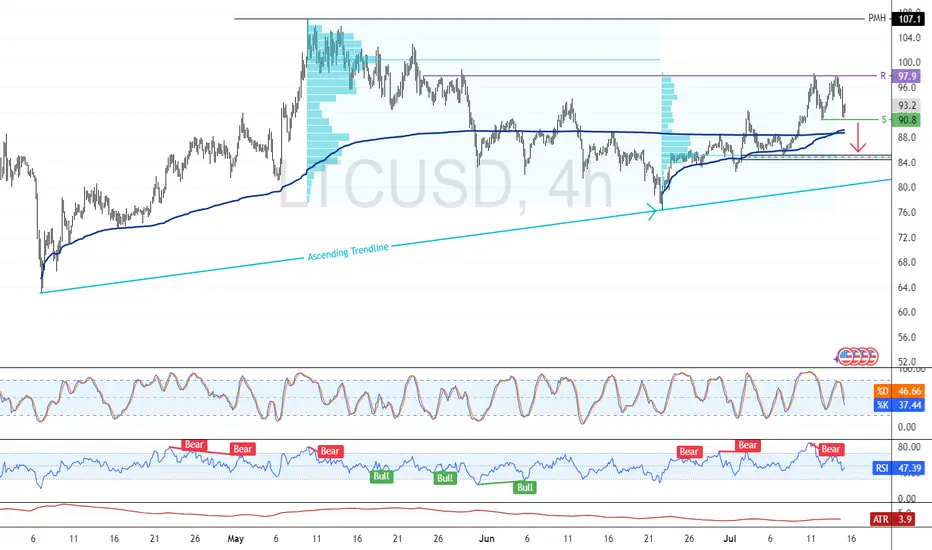
Litecoin: Volume-Heavy Resistance Caps RecoveryFenzoFx—Litecoin fell 2.50% today, forming a double bottom at $90.80. If bears stabilize the price below this level, the decline could extend toward $85.20 support.
Resistance at $97.90 aligns with a high volume zone, reinforcing bearish pressure and making a breakout challenging.
Bearish Trend Persists: Litecoin Targets $71.0FenzoFx—Litecoin is trading at $75.9 after closing below $76.4 and testing it as resistance. The Stochastic Oscillator signals oversold conditions, suggesting a possible price bounce, although the bearish trend persists below $80.0.
If the bearish momentum continues, the next target could be $71.0.
Alternatively, stabilization above $80.0 may extend gains toward $88.5.
>>> No Deposit Bonus
>>> %100 Deposit Bonus
>>> Forex Analysis Contest
All at F enzo F x Decentralized Forex Broker

LTC's Bullish Momentum Eased at $80.0FenzoFx—Litecoin's uptrend eased at the $80.0 resistance level. A close above this resistance could trigger the uptrend, targeting $88.5.
The support is at $76.4.
>>> $1,600 prize pool > Join FenzoFx Forex Analysis Contest
