LITECOIN (LTCUSDT/LTCBTC) Daily Trade Setups 2021/02/20Hi guys! I will be sharing the trades that I take in real time, follow to see how my trades work out!
If you like this post, please support me by clicking the like and follow buttons. Also feel free to share your thoughts and analysis in the comments below!
And don’t forget to check out my daily analysis on Bitcoin, Ethereum, and Altcoins!
Trade Setups
Below are the potential trade setups that I would be interested in trading:
LTCUSDT
Long Trade Setup #1: Retest and Continuation (200MAs)
1. Price Action: Price needs to move back down to the 200MAs, currently projected to be @ $220 by the time price reaches it, and bounce back up.
2. Trade Entry Confirmations: Bullish candlestick pattern, above average volume, MACD bottoming
Long Trade Setup #2: Breakout and Continuation
1. Price Action: Price breaks above and falls back down to $247 and bounce back up.
2. Trade Entry Confirmations: Bullish candlestick pattern, above average volume, MACD bottoming
Short Trade Setup #1: False Breakout
1. Price Action: Price breaks above and then falls below the high @ $247, forming a bull trap
2. Trade Entry Confirmations: A breakout candlestick followed by a breakdown candlestick, above average volume on both breakout candle and breakdown candle, MACD topping out
About Me
I started trading in 2008, first got introduced to bitcoin in 2009, and have been actively trading cryptocurrencies since 2016.
I have worked on Wall Street trading bonds, stocks, and options.
I have taken hundreds of live trades, each recorded with over 50 data points, all meticulously analyzed, using data analysis and modeling to optimize win probability and risk reward.
Why Follow Me
Daily analysis on the latest market movements and price zones for high probability trade setups.
Sharing of live trades that I take.
A great place to help each other, learn from each other, and grow together.
Trading education including a comprehensive cryptocurrency trading eBook, personal advice, and other educational materials
Constantly testing and adding new trading strategies and refining battle-tested ones.
DISCLAIMER: I am NOT a financial advisor and this post is NOT financial/investment/trading advice. I will not be responsible for any actions you take based on the analysis and comments that I provide. I am simply sharing what I am doing, and is not meant to be investment or trading advice. What you choose to do with the information that I provide is your own sole responsibility! The cryptocurrency market is extremely volatile, and you WILL lose all your money if you are inexperienced! DO NOT risk any money that you cannot afford to lose and always be cautious and manage your risk!
Please support me by liking and following, and sharing your ideas and analysis in the comments! Thanks!
Litecoinsignals

LITECOIN (LTCUSDT/LTCBTC) Daily Trade Setups 2021/02/18Hi guys! I will be sharing the trades that I take in real time, follow to see how my trades work out!
If you like this post, please support me by clicking the like and follow buttons. Also feel free to share your thoughts and analysis in the comments below!
And don’t forget to check out my daily analysis on Bitcoin & Ethereum!
Trade Setups
Below are the potential trade setups that I would be interested in trading:
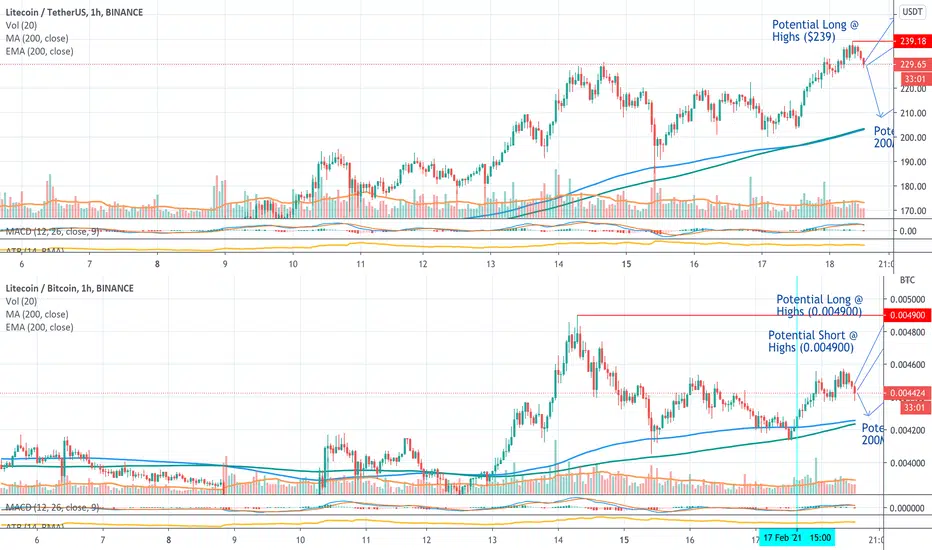
LTCUSDT
Long Trade Setup #1: Retest and Continuation (200MAs)
1. Price Action: Price needs to move back down to the 200MAs, currently projected to be @ $205 by the time price reaches it, and bounce back up.
2. Trade Entry Confirmations: Bullish candlestick pattern, above average volume, MACD bottoming
Long Trade Setup #2: Breakout and Continuation
1. Price Action: Price breaks above and falls back down to $239 and bounce back up.
2. Trade Entry Confirmations: Bullish candlestick pattern, above average volume, MACD bottoming
Long Trade Setup #1: False Breakdown
1. Price Action: Price breaks below the then rapidly climbs above $239, forming a bear trap
2. Trade Entry Confirmations: A breakdown candlestick followed by a reclaiming candlestick, above average volume on both breakdown candle and reclaiming candle, MACD bottoming
LTCBTC
Long Trade Setup #1: Retest and Continuation (200MAs)
1. Price Action: Price needs to move back down to the 200MAs, currently projected to be @ 0.004300 by the time price reaches it, and bounce back up.
2. Trade Entry Confirmations: Bullish candlestick pattern, above average volume, MACD bottoming
Long Trade Setup #2: Breakout and Continuation
1. Price Action: Price breaks above and falls back down to 0.004900 and bounce back up.
2. Trade Entry Confirmations: Bullish candlestick pattern, above average volume, MACD bottoming
Long Trade Setup #1: False Breakdown
1. Price Action: Price breaks below the then rapidly climbs above 0.004900, forming a bear trap
2. Trade Entry Confirmations: A breakdown candlestick followed by a reclaiming candlestick, above average volume on both breakdown candle and reclaiming candle, MACD bottoming
About Me
I started trading in 2008, first got introduced to bitcoin in 2009, and have been actively trading cryptocurrencies since 2016.
I have worked on Wall Street trading bonds, stocks, and options.
I have taken hundreds of live trades, each recorded with over 50 data points, all meticulously analyzed, using data analysis and modeling to optimize win probability and risk reward.
Why Follow Me
Daily analysis on the latest market movements and price zones for high probability trade setups.
Sharing of live trades that I take.
A great place to help each other, learn from each other, and grow together.
Trading education including a comprehensive cryptocurrency trading eBook, personal advice, and other educational materials
Constantly testing and adding new trading strategies and refining battle-tested ones.
DISCLAIMER: I am NOT a financial advisor and this post is NOT financial/investment/trading advice. I will not be responsible for any actions you take based on the analysis and comments that I provide. I am simply sharing what I am doing, and is not meant to be investment or trading advice. What you choose to do with the information that I provide is your own sole responsibility! The cryptocurrency market is extremely volatile, and you WILL lose all your money if you are inexperienced! DO NOT risk any money that you cannot afford to lose and always be cautious and manage your risk!
Please support me by liking and following, and sharing your ideas and analysis in the comments! Thanks!
Is this the start of the parabolic run for LITECOIN?This is a simple comparison on LTCUSD of the current cycle with the previous. As seen on the chart, on March 2017, Litecoin broke above the accumulation sequence that was contained under a Lower Highs trend-line and that 1W candle was what kick-started its parabolic Bull Run.
Right now the situation is exactly the same. The current 1W candle is the strongest since April 2019 and just broke above the Lower Highs trend-line with the MA50 well is support. Can this be the start of the new parabolic run?
This is something I looked at last time in September:
** Please support this idea with your likes and comments, it is the best way to keep it relevant and support me. **
--------------------------------------------------------------------------------------------------------
!! Donations via TradingView coins also help me a great deal at posting more free trading content and signals here !!
🎉 👍 Shout-out to TradingShot's 💰 top TradingView Coin donor 💰 this week ==> johnmcal3
--------------------------------------------------------------------------------------------------------

LITECOIN Is it a lost cause?In my book, LTC has been one of the disappointments of the year. The main reason is the inability to break the Lower High trend-line of the long-term Channel Down on the 1W chart. In fact, the recent mid-August top was made exactly on the trend-line.
There is light in the tunnel though as the RSI is slightly ascending, while the LMACD is stable too and since the December 2018 bottom we haven't made a Lower Low. However in my opinion it is now or never and the Channel Down should break upwards before the end of the year if LTC wants to revitalize investor confidence.
Do you think the time to break above is approaching?
** Please support this idea with your likes and comments, it is the best way to keep it relevant and support me. **
!! Donations via TradingView coins also help me a great deal at posting more free trading content and signals here !!
Shout-out to TradingShot's top TradingView Coin donor this week ==> NilBalance

LITECOIN The leading indicator for BITCOIN?I've published the very same pattern back in December 2018 when the previous Bear Market was at its lows and while everyone was panicking, called for a potential Bottom on Bitcoin and a Bull Run to follow.
Why? Simply because of the Litecoin break-out relative to BTC. As you see on this very simple chart, every time the LTCBTC pair breaks its Lower Highs trend-line (blue line), Bitcoin initiates a new Bull Run. Out of the past 4 occurences, only once failed to delivered a new BTC bull run, and rightly so as it happened at the top of Bitcoin's Bull Cycle (whoever bought near 20k was responsible for their actions).
Are you waiting for this break-out to take place on LTCBTC? Feel free to share your work and let me know in the comments section!
Please like, subscribe and share your ideas and charts with the community!

LTCBTC Buy SignalPattern: Channel Up on 1D.
Signal: Bullish as a Golden Cross took place and the sequence is similar to the one that led to the parabolic move of February - April 2019.
Target: 0.01200 (Lower High trend line).

LTCUSD Did Litecoin bottom?Litecoin just broke above the Lower High trend line that started with the June 2019 top. Is this a Bottom and thus a long term bullish sign?
Well a quick comparison with the Dec 2018 - Jan 2019 bottom sequence shows that when the long term Lower High trend line (dashed) breaks, the Bottom is in. The RSI sequences of the two periods is also similar. So what I am expecting is a pull back to LTC's high volatility zone in order to gather up some more buying momentum and then an even stronger rebound towards the 1W Resistance. $64.000 seems like a good first Target for long term traders.

LTCBTC Cyclical Buy SignalPattern: Channel Down on 1D.
Signal: Bullish as the Channel Down broke to the upside and the price crossed the 1D MA50 by a wide margin similar to December 2018.
Target: 0.01400 (0.786 Fibonacci retracement on the wide 1M Lower High trend line).

LTCUSD Buy SignalPattern: Channel Down on 1D.
Signal: Bullish as the pattern broke upwards (Lower High line) on an RSI bullish divergence.
Target: 110.00 - 120.00.

LTCUSD Litecoin SHORT 1 HR Bad Day for CrytosHello to all watching my charts.
LTCUSD is in Short mode like ETHUSD also.
Here in LTC Litecoin its in addition
a broken trendline which has been last from 17.10.2019
till now and Litecoin have been sitting up and jumped
up from that line at least minimum 5 times.
If such an important Long trendline is broken there is
something change big coming in short , thats my oppinnion.
If you want to know more about my trading style
please send my a mail.
Good trades
Renkotrade

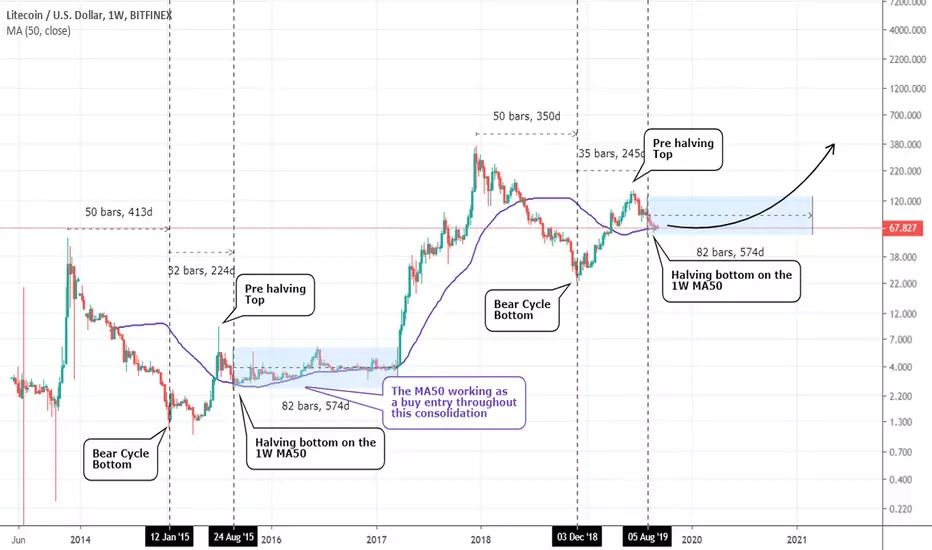
LITECOIN Found support on 1W MA50. Will history repeat itself?The title really says it all. LTC is trading around the 1W MA50 on a possible mid term support event for the current Bull Cycle, which is methodically repeating the 2015 sequence. This MA period previously held throughout 2015 - early 2017 up until Litecoin initiated its super strong rise to the mid $300s peak.
Notice how the Top-to-bottom and bottom-to-Halving bottom phases between the 2 cycles have been virtually identical.
There is no reason to expect something different this time. Unless we see a major divergence below the 1W MA50, I expect this level to attract buyers and give sporadic spikes on a lengthy consolidation until the next super strong parabolic rise.
Litecoin made the Halving bottom. Long term consolidation ahead.LTC just experienced the Halving event. The current cycle is repeating methodically the 2015 sequence and so far we have reached the point where the 1D MA200 is supporting. This MA period previously held throughout 2015 - early 2017 up until Litecoin initiated its super strong rise to the mid $300s peak.
There is no reason to expect something different this time. Unless we see a major divergence below the 1D MA200, I expect this level to attract buyers and give sporadic spikes on a lengthy consolidation until the next super strong parabolic rise that should come through massive adoption.

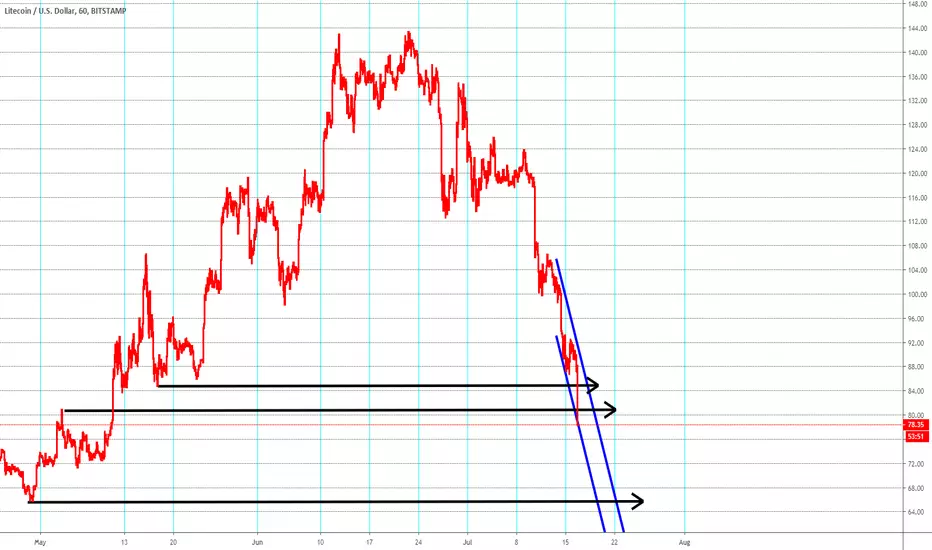
Litecoin LTHUSD SHORT All Supports Broken 1 HR Chart#Litecoin # Bitcoin #Ethereum #LTCUSD # BTCUSD
Hellot o all watching my charts.
Short is the game to play in all cryptos since some days.
I do hope you have followed ,my charts and have seen the sinals
yourself and are winning money.
Now one support after the other brakes , as i write that
next support have been broken.
Next Hold is 66 USD !!
Difficult to write that as the pair has traded as double
prices 1 week ago...
But only reality counts..
If you want to support my work and my charts please like the,
Good trades
Renkotrade
Litecoin LTCUSD LONG 1 HR ChartHello to all watching my charts
Litecoin LTCUSD is similar to Bicoin at the moment on a run move long.
THe charts of these pair is much stronger than Ethereum ETHUSD
Both of my trendchannels are showing a long rund
AND the shorttime channel which shows us the next direction at first
is getting up an up, so showing us, that the long trend is very fine.
I do hope you are in a long position
-
-----
Here a additional info for all who ask me to draw other lines..
My channels shown here in the chart are NOT manual line draws from
high to high and low to low.
They are the resulat of a complex mathematical system, which is my personal
trading system, and they have different timeframes have also adjustable
different deviation in % from the actual price as forecast
ALSO they change the forecast ever TICK in Realtime and calculate the channels new.
-------
If you want to support my work and my charts, please like them..
Good trades
Renkotrade

LTCUSD Road-map to the previous All Time HighsLitecoin is trading on a very simple pattern. On the Fibonacci Channel, every level crossed eventually turns into a support. While this support is provided, LTC is targeting the Lower Highs of the former bear cycle. If this sequence is sustained then the next targets are 185.000 and 370.000.

LITECOIN = The Silver of Cryptos?Since it's Crypto/ Commodity comparison week and I saw the great interest the community had on my Bitcoin/ Gold comparison, I thought I would try another one.
As I was crossing charts I stumbled upon this one: Litecoin and Silver. As with BTC and Gold, the time frames are different (1W for LTC, 1M for Silver) as Silver is a traditional commodity used commonly for centuries.
What is undeniable are the striking similarities between the two charts:
1st Bull cycle with aggressive parabolic rise. More than -90% bear market decline. Long term consolidation. Less aggressive 2nd Bull cycle. Today.
*Note that this idea is intended to highlight the similarities between the two and nothing more.
Would you argue that Litecoin is the Silver of cryptocurrency? Let me know in the comments section!
BITCOIN - GOLD comparison:

What's the top for Litecoin? 113 or 180? Is it worth waiting?Litecoin has continued its crazy rise since the December 2018 bottom and only recently made the Golden Cross (MA200/50) which paved the way for last week's $98 Top.
You can't say I didn't warn you about this super aggressive rise in February when LTC was trading at $49 as seen below:
Now, almost 100% higher it may be a good idea to take profit. There are two scenarios that can play out:
A top at 113.00, which is according to the 2014/15 bear market the spot where the price topped on -36% from the MA200 top.
A top at 180.00, which is the +718% rise from December's bottom.
In both cases LTCUSD should then pull back around -70% and consolidate for a long period of time before the next bull market.
So long term traders should manage their profit taking accordingly.

LTCUSD Buy SignalPattern: Channel Up on 1D.
Signal: Bullish after the 1M Channel Down broke to the upside.
Target: 67.000 (the next level of resistance).

Is 180 next for Litecoin?I feel that the chart is clear enough to explain the idea behind it.
Litecoin's two bear markets (2014-2015 and 2018-2019) share a similar pattern behavior. A Buy Signal occurred in May 2015 after the bottom was made in January and a support was formed. The price broke a Lower High trend line and rallied nearly +700%. The duration from the bottom to the rally's high was 181 days.
The very same Buy Signal has emerged this February (2019). It is again after December's 2018 bottom and again broke the Lower High trend line.
Can this be a call for a +700% rally to 180.00? This chart certainly shows is can be.
